

CLion 2017.3 released with C++ support improvements, Valgrind Memcheck, Boost.Test and much more

Please welcome CLion 2017.3!
This year’s third release of CLion managed to accomplish both missions – bring dozens of C++ language support fixes, and overhaul and integrate new tools like Boost.Test and Valgrind Memcheck. Besides, v2017.3 updates a number of bundled tools, provides a simpler and more flexible way to configure toolchains, and improves the UI for running/debugging your applications.

Read on for more details and get a free 30-day trial to evaluate all the new features and enhancements:
- C++ language support improvements
- Integration with Valgrind Memcheck
- Support for Boost.Test
- Multiple toolchains and easier compiler configuration
- Run icons for main and tests
- Color schemes changes
- GDB 8.0 and LLDB 5.0
- Kotlin/Native support in CLion
Or watch this overview video from Phil Nash:
https://www.youtube.com/watch?v=HMJpf99na0I
C++ language support
Keeping our sights on making our C++ language support more correct than ever, as promised, we’ve started overhauling the key areas, implementing fixes from the bottom way up to the top. The two big areas affected in v2017.3 are list initialization and name lookup.
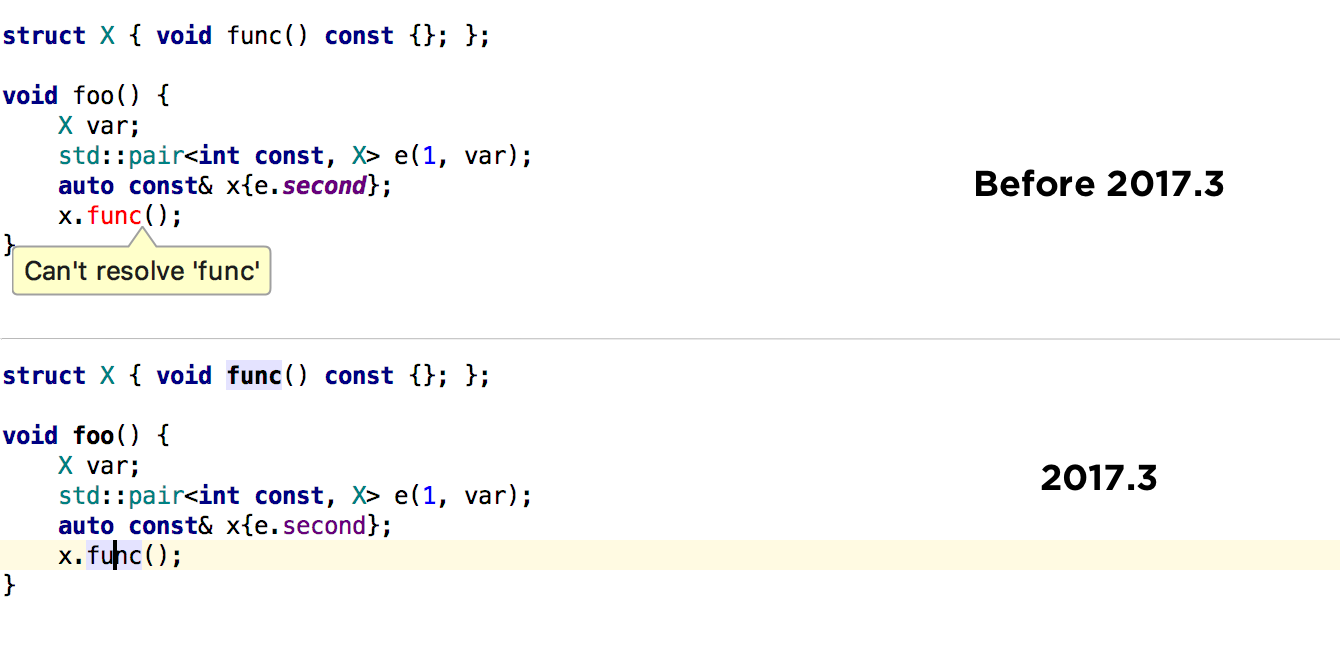
List initialization
List initialization is a standard way to initialize an object from braced-init-list since C++11. In v2017.3, we’ve reworked the way CLion handles it to avoid many false warnings and errors in code analysis (like “too many arguments”, “too few arguments”, “no matching constructor”, etc.). Among others, this has fixed the resolve for members of auto variables with uniform initialization, incorrect “parameter type mismatch” for boost weak pointer initialization, and invalid warnings for C99 union initializers:
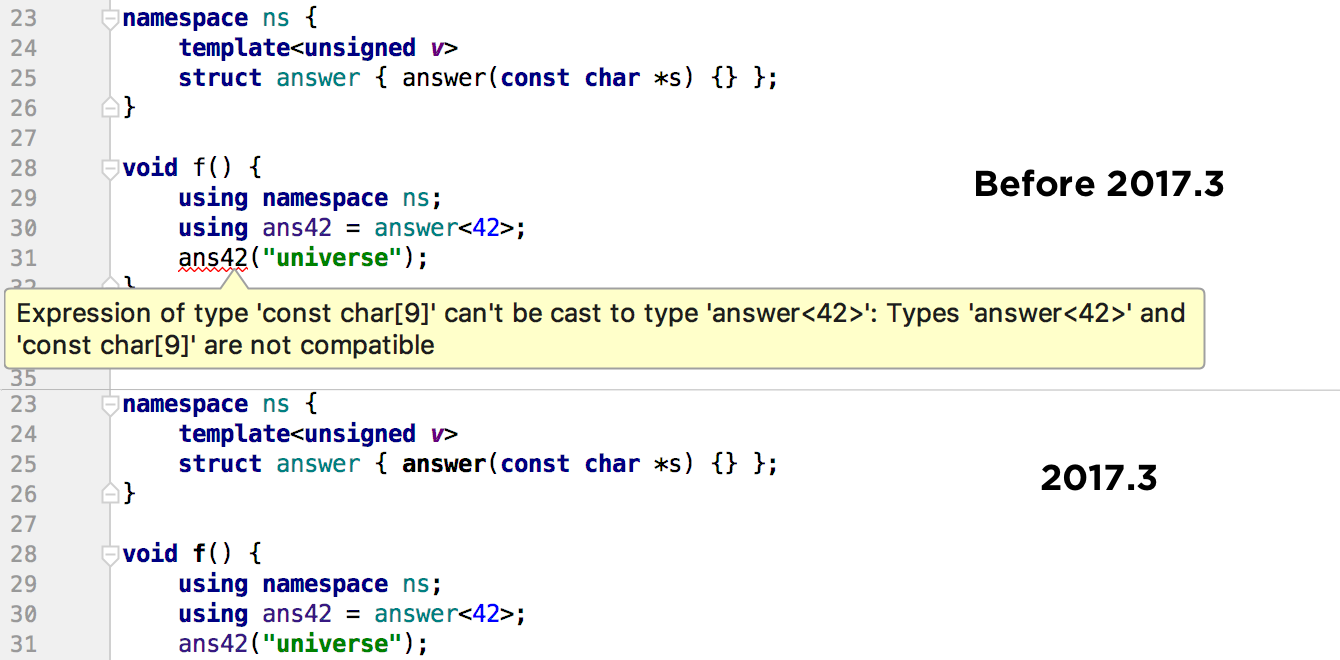
Name lookup
Name lookup is a C++ standard procedure to associate a name with a declaration. In this regard we have improved code analysis, code navigation, and more. The changes affect the resolve of the symbols brought into scope, for example, via class inheritance or a using construct. The fixes also introduced the correct resolve order in several cases where it failed previously:
MSVC extensions
Microsoft Visual C++ compiler is still working in experimental mode in CLion. If you have MSVC installed on your machine, enable the Registry option clion.enable.msvc and switch to MSVC in the Toolchains settings in CLion. You will now see significantly less incorrect code highlighting and fewer false errors from code analysis, as CLion 2017.3 provides support for MSVC extensions. Check the list of supported extensions here.
JUCE support
While these fixes are general, they are mostly noticeable for those who do cross-platform audio development with the JUCE library. The changes affect code analysis and navigation in many situations.
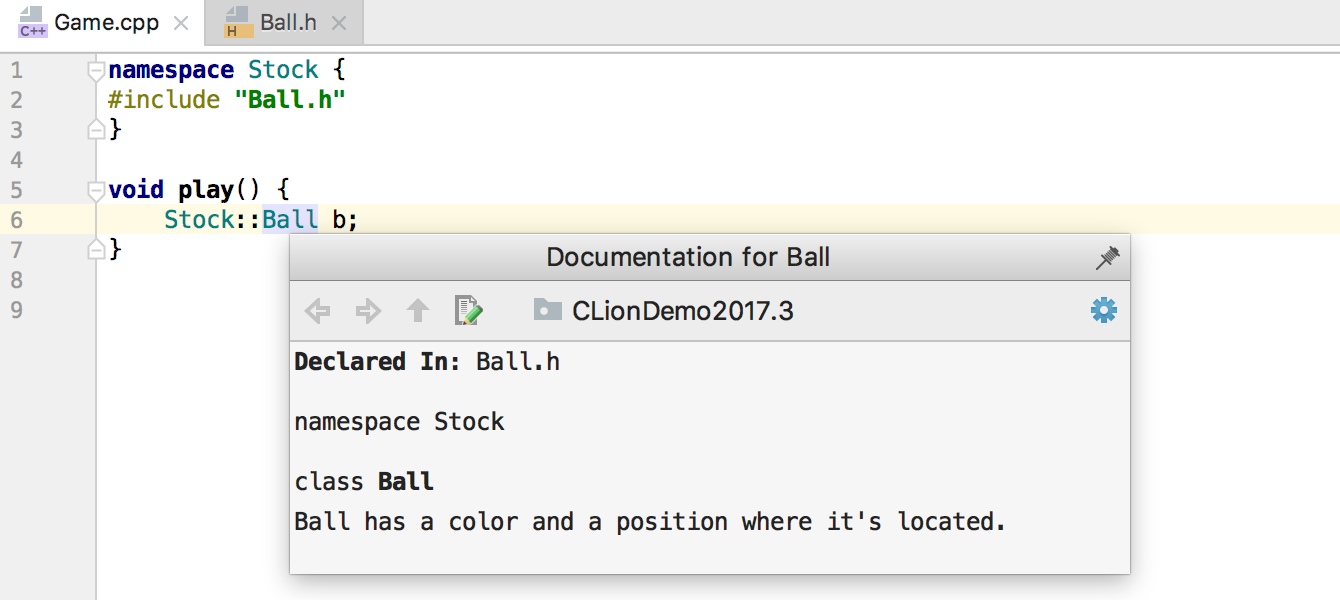
Even though JUCE 5.2 removed include directives inside namespaces, we still think this case is worth covering in general, so CLion 2017.3 supports it and resolves the symbols correctly:
Talking about JUCE a bit more, its v5.2 release brought CLion/CMake exporter support to Projucer, which means it’s now super easy to start developing your audio plugin with CLion. Just check this very short demo where I take a demo Projucer project and debug in CLion this audio plugin running in Ableton Live:
https://www.youtube.com/watch?v=-h8iumGX0WQ
And more
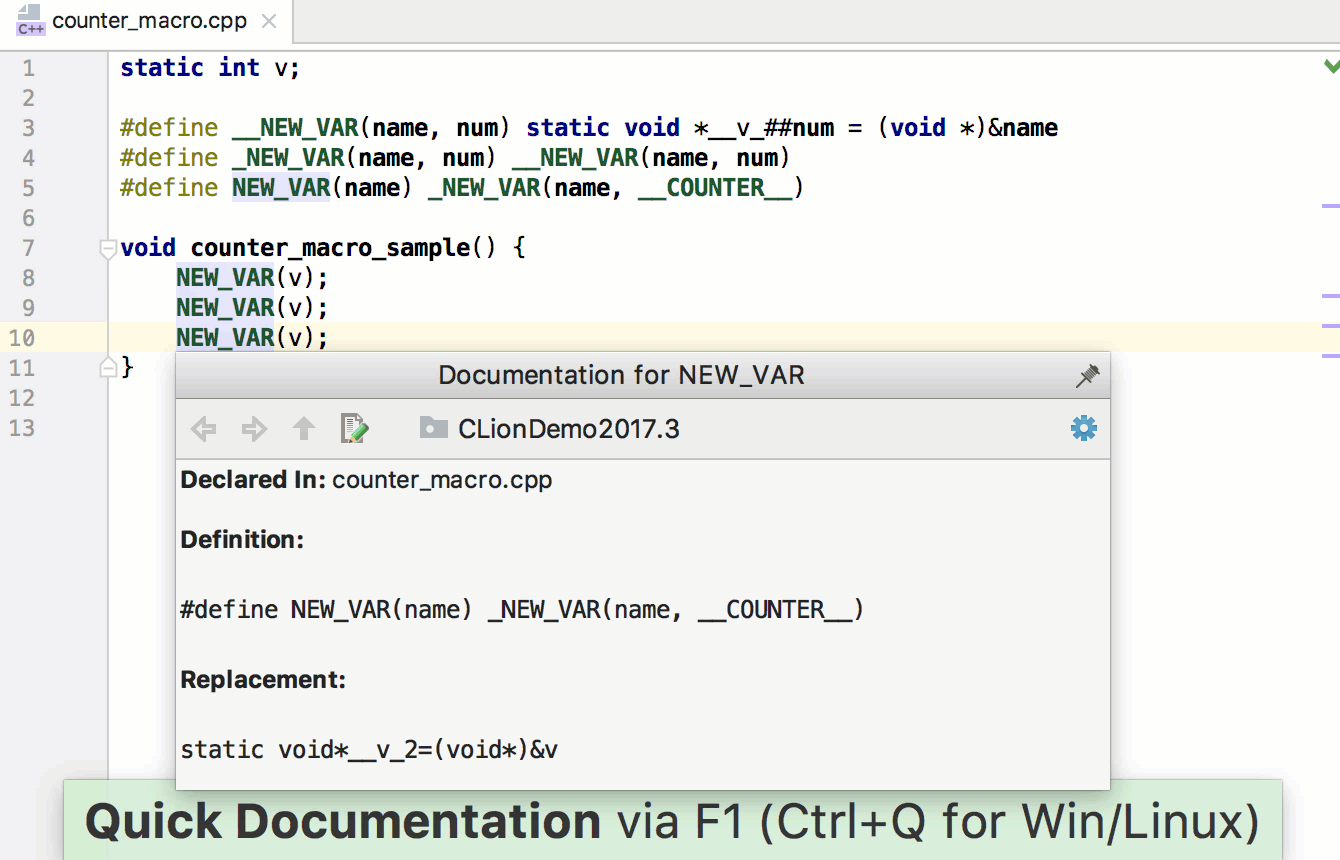
More changes in C++ language support include:
- Support for C++11 friend declaration syntax
- Support for the __COUNTER__ macro:
- Generate Definitions (
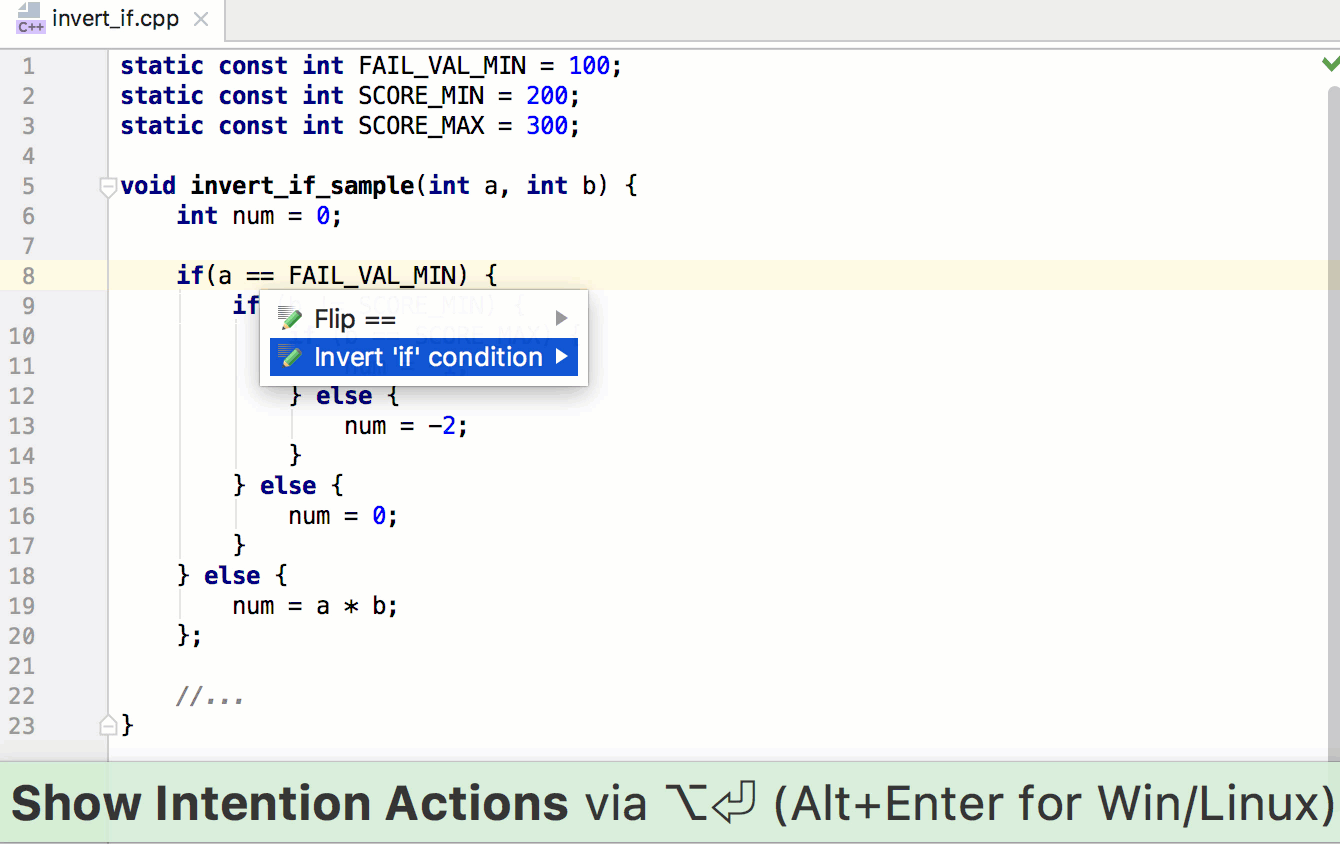
Ctrl+Shift+Don Linux/Windows,⇧⌘Don macOS) for function templates - New intention action to invert the condition in an
ifclause and flip itsif-elseblocks:
Valgrind Memcheck
Dynamic code analyzers are great for catching issues that static code analyzers miss or for finding possible inefficiencies visible only in runtime. The most famous tool sets for dynamic analysis are probably the Valgrind tool family and Google Sanitizers.
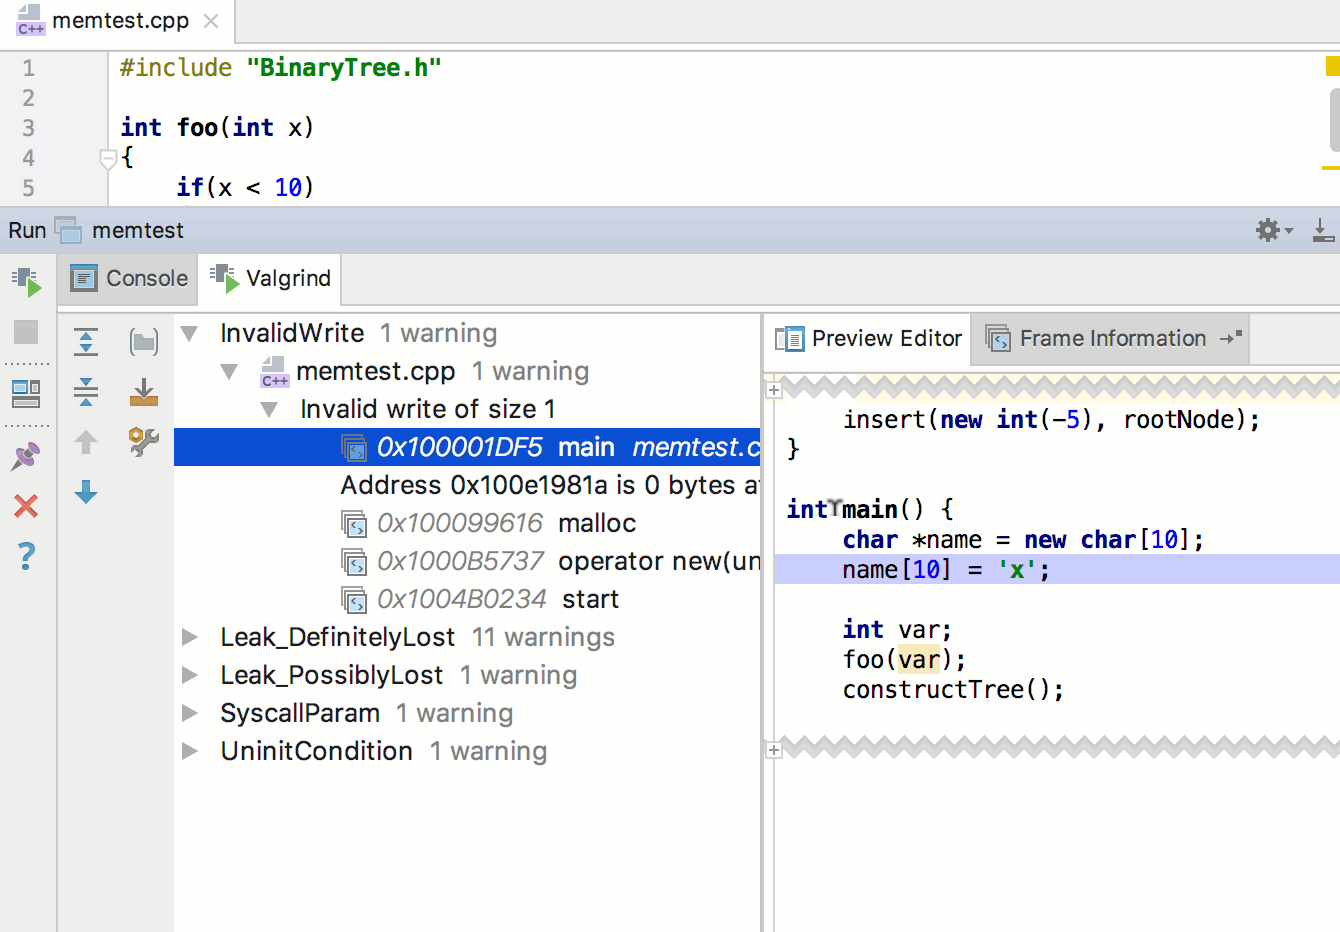
As a first step towards providing support for profiling tools, we’ve implemented an integration with Valgrind Memcheck (memory error detector in Valgrind) in CLion 2017.3. The most important benefits this choice are:
- Valgrind is a famous family of tools and Memcheck is probably the most used one from the whole family
- Valgrind supports multiple platforms
- Valgrind doesn’t require a program recompilation and supports both GCC and Clang
Note that Valgrind works only on Linux and macOS, which means these changes are, unfortunately, of no use to Windows users.
Memcheck is capable of catching the following problems:
- Invalid memory access (for example, accessing memory after free)
- Usage of the uninitialized (or derived from the uninitialized) values
- Mismatched malloc/free new/delete operations
- Overlapping
srcanddstpointers inmemcpyand related functions - Incorrect size value passed to the memory allocation functions
- Memory leaks
Learn how to configure and use Valgrind Memcheck.
Boost.Test
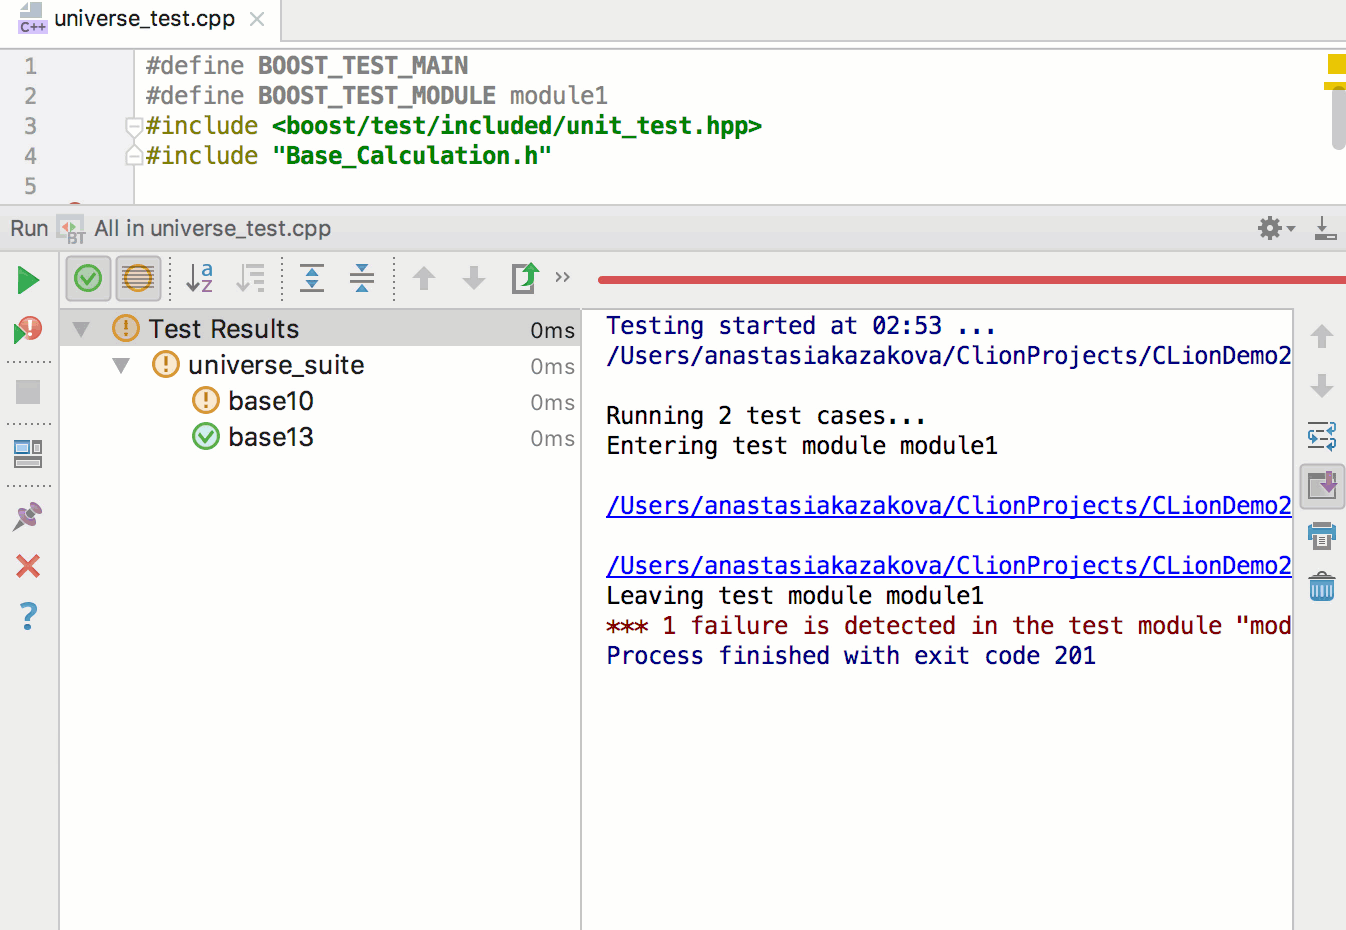
Boost.Test, the second most-used unit testing framework for C++, is now available in CLion 2017.3. Using it is similar to using Google Test and Catch frameworks, including special configurations to run Boost.Test and a built-in test runner:
Configuring multiple toolchains and compilers
This release introduces dozens of changes in this area. We’ll summarize them, describe the main use cases, and tell you about the final flow for configuring toolchains.
Toolchains & compiler settings
The main idea behind these changes is to allow you to use different toolchains for different projects in one IDE, or even inside one project for different configurations. Typical cases include:
- On Windows, use MinGW/Cygwin/Microsoft Visual C++ simultaneously
- Use different CMake versions
- Use different Make, C, and C++ compilers
- Use different debuggers (for example, bundled GDB for one configuration, some specific custom GDB version for another configuration, and LLDB for the third one)
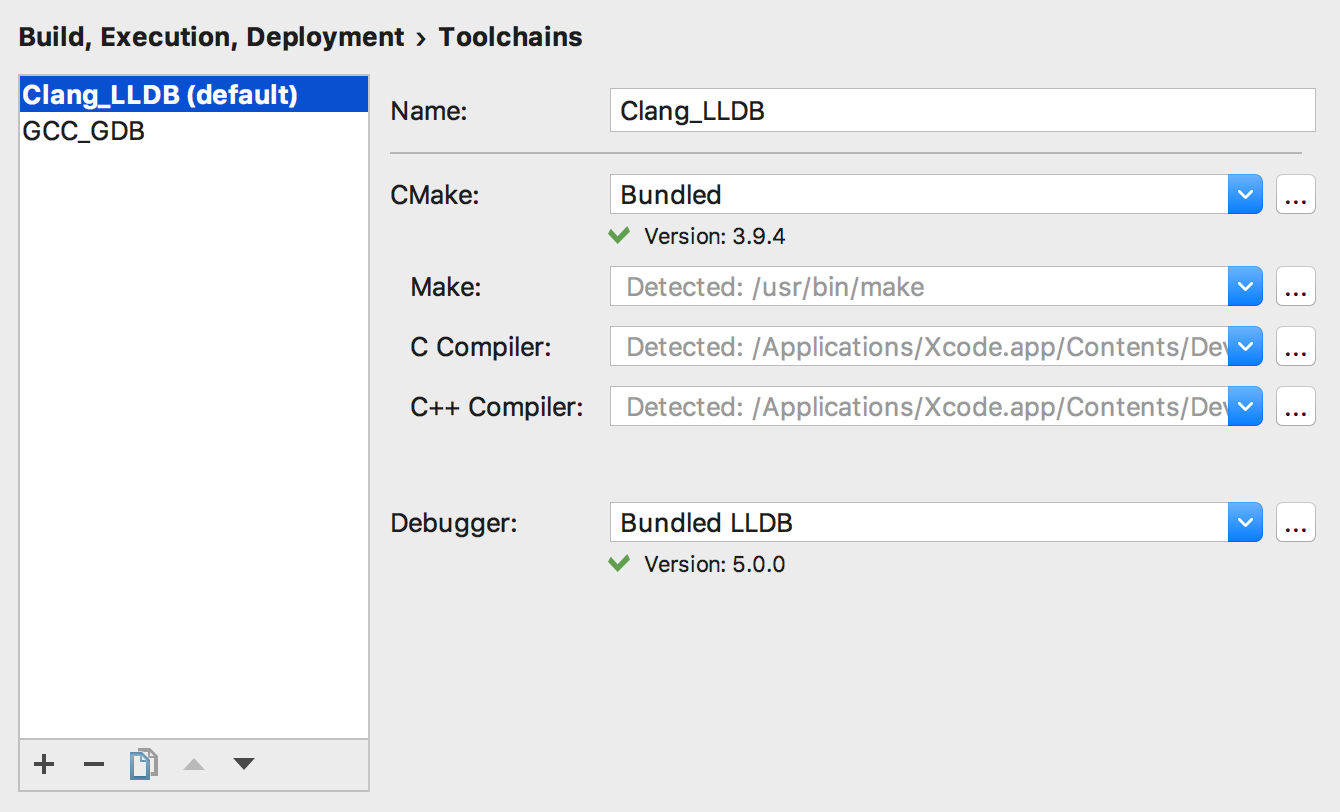
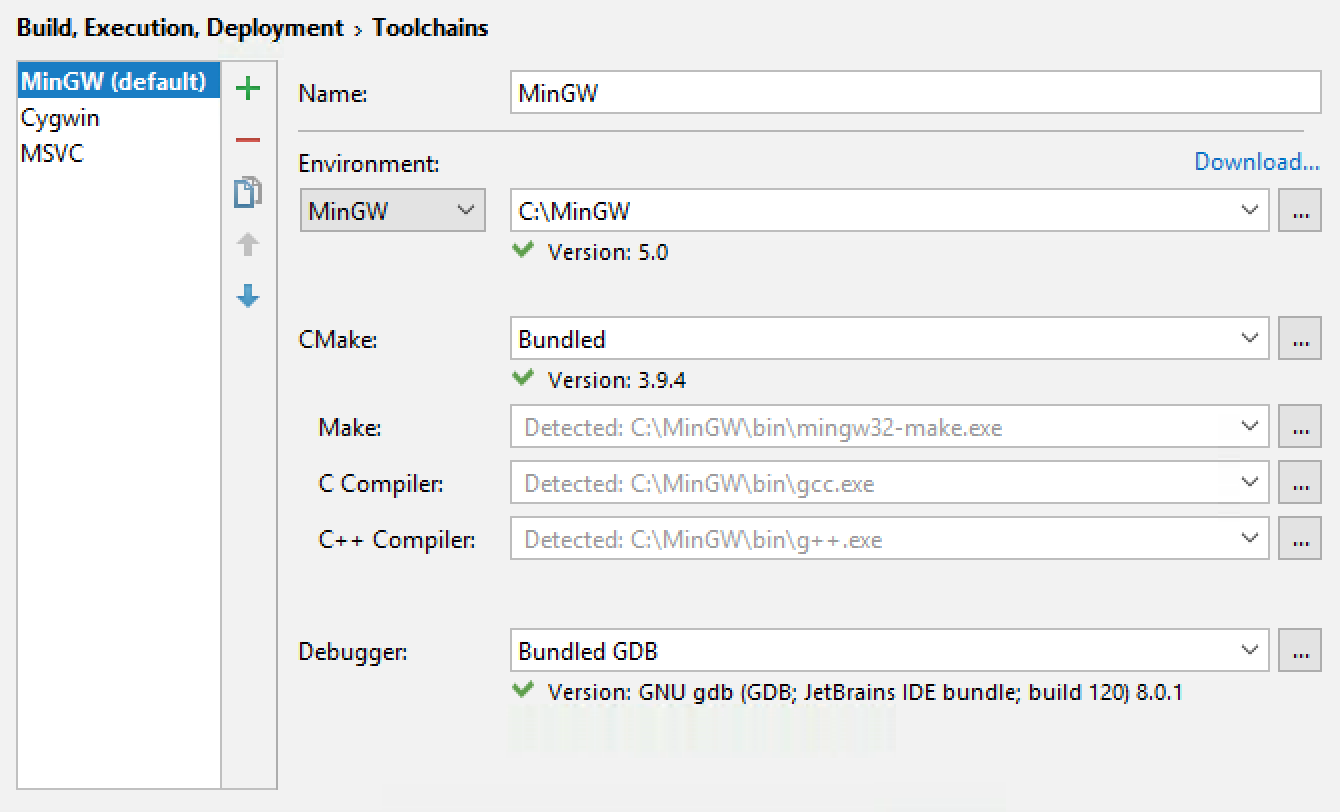
Configure toolchains in Settings/Preferences | Build, Execution, Deployment | Toolchains. The default one takes all system parameters from the platform used. Note that toolchains are configured per IDE (not per project), so you can simply configure all your toolchains there once and use them for all of your projects later.
Toolchains sample configuration on macOS:
Toolchains sample configuration on Windows:
CMake profiles & build type switcher
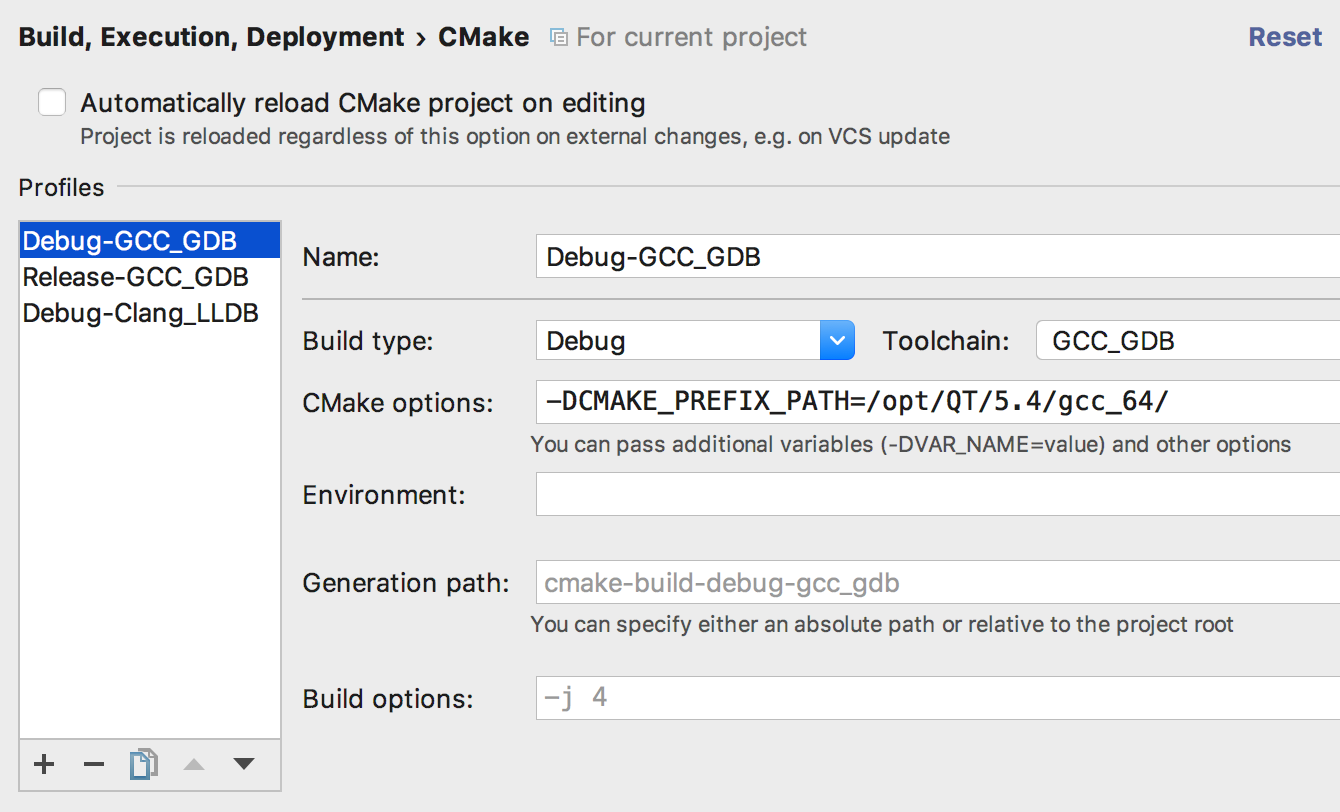
CMake profiles describe the set of settings used when CMake is run for the current project:
- Build type (Release, Debug, MinSizeRel, RelWithDebInfo and any custom one)
- Toolchain to be used (from the list of those configured in Settings/Preferences | Build, Execution, Deployment | Toolchains)
- CMake options
- Environment parameters
- CMake generation path (build output)
- CMake build options
The changes also make it possible to have several CMake profiles with the same build type but different set of settings, like toolchains for example (this was not the case before this release).
The typical use cases include:
- Create Debug and Release CMake profiles, and switch between them when running or debugging your application
- Create one CMake profile with Clang compiler and another with GCC, and switch between them when running or debugging your application
- On Windows, create MinGW, Cygwin and MSVC toolchains, create 3 CMake profiles using separate toolchain each, and switch between them when running or debugging your application
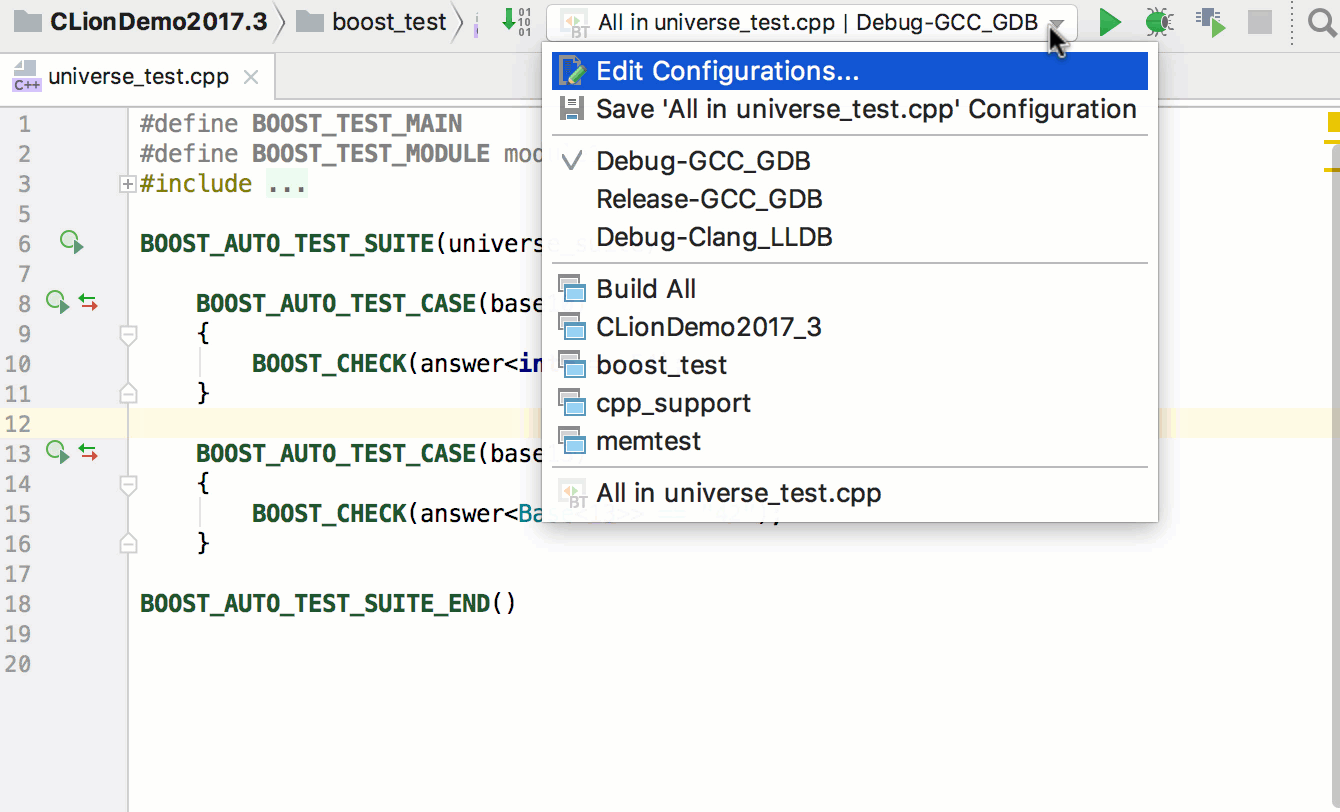
To switch between CMake profiles, select them in the run configuration switcher on the toolbar. Alternatively, you can select them in the Run/Debug configuration switcher popup, which is opened with Shift+Alt+F10 (Linux/Windows) / ^⌥R (macOS) for Run and with Shift+Alt+F9 (Linux/Windows) / ^⌥D (macOS) for Debug.
Additional notes on the CMake profiles/build type switcher can be found here.
Run icons for main functions and tests
The left gutter in the CLion editor can help navigate your code (for example, navigate to the base/derived class or to the declaration/definition) and show VCS status. Now it’s also helpful for the task of running/debugging your app.
For every main function in your code, as well as for every test (if case you use one of the officially supported frameworks like Google Test, Boost.Test or Catch), CLion shows a run icon in the left gutter. Click it to run, debug or run the corresponding main or test function with Valgrind Memcheck:
![]()
For unit tests, these icons also report the status of the tests: success or failure.
And even more!
Other important changes include:
- Separate settings for function calls and function declarations in Settings/Preferences | Editor | Color Scheme | C/C++
- Bundled CMake 3.9, GDB 8.0 with multiarch support, LLDB 5.0
- Various platform changes, including VCS support improvements
- Kotlin/Native, a brand new technology that compiles Kotlin directly to machine code, is now supported in CLion via plugins
Whew, that’s it! Explore all the new features in even more detail on our website. Start your 30-day free evaluation and try out all these new features and fixes (a demo project to play with).
Your CLion Team
JetBrains
The Drive to Develop
Subscribe to CLion Blog updates


