CLion 2021.2 EAP: Many Debugger Updates and Fixes for CMake Presets

The CLion 2021.2 Early Access Program was recently launched. Did you manage to try out the new Load CMake Presets feature? Or did you play with Cling, an interactive C++ interpreter now supported in CLion? We really hope you managed to catch a few dangling pointers or references with the help of recently introduced Lifetimes analysis.
Today we are happy to announce the second EAP build (212.3724.2), which is now available from our website, via the Toolbox App, or as a snap package (if you are using Ubuntu). Note that if you are on macOS, there is a separate build for Apple Silicon (M1 chip).
Please read on for more details about the changes, give them a try, and share your feedback with us!
Debugger
This EAP build brings a few notable enhancements in the Debugger.
- Relaxed breakpoints
- Run in external console on Windows
- Preview tab in Debugger
- Core Dump: Support debugging Windows minidumps
- Remote LLDB
- Breakpoints in disassembly view
In addition to this list, a few GDB-related issues were fixed: CPP-24874, CPP-24730.
Relaxed breakpoints
This change means CLion now uses the base name of the source file instead of its absolute path. This may be useful in cases where path mappings are too complex to fill them in in the debug configuration or when the -fdebug-prefix-map option is set in the debugger (CPP-15850).
To enable this, right-click the breakpoint and in the context menu select Use file name only to make this particular breakpoint relaxed:
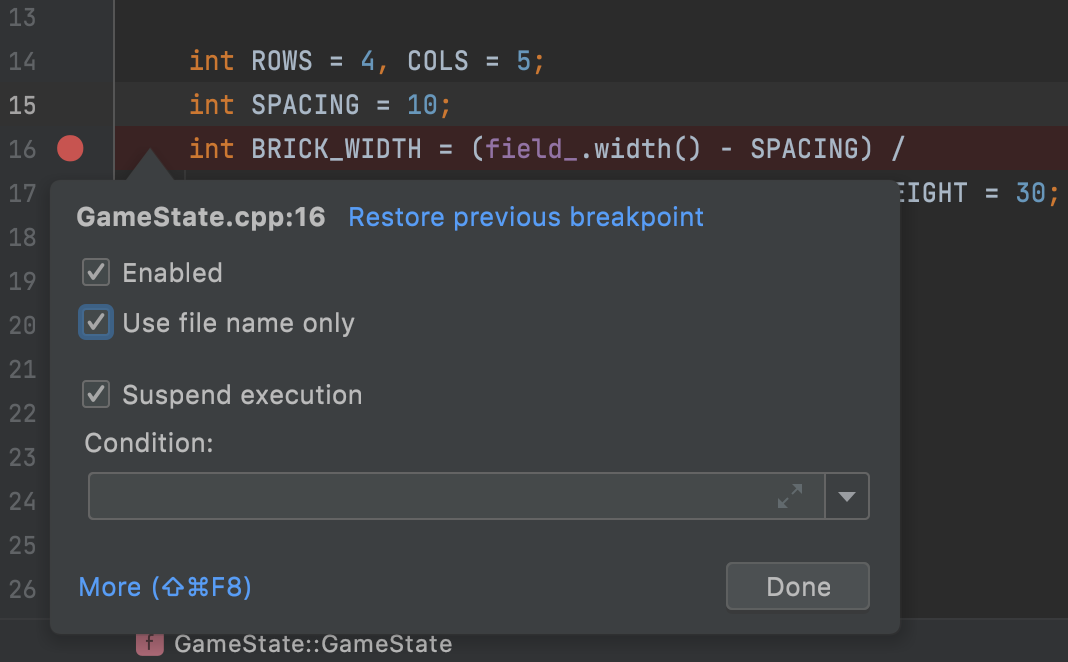
CLion will set it using just the file name in GDB or LLDB (depending on which backend you are using). In some projects that might lead to a situation where breakpoints match to several files with the same name, so the debugger will stop in all of these locations.
Run in external console on Windows
CLion uses an internal console to Run/Debug configurations, which caused a set of issues with flushing the output, as well as performance, on Windows. A new checkbox Run in external console is now available in Run/Debug configurations. When selected, CLion will use the cmd.exe console to run and debug applications.
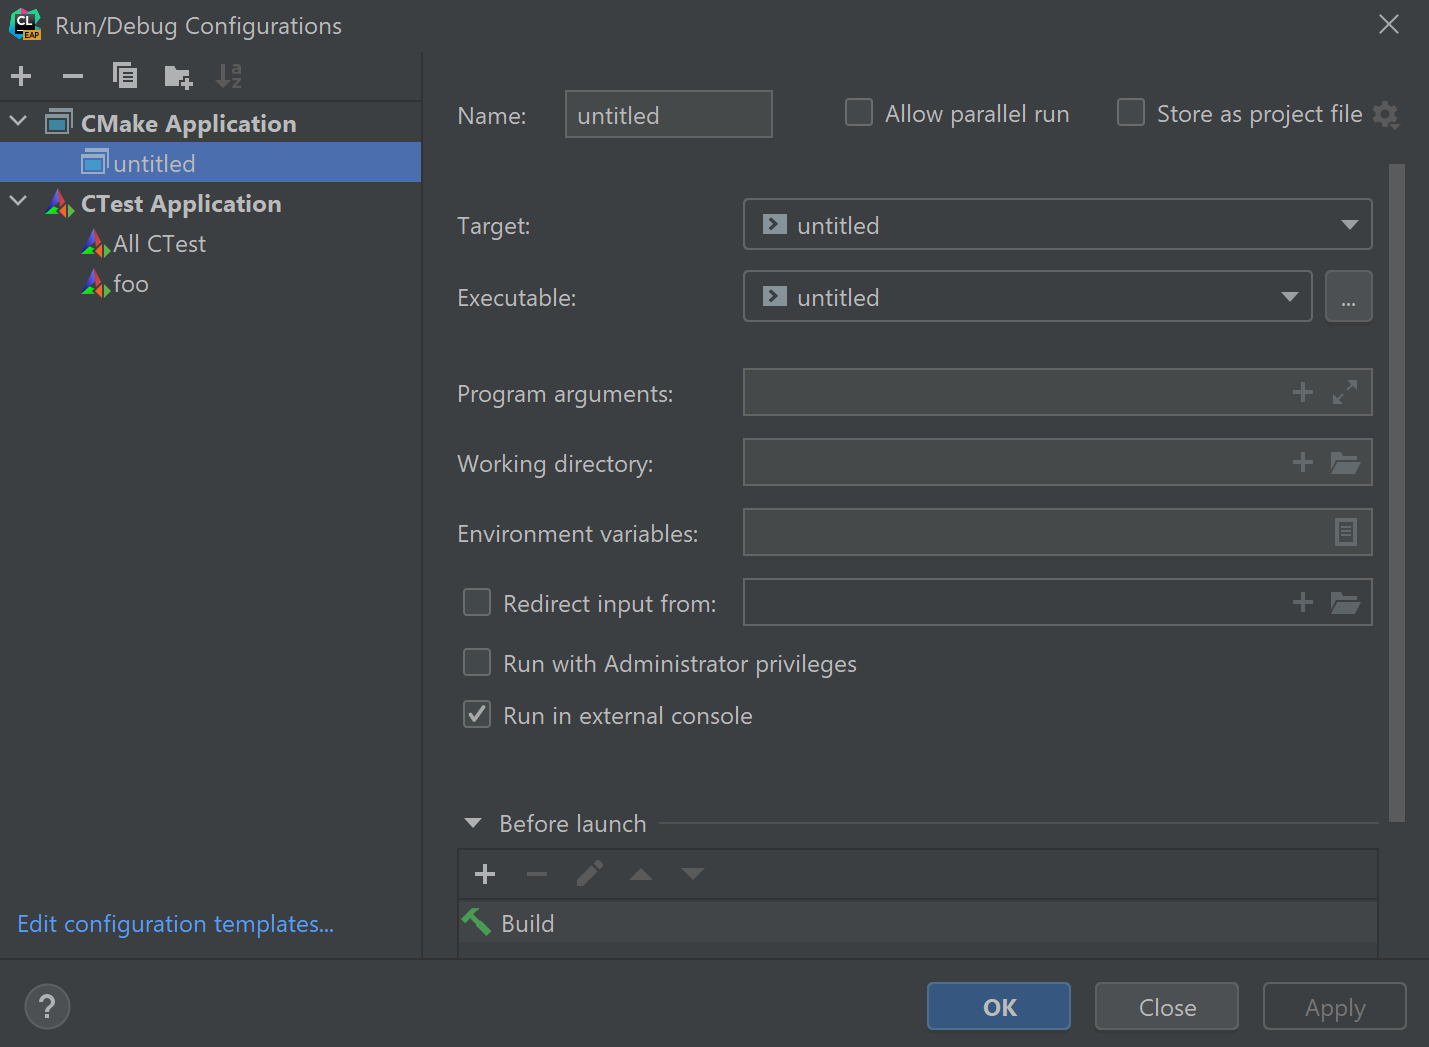
This works for MSVC+LLDB and MinGW+GDB.
Preview Tab now works in Debugger
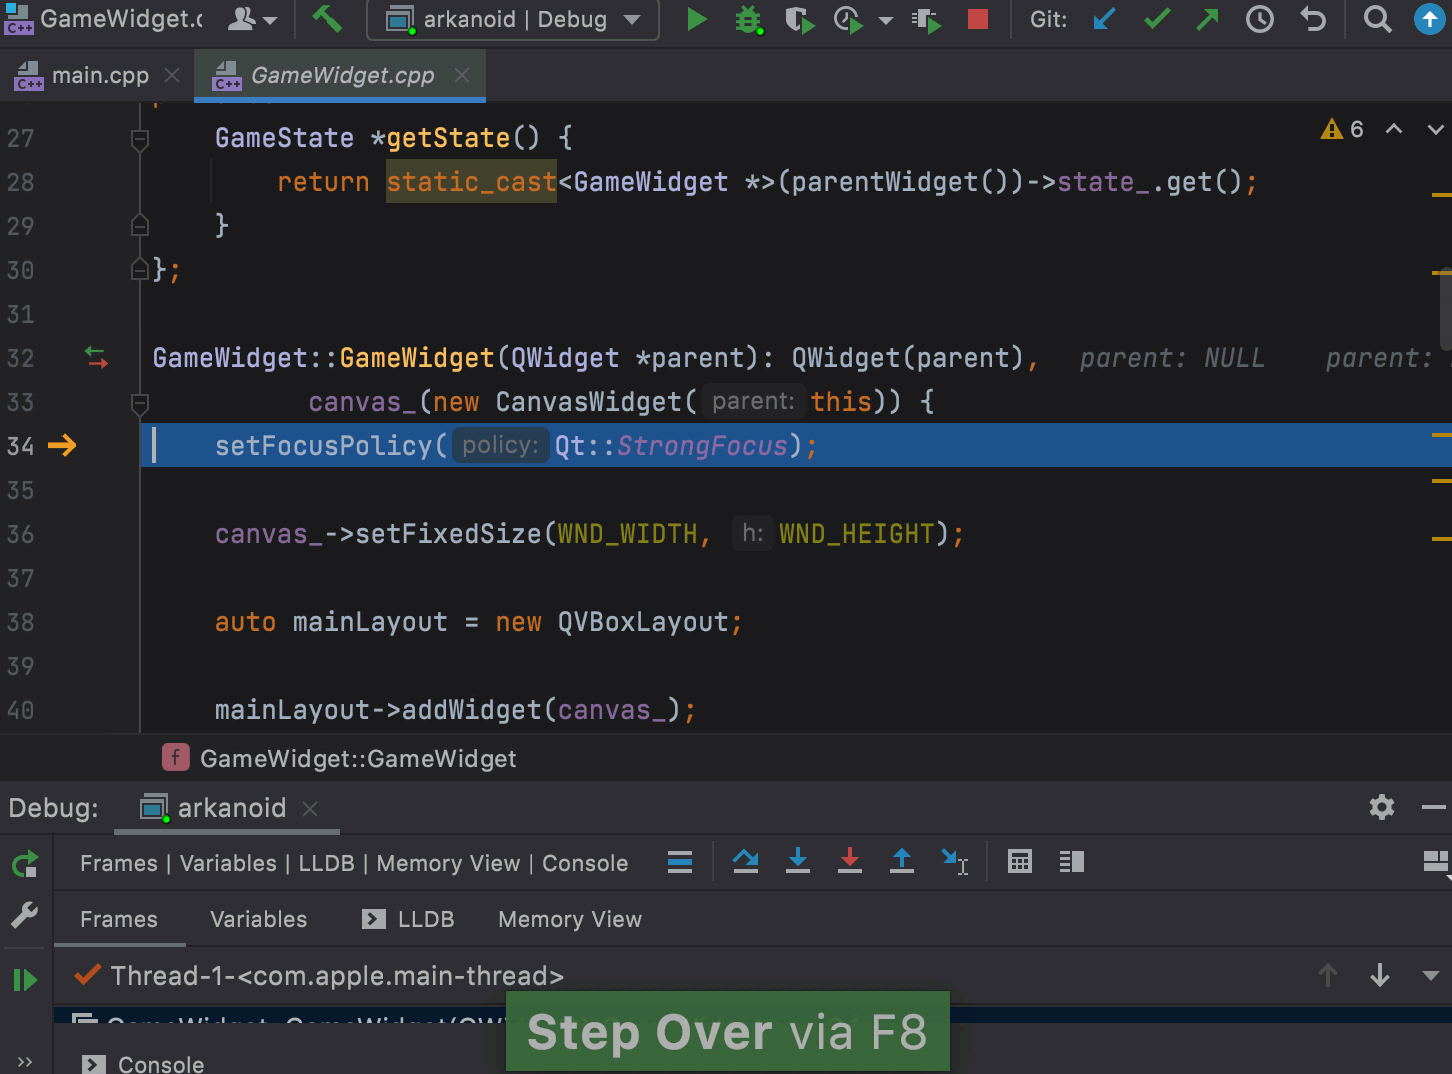
When the debugger steps through the codebase, new files are often opened in the editor. After a few stepping iterations your editor might be polluted with such files and the tab limit can be exceeded. The preview tab can help here!
The preview tab allows you to view files in a single tab one by one without opening each file in a new tab. You can enable it in Settings/Preferences | General | Editor Tabs | Opening Policy:
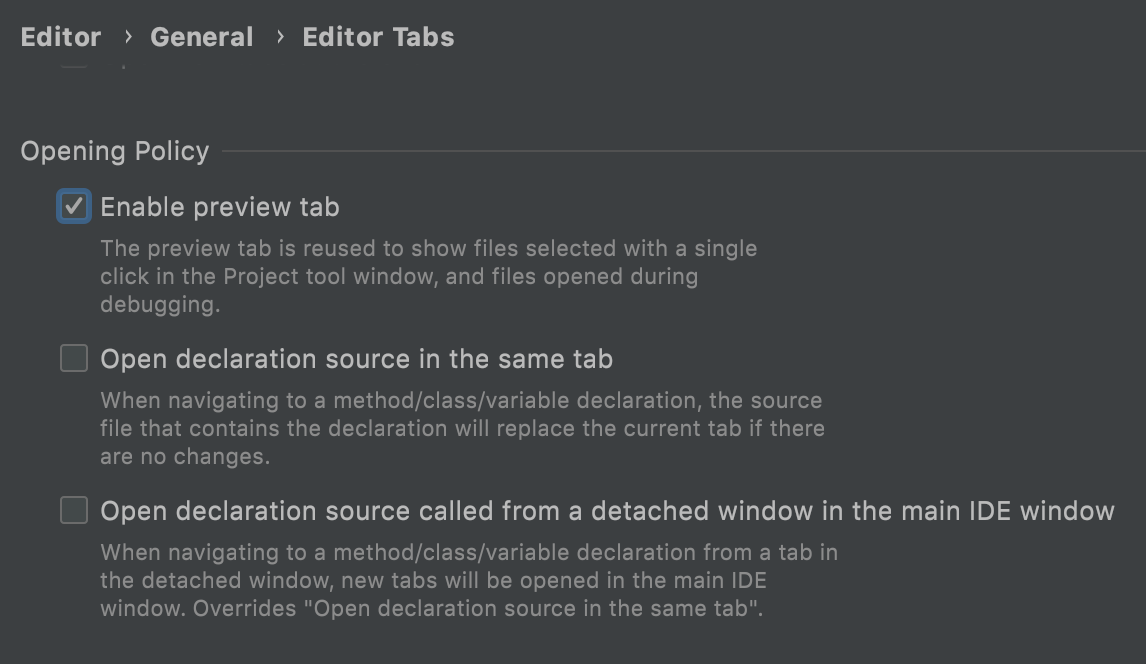
When enabled, it now also works during debugging, so the files you step through, or navigate to using single-click in the frames view or using “prev/next frame” actions, are always opened in a single tab (with its name in italic):
Core Dump: Support debugging Windows minidumps
CLion now supports postmortem debugging with core dumps on Windows, which are known as minidumps. A Windows minidump is a small file that is saved to the disk when the process crashes. This file is stored in the %LOCALAPPDATA%\CrashDumps, depending on your version of Windows. To debug it in CLion, use the Run | Open Core Dump action from the main menu.
When you start a core dump debug session, CLion opens the corresponding source code and the Debug tool window automatically. Similarly to a regular debug session, you can use the Frames tab and the Variables pane, as well as Memory and Disassembly view.
Remote LLDB
GDB Remote Debug is a great way to debug remotely any arbitrary executable with debug information in CLion. With this configuration, you can remotely debug applications that were built by any build system. The only requirement is for the debug symbols to be present on the local machine. This is now available for LLDB remote debug on macOS and Linux (remote debugging with LLDB is not supported on Windows currently).
GDB Remote Debug configuration was renamed to Remote Debug to serve both LLDB and GDB remote debug cases:
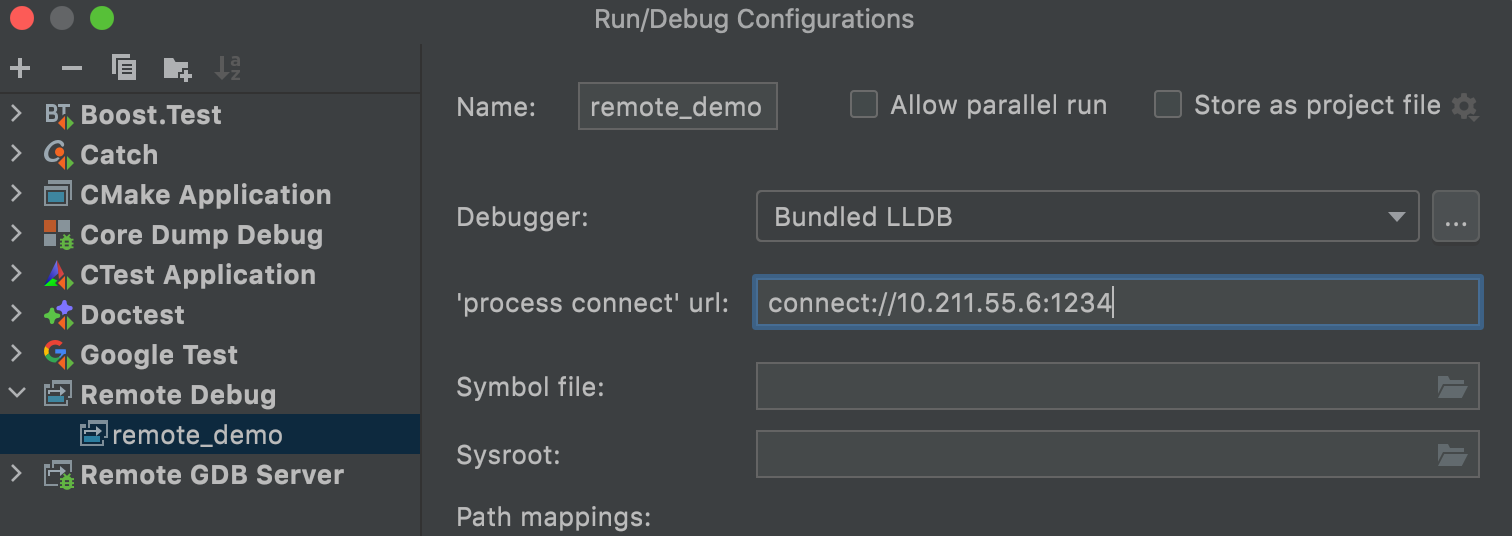
Select LLDB in this configuration and provide arguments to connect to the remote host.
On the remote host you need to start lldb-server, like
lldb-server g *:1234 ./binary
On macOS use debugserver as lldb-server:
debugserver 0.0.0.0:1234 ./binary
1234 is just a sample port we used here.
A few important notes:
- If you debug from macOS to Linux or from Linux to macOS with LLDB, cross-compilation is the easiest way to get everything working (for example, you can use musl). Otherwise, LLDB is unable to download system libraries automatically.
- Don’t forget to copy debug info along with binary to the local host to be able to debug correctly.
You can learn more about LLDB remote debugging here. We’ll update CLion’s online documentation soon to help you with the configuration process.
Breakpoints in disassembly view
Disassembly view in CLion was enhanced and now allows you to set breakpoints in it. Add/remove breakpoints on instruction lines the same way you do in the source code:
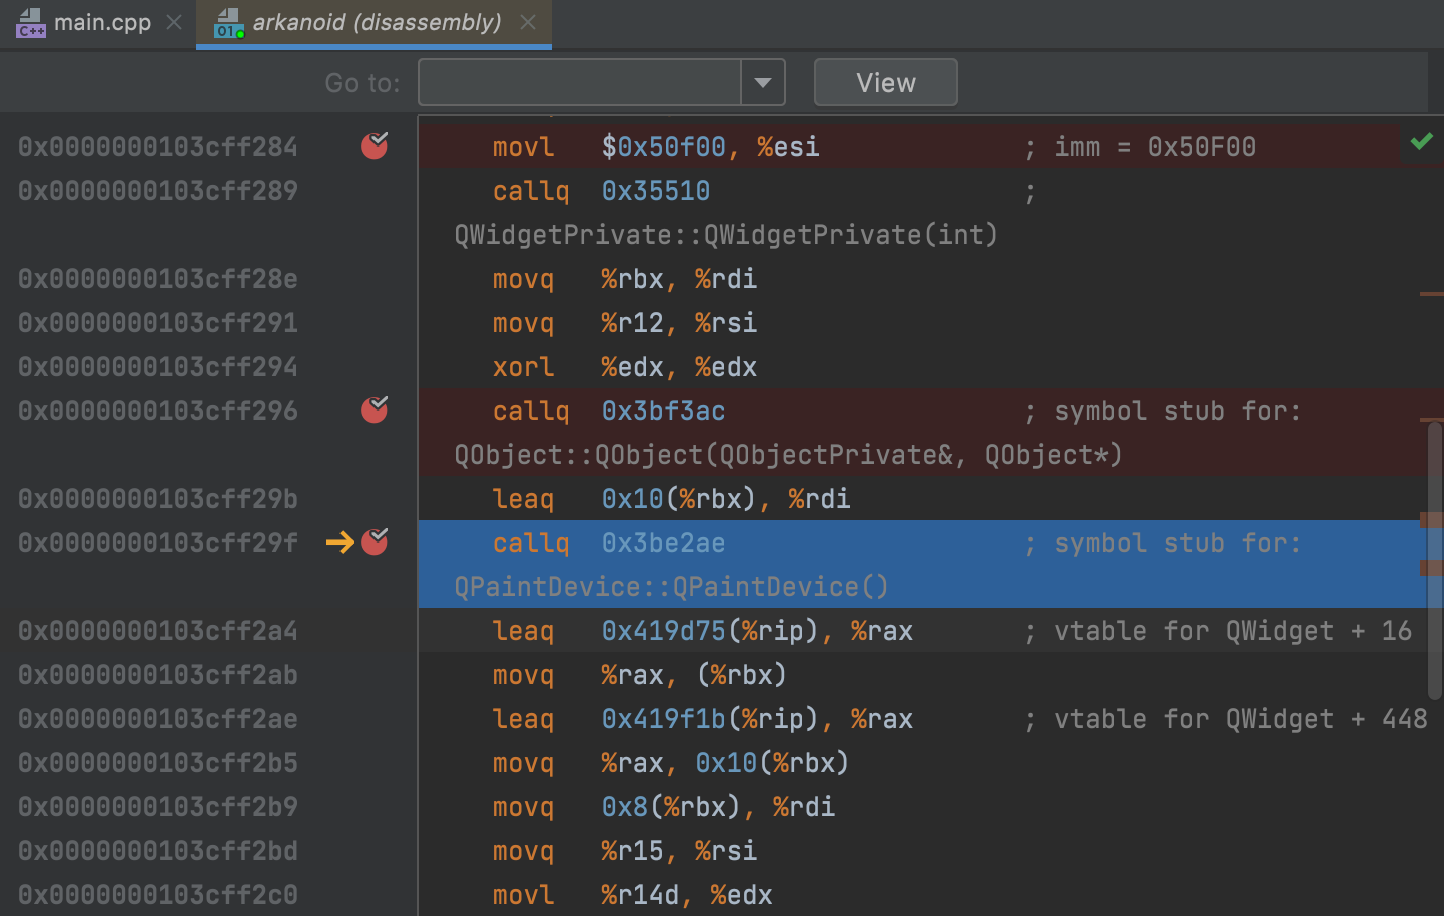
These are address breakpoints. The right-click context menu shows the settings available for them:
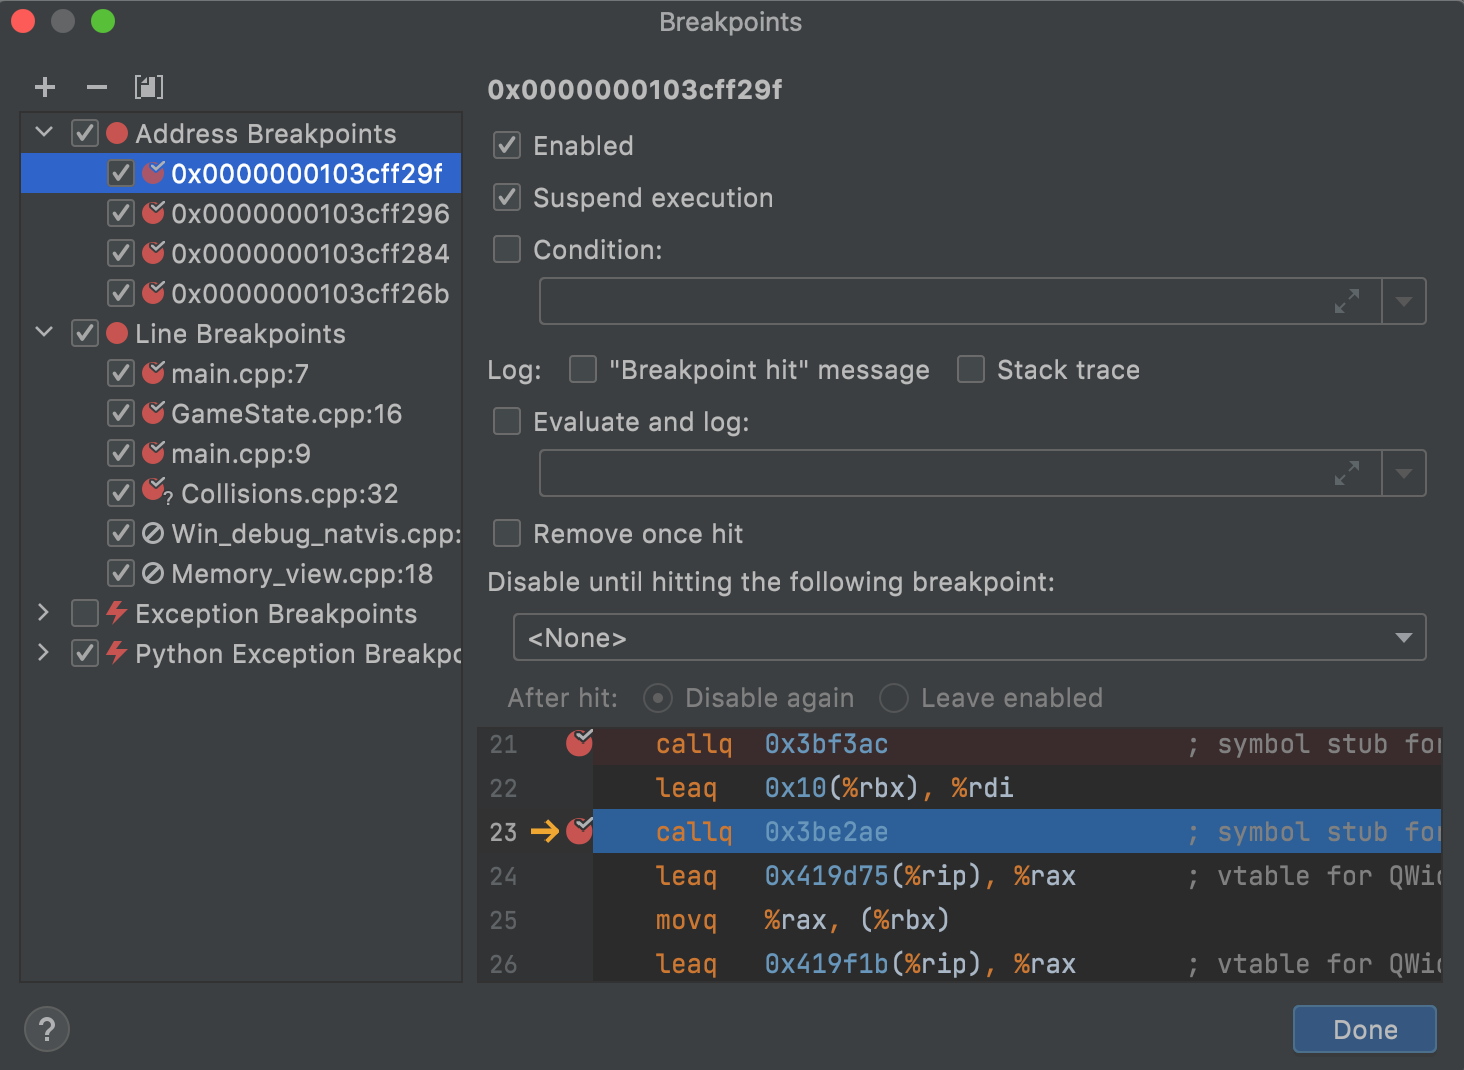
When the debugging session is stopped, these breakpoints are removed automatically, because most of the time the address layout changes on the next launch. This behaviour is similar to watchpoints.
CMake Presets enhancements
In the previous 2021.2 EAP build, we introduced initial support for CMake Presets. To briefly reiterate how it works, the Load CMake Presets action searches through the existing Build Presets, shows them to the user, and allows the user to import them into CLion CMake Profiles.
In this EAP, preset loading was simplified significantly.
-
All build presets found in the project are now loaded automatically on project opening in CLion. A few important things to note:
- All new presets loaded into CMake Profiles are disabled by default, unless you have already loaded and enabled them before (CLion matches them by name).
- All previously loaded presets are removed from CLion configuration if they are not present in the CMakePresets.json or CMakeUserPresets.json files.
- CLion loads all build presets it finds in the CMakePresets.json and CMakeUserPresets.json files in the project root.
- This only happens on project opening.
- Auto-save now works for preset JSON files, so you don’t need to worry about saving them manually before reloading the presets.
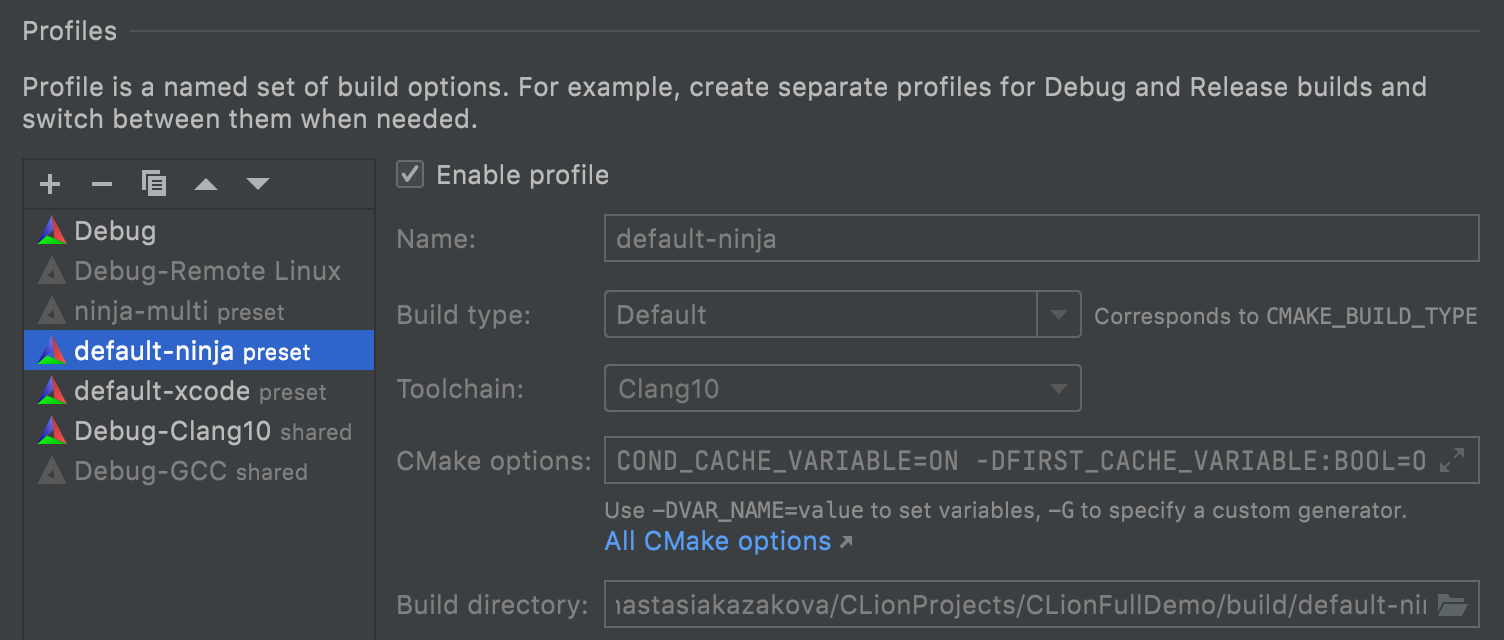
Previously, all loaded presets got a Default toolchain linked to the corresponding CMake Profiles. This might not be appropriate for most cases, so we added the ability to select a toolchain already configured in CLion for a preset. To configure it, use the vendor specific fields in configure preset:
"vendor": {
        "jetbrains.com/clion": {
          "toolchain": "Clang10"
        }
}
When this preset is loaded in CLion, it gets the proper toolchain assigned:
We also fixed some issues for preset arguments containing spaces (CPP-25203).
We hope that this makes your experience with CMake Presets in CLion much smoother, and we’ll keep polishing the support further! Let us know if you are using CMake Presets already and how useful is the CLion support for you.
The full release notes are available here.
Your CLion team
JetBrains
The Drive to Develop