CLion 2022.3 EAP: CMake Debugger

A new CLion 2022.3 EAP build is available!
Download build 223.7255.15 from our website, via the Toolbox App, or as a snap package (if you are using Ubuntu). Update via patch if you are using the previous EAP build.
CMake Debugger
CMake is a tricky scripting language that is sometimes hard to work with. Just watch this fantastic talk by Mateusz Pusz from CppNow 2021 and take the CMake quiz in the beginning of the presentation to test your CMake knowledge!
Since CMake is a language of a build system, identifying the best way to debug an error or a suspicious behavior in a CMake script is not always easy. That’s why we were really impressed by the idea for a CMake debugger from Sysprogs and their corresponding CMake fork that appeared some time ago in the community. We decided to proceed with it and develop it into an integrated debugger you can use in CLion. In CLion 2022.3 EAP5, you can finally give it a try.
How to start debugging CMake scripts
You can start the debugging session via the gutter icon. This icon appears in the top level CMake script of your project near the first command in the CMake file after the project has been reloaded and indexing has finished:
![]()
If CMake generation in CLion fails, you can also start CMake debug sessions from the CMake tool window, where the debug hint also appears:
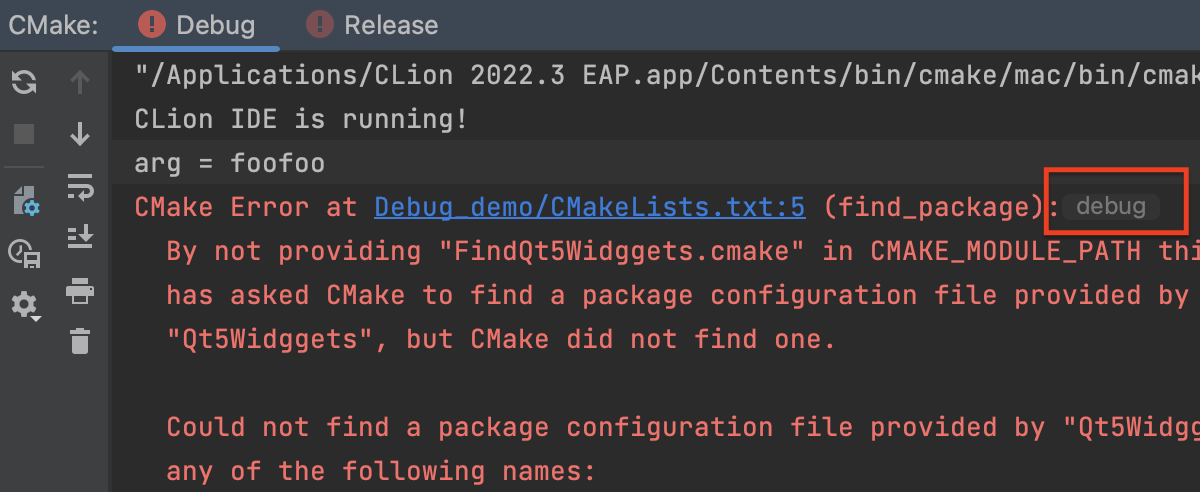
Click it to launch the debugging session.
Debugging experience
If you have ever debugged your code in CLion, you will find that many features you are already used to are in the CMake debugger as well, including the ability to set breakpoints, step through the code, and watch CMake variables, targets, and environment variables in the debugger tool window:
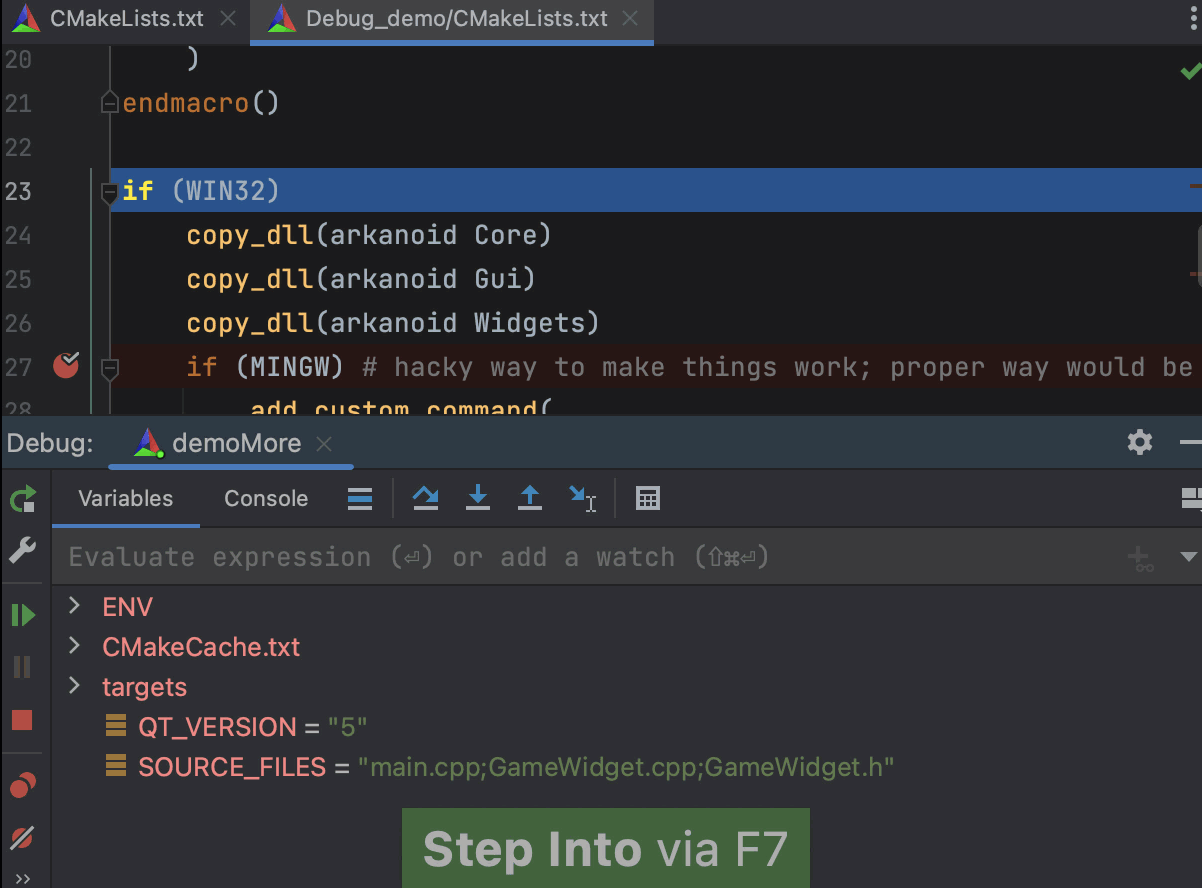
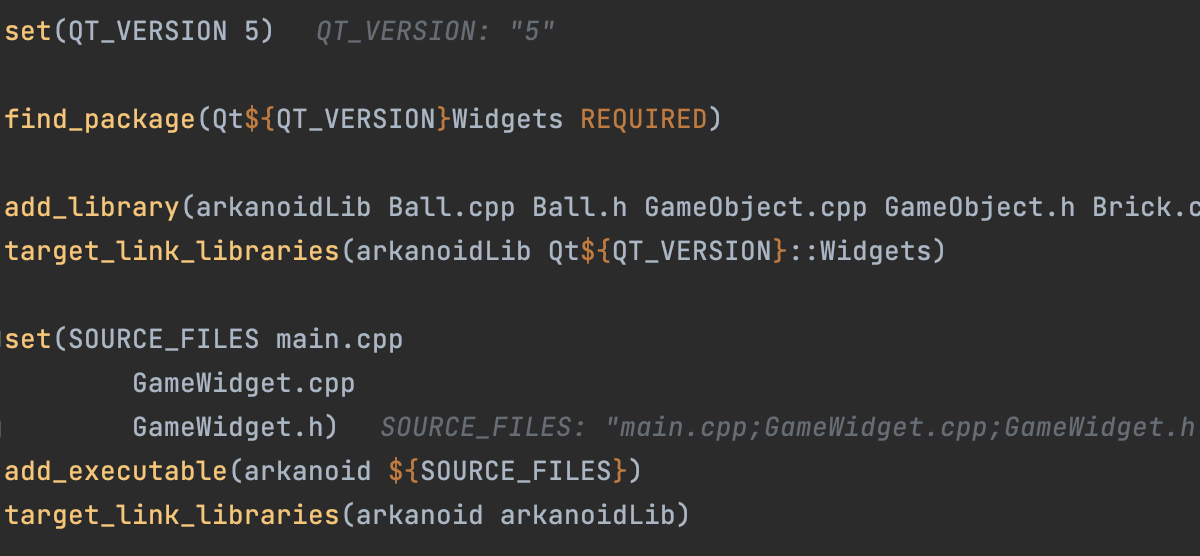
You can examine the values of variables right in the editor, next to their usages:
The environment is loaded for debug sessions just like it is in the real CMake launch, and the CMake debugger stops on CMake errors.
Known limitations
The CMake debugger only works with the CMake executable bundled into the CLion 2022.3 EAP builds – 3.24.2-dbg. It’s a custom CMake binary built from v3.24.2.
The CMake debugger works on all three major platforms and only for local toolchains. WSL, Remote, and Docker are not supported.
Additionally, the debugger only works for the CMake configuration step, so it does not debug your actual project build, and the project model is not reloaded after CMake execution under debug.
Debug configurations
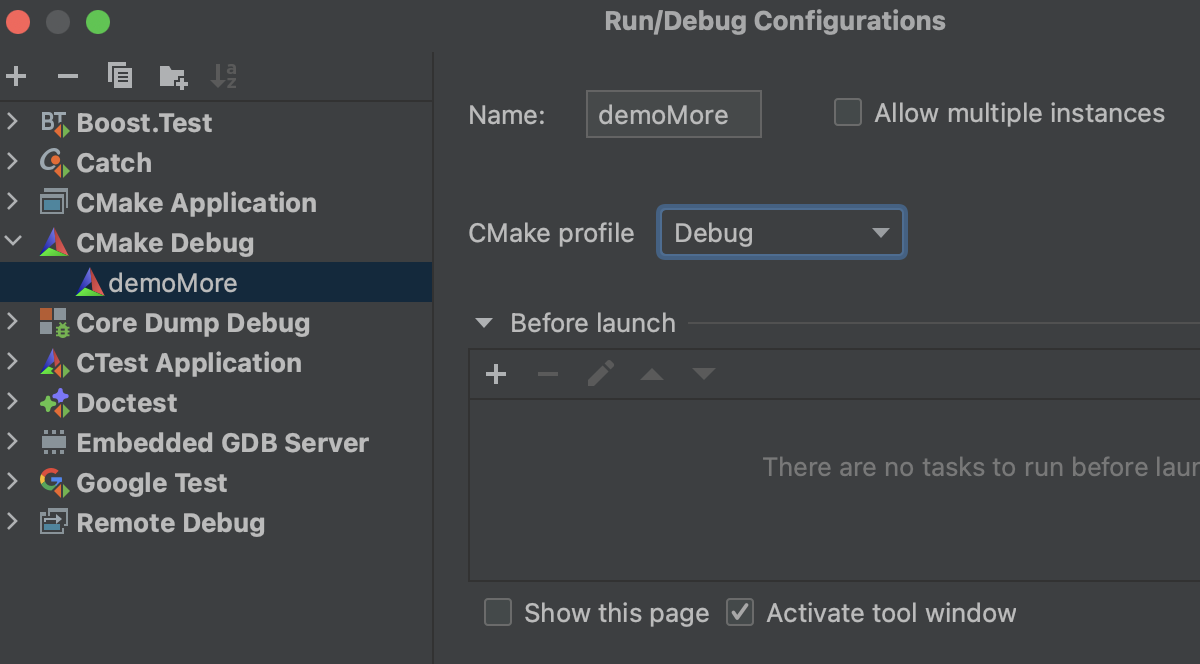
The CMake debugger is launched via the corresponding CMake Debug run/debug configuration. It’s created automatically from the run/debug configuration selected in the editor, or you can configure it manually via Run | Edit Configurations… There you can select CMake Profile and configure the Before launch steps:
Installers for Windows ARM64
We’re working to add support for Windows ARM64. JetBrains Runtime already has it, and we’re now porting native tools used by CLion like Clangd and others to Windows machines with ARM64 processors. Meanwhile, with CLion 2022.3 EAP5, we have started distributing installers for Windows ARM64 that you can download from our website or from the Toolbox App. Since the native tools have not yet been ported, these installers will only work for Windows 11, which is able to run both x64 and x86 binaries.
The full release notes are available here.
Here is a reminder about what has already been delivered in the CLion 2022.3 EAP:
- Enhanced CMake integration
- Built-in documentation for Clang-Tidy checks
- Ability to open documentation at cppreference.com
- Function return values in the debugger
- Azure RTOS thread view
- Syntax support for linker scripts
- New solution for settings synchronization
- Support for C++20 Modules
Download the latest EAP build to give the new features and enhancements a try, and be sure to share your feedback with us! EAP builds are free to use.
Your CLion team
JetBrains
The Drive to Develop