Datalore
Collaborative data science platform for teams
New in Datalore: Automatic plots, Terminal, Pip package manager, and Community plan changes
Last month we introduced a bunch of major changes to Datalore. Read this blog post to learn about how we improved the plotting workflow, integrated Terminal and Pip package manager, and adjusted the features on the Community plan👇🏻
Automatic plot generation
When you start analyzing data, you try to understand general trends and find relationships between variables. So you need to create plots, often multiple plots, which means writing a lot of boilerplate code. At the Datalore team, we wanted to simplify this common workflow and have introduced automatic plot generation for pandas DataFrames 🚀
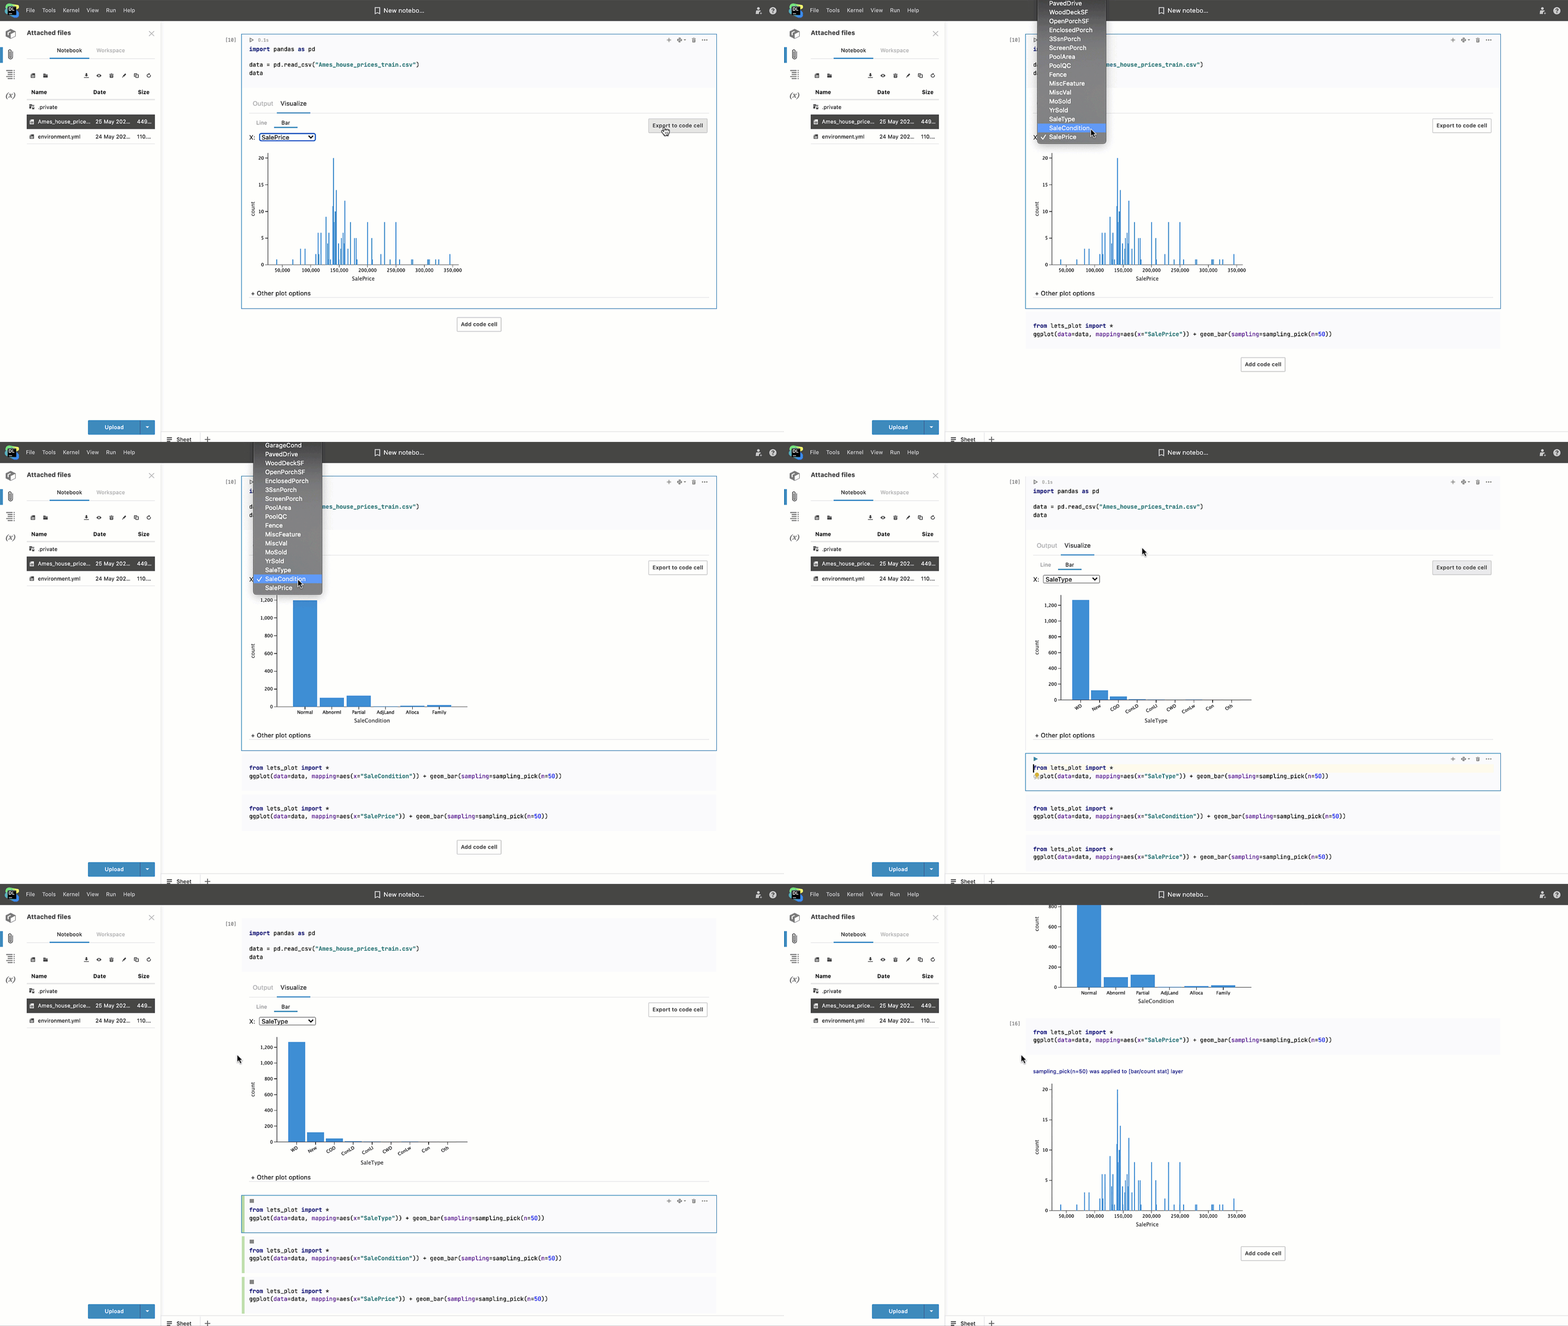
Now you can get interactive line plots and histograms of any DataFrame in just a few clicks, with the Lets-Plot library responsible for all the magic behind the scenes!
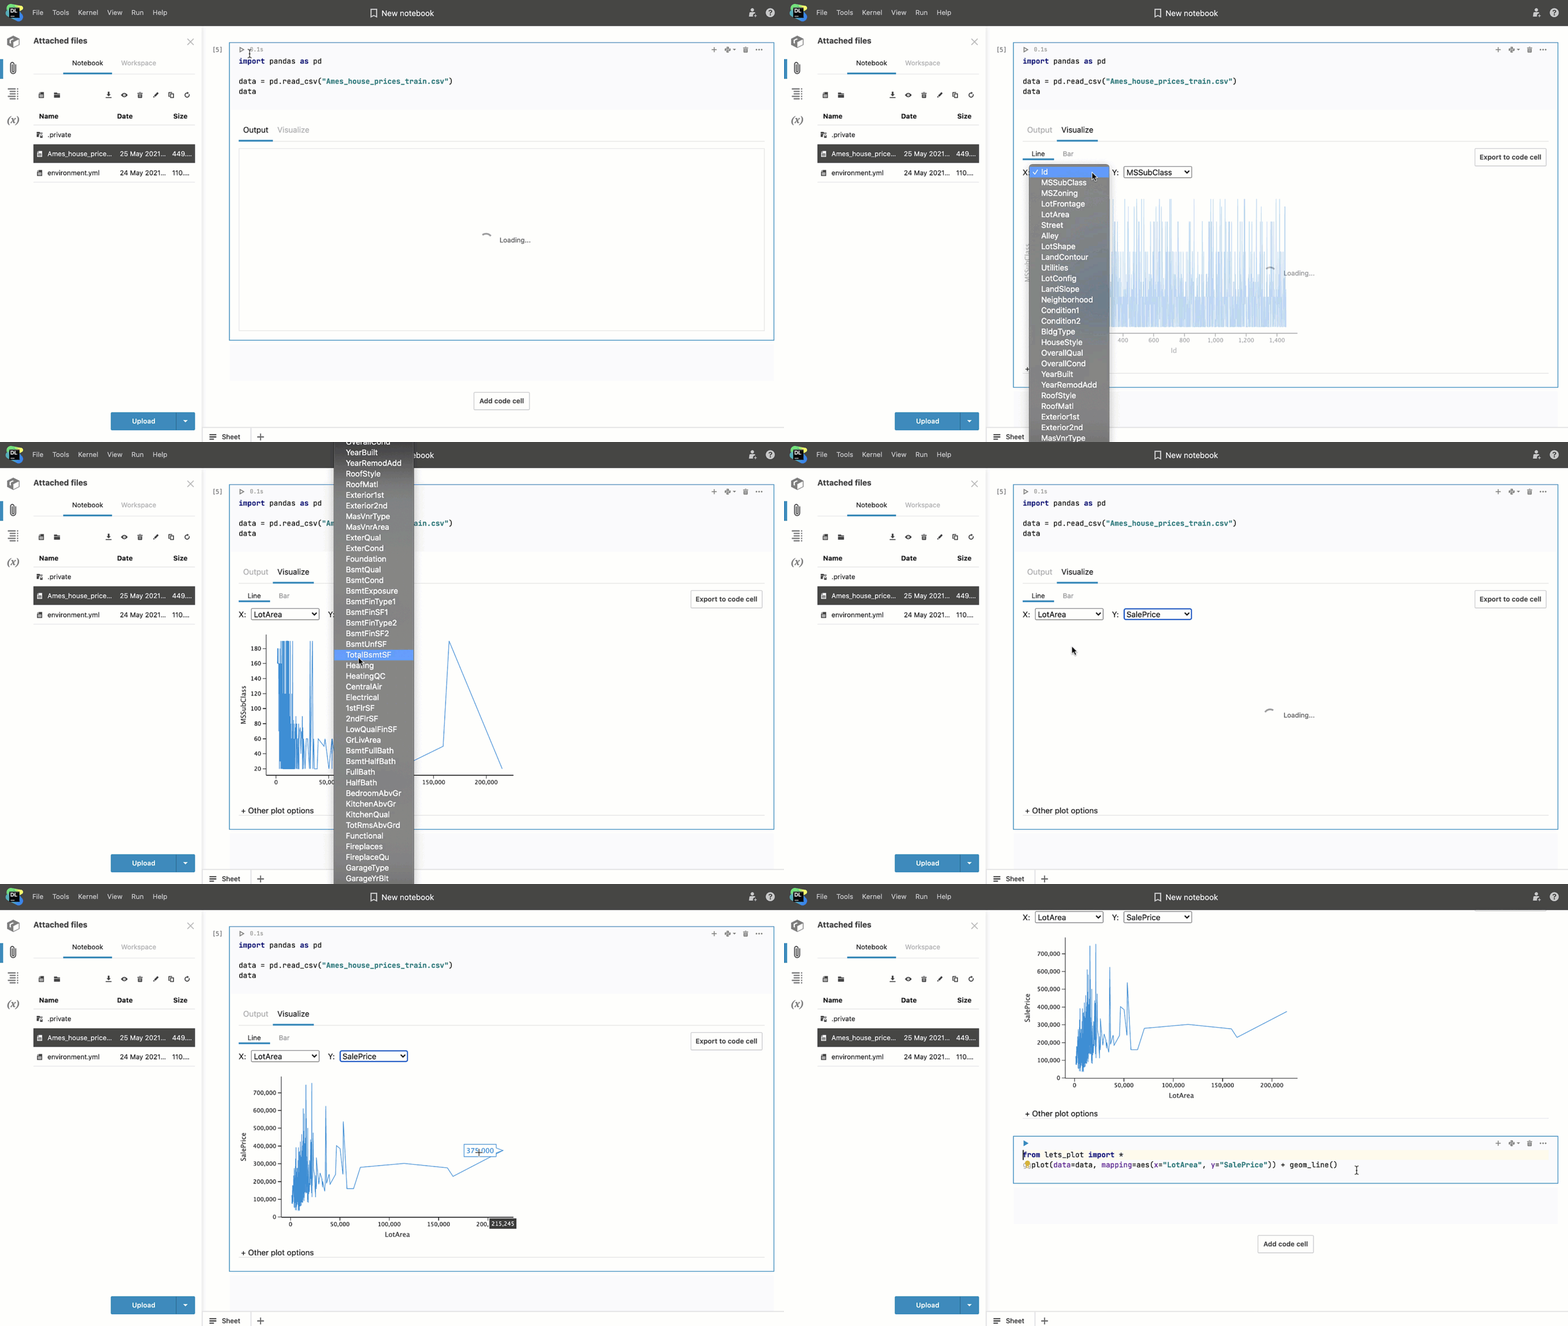
Inside the Visualize tab of DataFrame outputs you can adjust the plot title, axes labels, and the number of bins for histograms, and then export the code to the notebook to customize it even more.
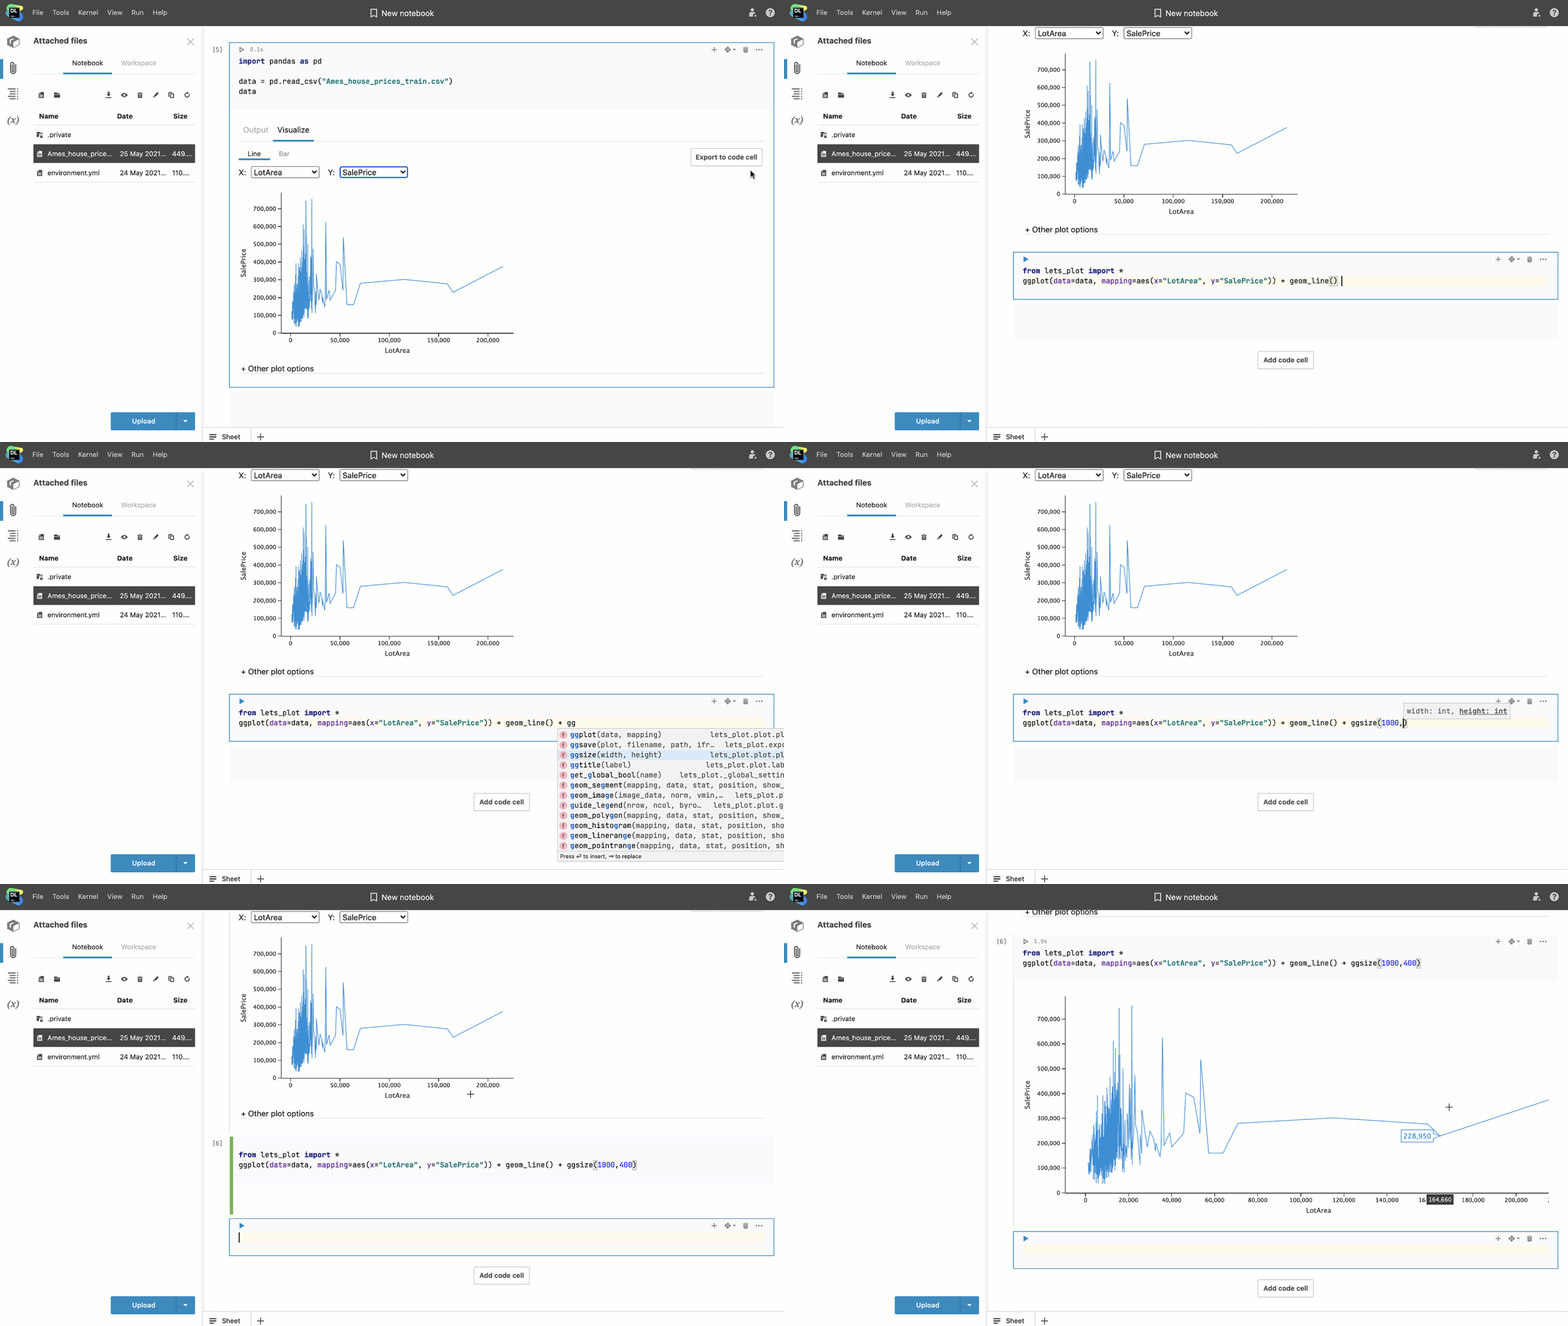
Note that the Visualize tab won’t be visible in published notebooks, so you need to export the generated code to the notebook.
Pip package manager
Last month we implemented the pip package manager and made it the default one. Now you can choose between Conda and pip package managers in the Environment tab when creating a notebook or in the Library manager sidebar tab inside the editor.
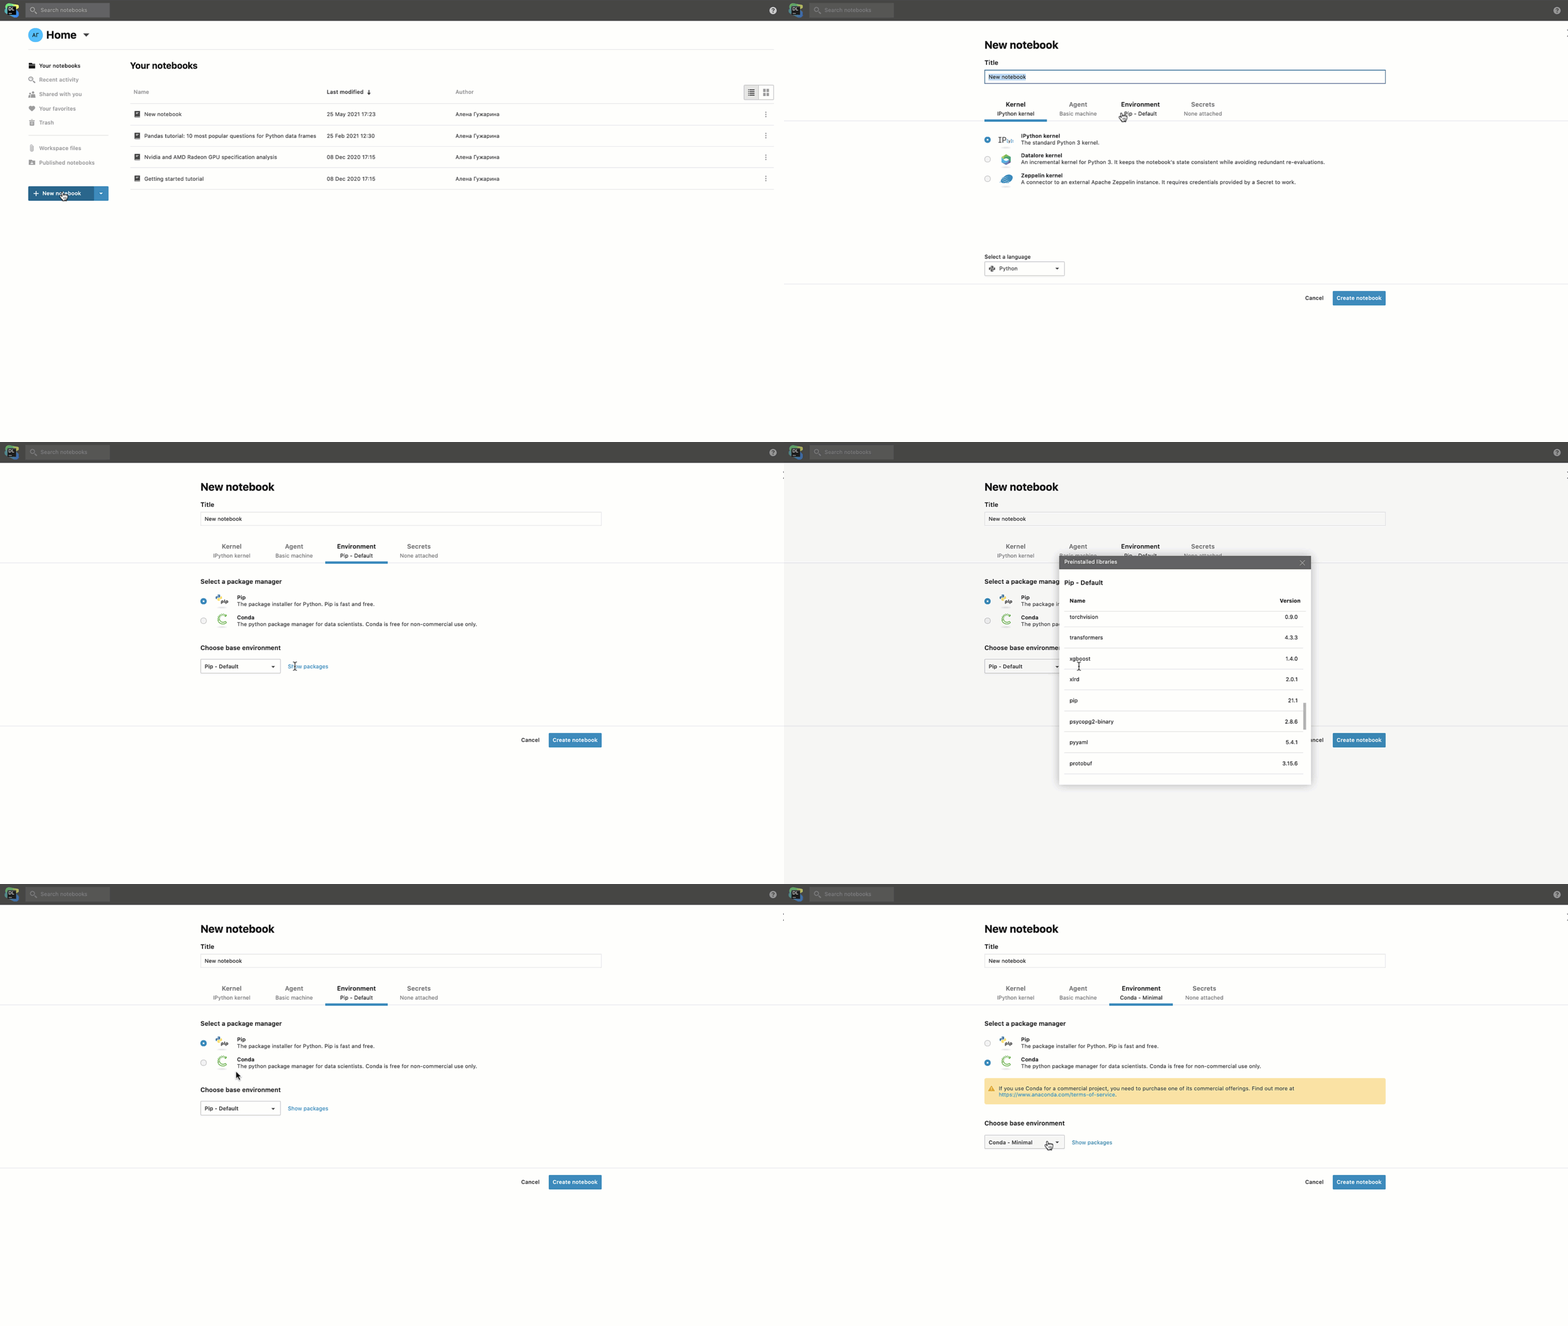
We also added support for two types of environments: Default and Minimal. We set the default environment to Pip-Default which is similar to the one in Datalore before. It has the top Python and data science libraries already pre-installed so that you can import the packages you need and start coding right away.
If you need a clean setup for your project, choose the Pip-Minimal environment that has only the most essential libraries pre-installed.
❗️ If you want to use the Conda package manager for commercial projects, make sure to comply with the Anaconda terms of service.
Terminal support
Recently we’ve added Terminal support to Datalore, so now you can:
- Execute .py scripts inside Datalore
- Install packages and clone Git repos that also require interactive inputs
- Access the agent, environment, and file system using common bash commands
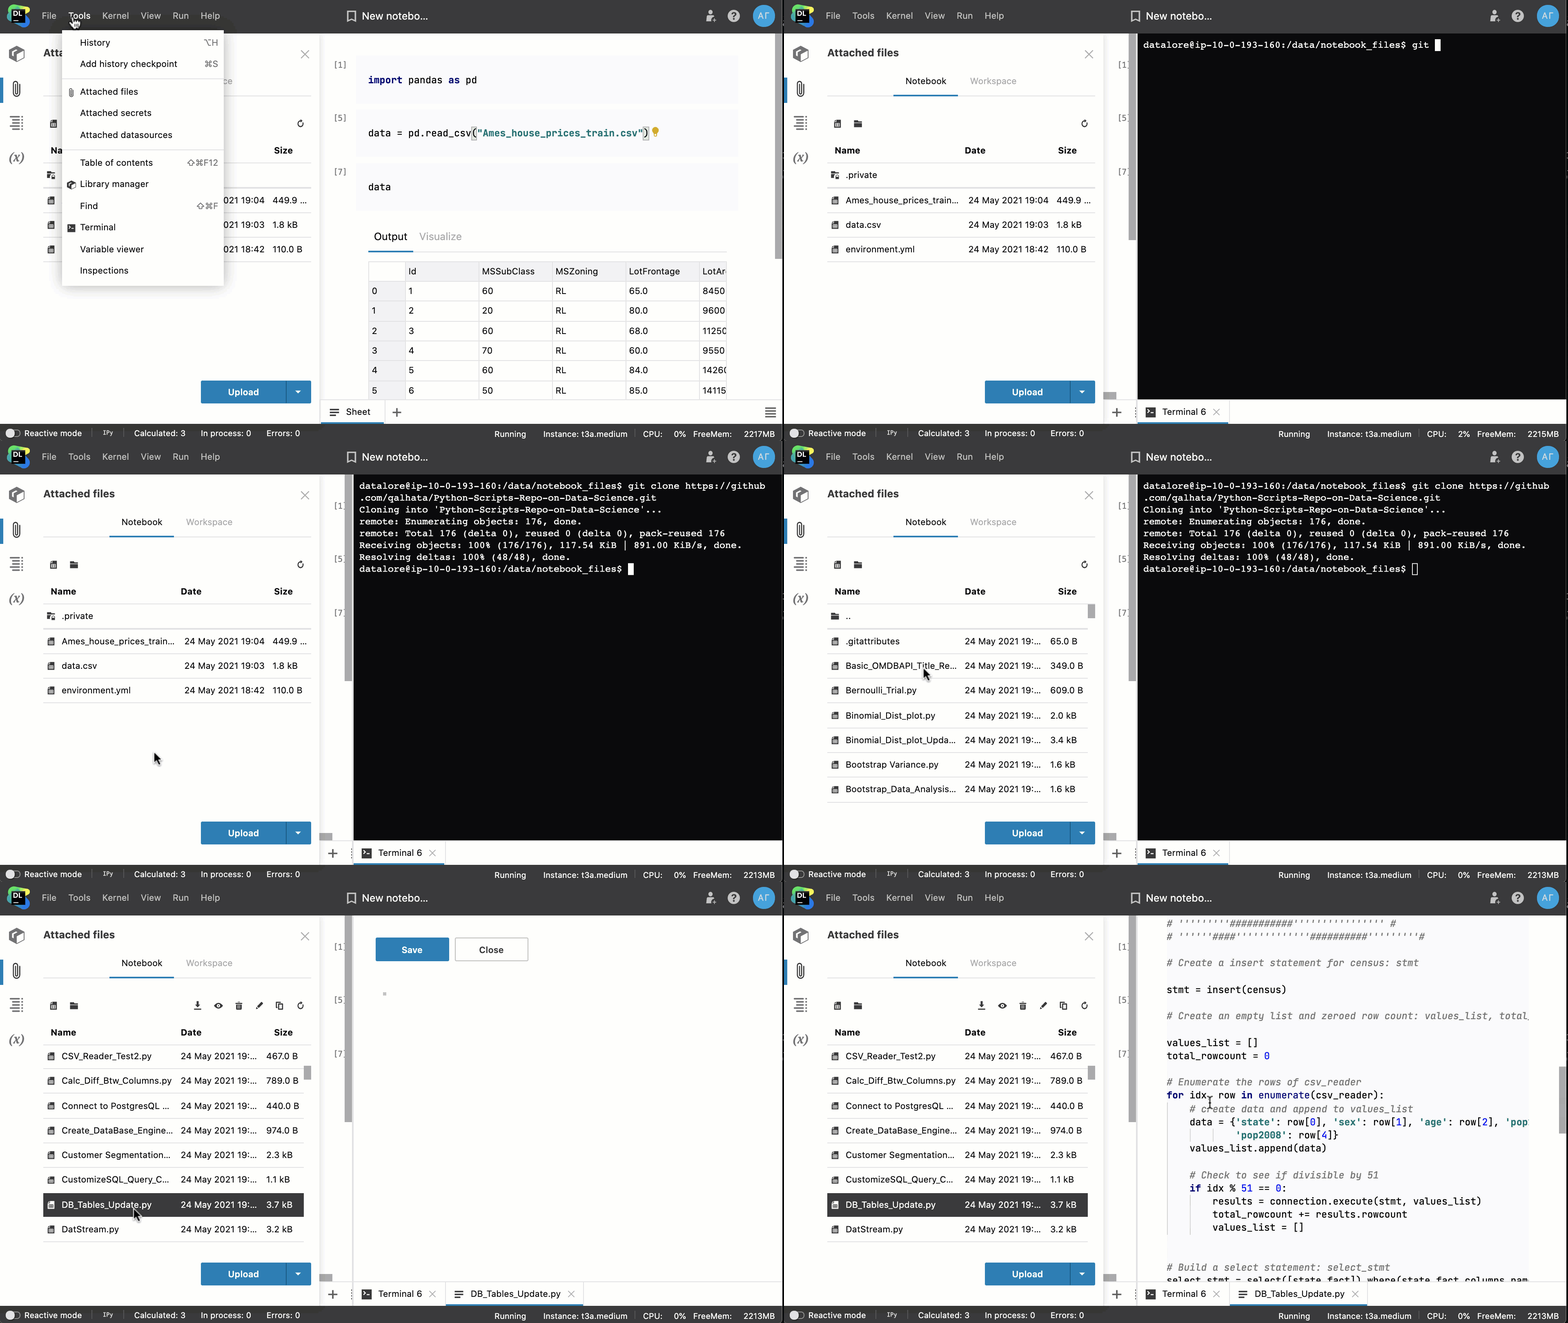
Try it out and let us know what you think on the feedback form (“?” button near your account logo).
Community plan changes
This month we’ve introduced some important changes to our Community plan. You should’ve already received an email, but let’s summarize what changed:
- You will be able to invite up to 3 editors and unlimited viewers to your notebooks from your home workspace.
- You will be able to create 1 shared workspace and invite up to 3 editors and unlimited viewers to it.
- The Long computation time will be limited to 6 hours per session.
- You will be able to run up to 2 notebooks in parallel.
The amount of available computation time and storage will remain the same, and all the features not mentioned above will still be available to you.
Here is the discount code TRYDATALOREPRO to get the first month of Datalore Professional free. It is valid until June 30, 2021. Please apply it upon checkout in JetBrains Store when you upgrade your plan.
The changes will apply starting 27.05.2021.
If you currently have more than 3 editors in some of your notebooks or more than 1 shared workspace, we won’t restrict the usage for them, but you won’t be able to create additional shared workspaces or invite more editors to these notebooks.
Other updates
Improved documentation pop-ups
Before, we used only static analysis to retrieve documentation popups, but some libraries provided their documentation in an unconventional way. Last month we managed to tackle this problem and now we retrieve documentation from runtime and fall back to static analysis in case it doesn’t work out. To get the docs for any function/method/class, use Cmd/Ctrl + hover or enable the documentation on hover in the View menu tab.
Changelog inside Datalore
Go to the “?” button near your account logo and open the Changelog notebook. We briefly summarize all the recent updates there. 🚀
Adjusted json output
Now printing JSON files will return the same output as it would in classical Jupyter notebooks.
That’s all for now! Follow our Twitter @JBDatalore to keep up with Datalore updates!
Happy data science,
The Datalore team
Subscribe to Datalore News and Updates


