

Datalore
Collaborative data science platform for teams
New in Datalore: R and Scala Notebooks, Google Cloud Bucket Mounting and More
Greetings from the Datalore team!
Exciting news for those of you who love more than just Python: Datalore now also supports R and Scala notebooks! Read on to learn more about the updates.
R and Scala support
Although Python is the most popular language in data science, R and Scala also do a great job for data science tasks and have a rich user community. That’s why we added support for Scala and R kernels in Datalore, so now you can:
- Create R 0.4.11 and Scala 2.12 notebooks
- Get smart code completion for R and Scala code
- Invite your team members to collaborate on code in real-time
- Publish static copies of notebooks and share them via link
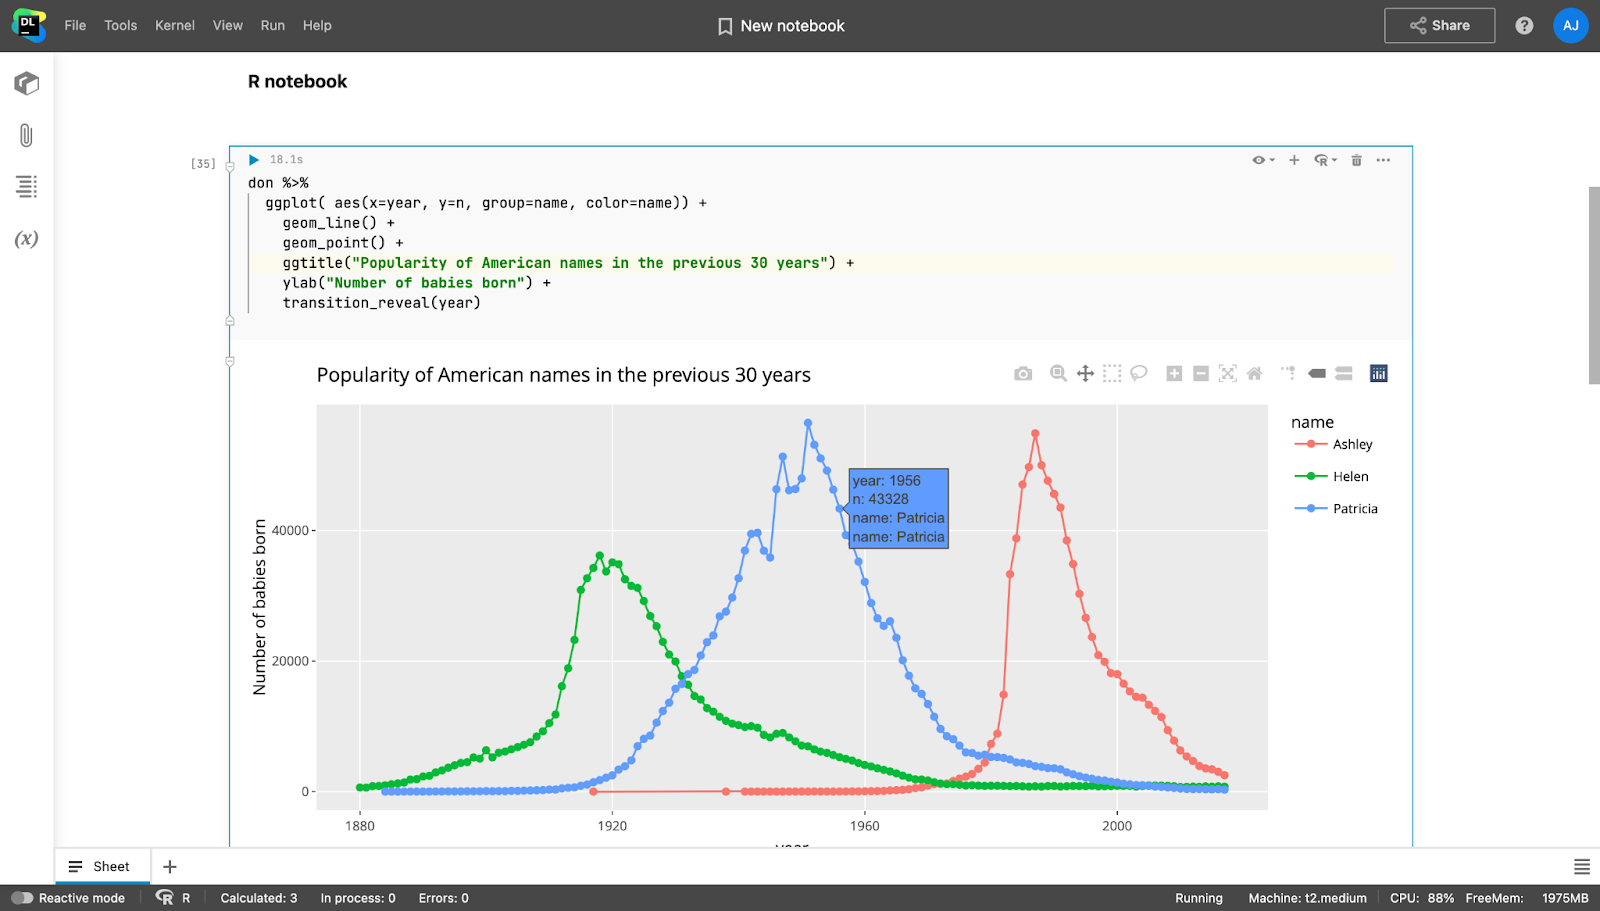
The R language comes with several packages pre-installed, and you can always install additional ones using the Environment manager or install.packages("package name") code. If you work with the same set of packages, you can install them automatically using the initialisation script. Learn more about init.sh in this blogpost.
Please try out R and Scala notebooks and let us know what can be improved on our public forum.
GCS bucket mounting
Now you can connect Google Cloud Storage buckets and mount them as folders to your Datalore notebooks. This allows you to extend your cloud storage capacity and avoid moving your data to the Datalore file system.
To connect a bucket, go to Tools -> Attached datasources and choose GCS bucket option.
Sharing notebooks from workspaces
When sharing your work from a non-home workspace, you need to invite your team members to join the workspace. Last month we made this part of the workflow more user-friendly and added an option to invite workspace members from the notebook editor interface.
Now you can invite team members to your workspace via email by clicking Share -> Manage workspace members. Collaborators can then join via email invitation, or you can share the notebook link.
New tutorial on data scraping and geodata visualization
Take a look at this notebook that visualizes information about cities and points of interest for each country in the world. The information is taken from wikivoyage.org.
We use the urllib3 library and Beautiful Soup for scraping. Geodata visualization is done with Lets plot.
That’s all for now. Follow us on Twitter @JBDatalore to stay up to date!
Happy data-science-ing!
The Datalore team


