Datalore
Collaborative data science platform for teams
Introducing Datalore Enterprise 2021.3: Database Connections, SQL Cells, Interactive Reports, and More
Greetings from the Datalore team!
Datalore Enterprise is a data science notebook platform for teams that can be hosted privately on-premises or in the cloud.
The focus of this Datalore Enterprise 2021.3 release was to make it easy for data scientists to share their work with stakeholders and to facilitate fetching data from databases with SQL. We also integrated support for R and Scala notebooks, reimplemented Reactive mode, and added out-of-the-box visualisation options and a bunch of other features.
Read on for the highlights of this release!
Connect notebooks to databases and query data with SQL cells
Database connections from the UI
The new version of Datalore Enterprise allows you to connect your notebooks to databases right from the editor with a few clicks. It also lets you query your data with native SQL cells without passing your credentials to the environment.
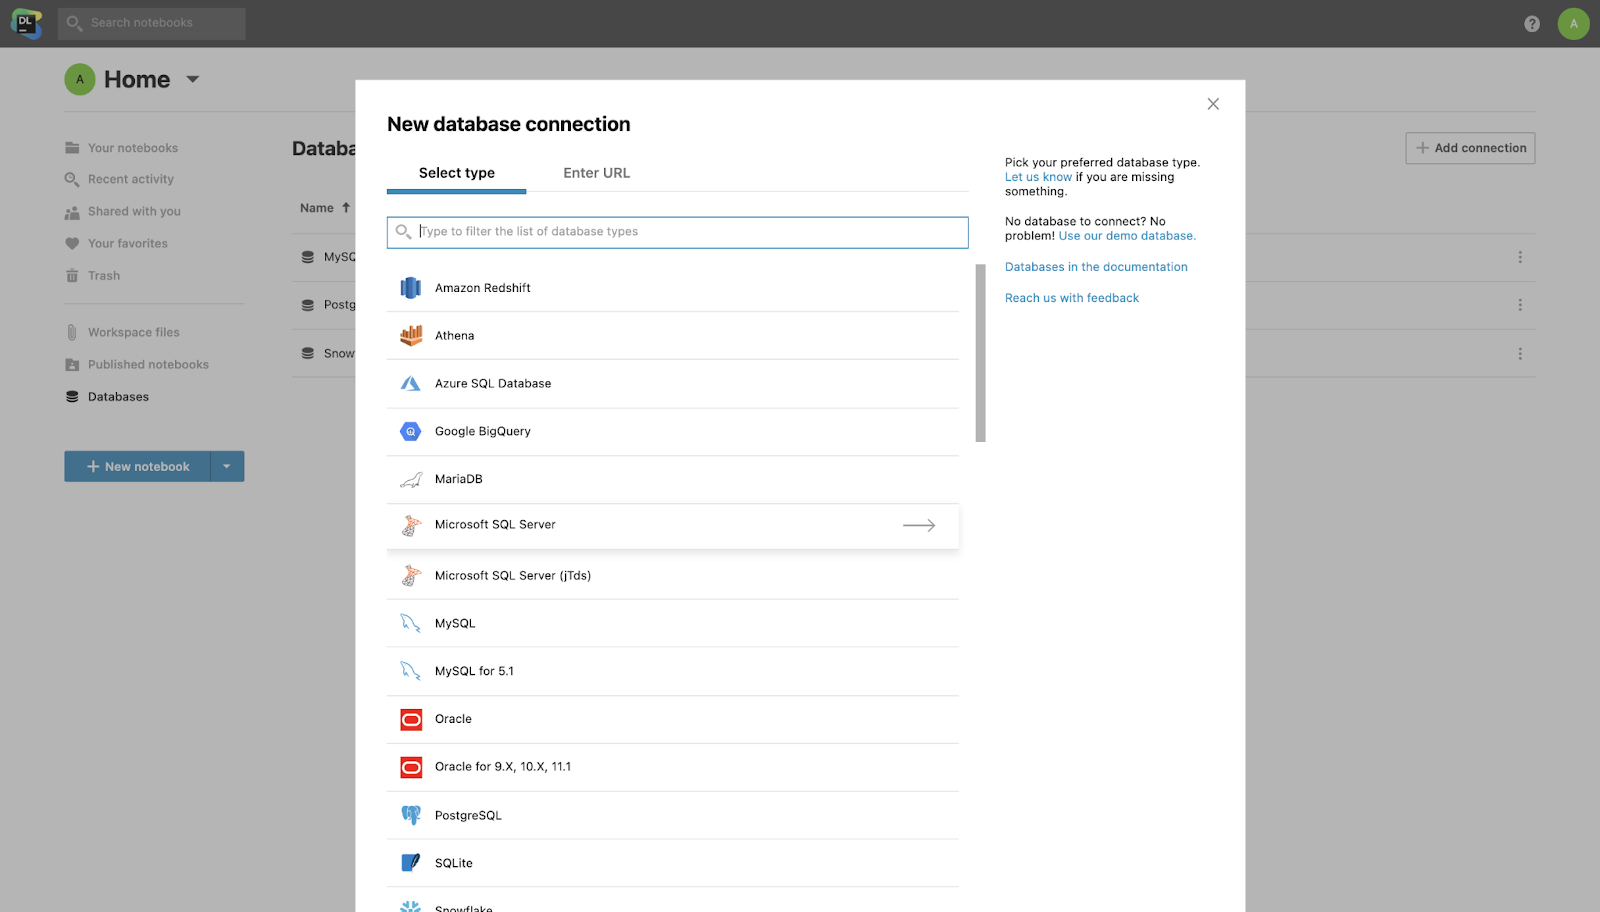
Datalore Enterprise supports user and password authentication for Amazon Redshift, Azure SQL Database, MariaDB, MySQL, Oracle, PostgreSQL, Snowflake, and more. Please contact us at datalore-enterprise@jetbrains.com if you have specific questions about database connectivity.
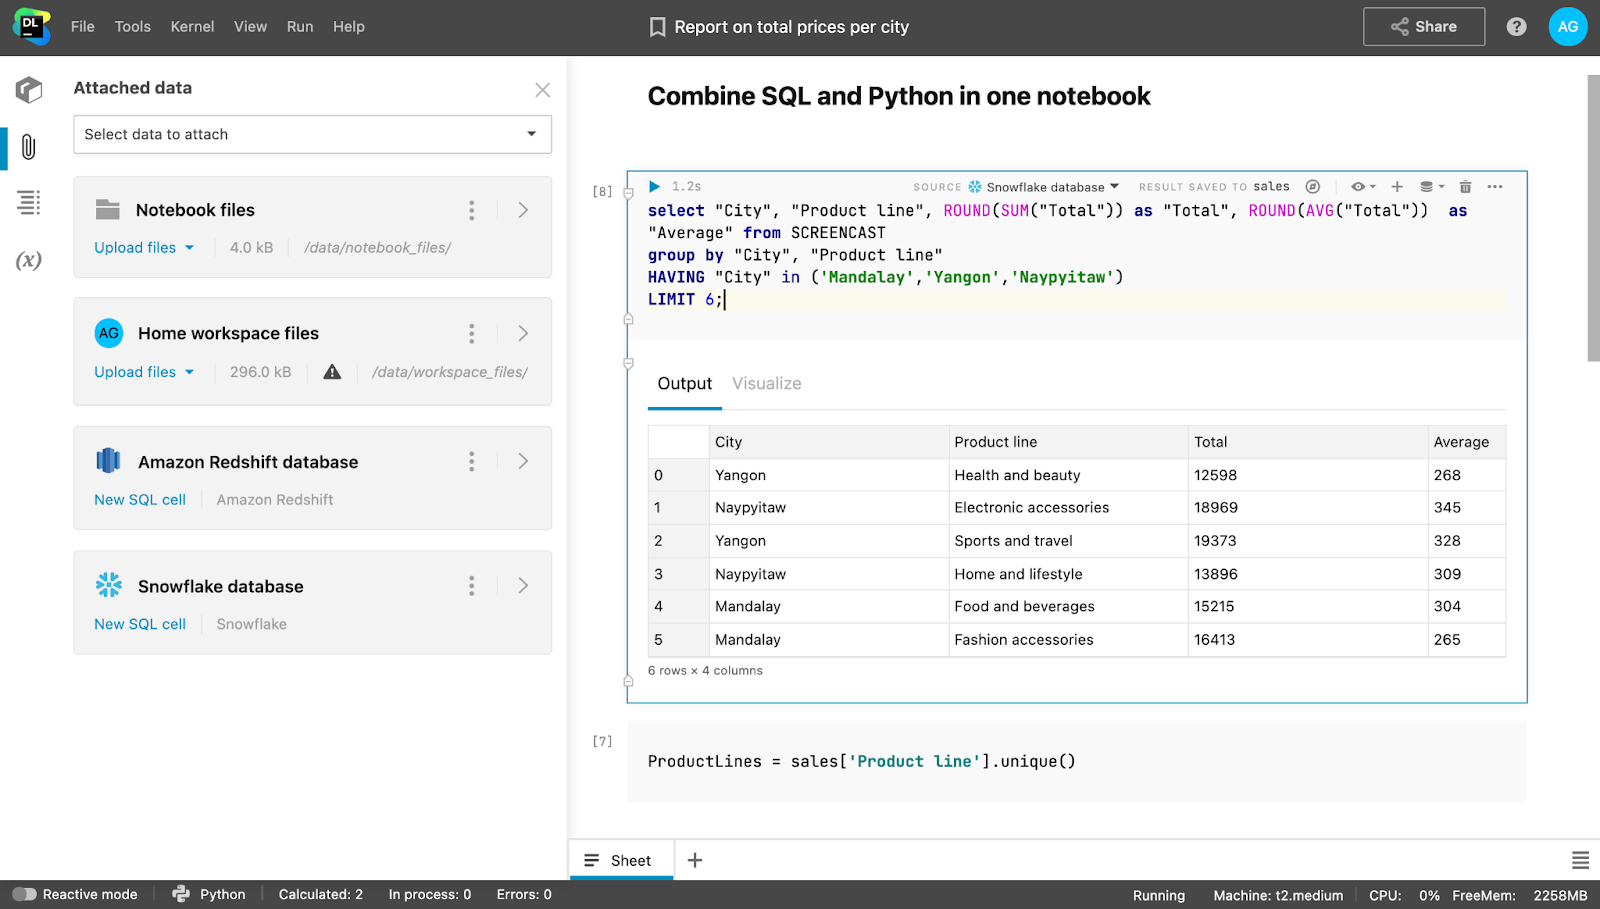
SQL cells
You can add SQL cells to get data from the database to your notebook. In addition to SQL syntax highlighting, you get code completion based on the introspected database tables. The query result is automatically transferred to a pandas DataFrame, and you can continue working on the dataset in Python.
Turn notebooks into interactive data stories
Sharing the results of your work as a data scientist can be tricky, as you can’t just share a Jupyter notebook full of code with a non-technical person. Sometimes you might spend hours compiling Powerpoint slides and then recompiling them when results get updated.
In Datalore Enterprise we’ve got this use case covered!
Publishing interactive reports
You can now turn notebooks into interactive reports with a few clicks. You can hide code cells from viewers and share interactive reports with your stakeholders by simply providing them with a link to the report.
Stakeholders will get their own copy and will be able to change control parameters and reevaluate a notebook with a single button.
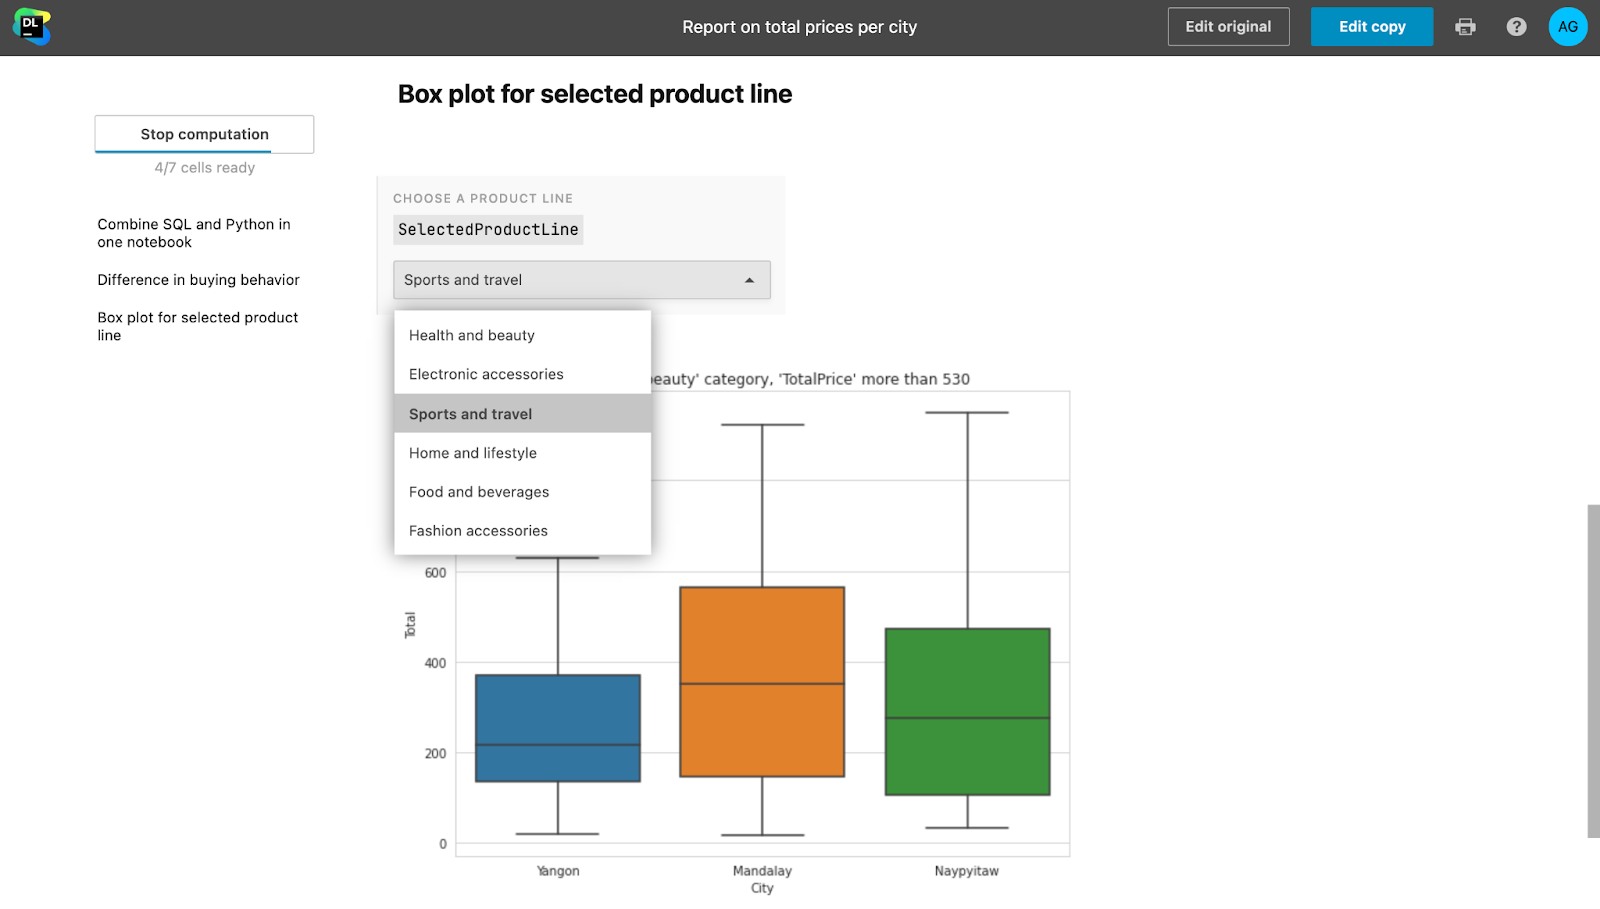
Chart cells, dropdowns, sliders, and text inputs
To make your notebooks and reports more interactive, we’ve introduced new cell types:
- You can add dropdowns, sliders, and text inputs inside your notebooks, and use the input values as variables inside your code.
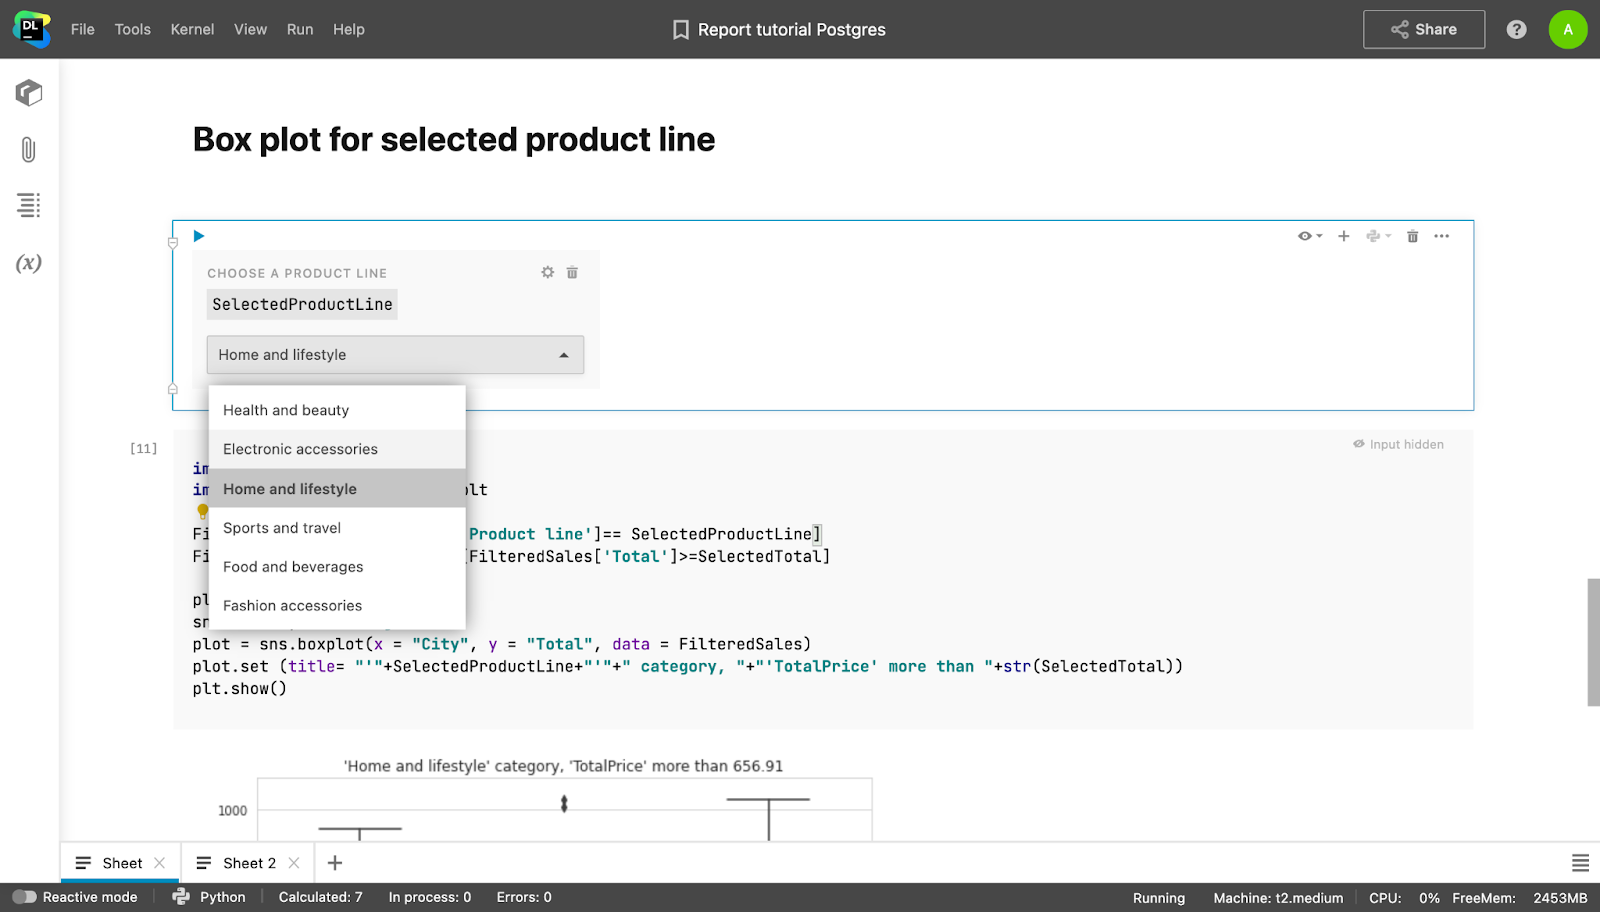
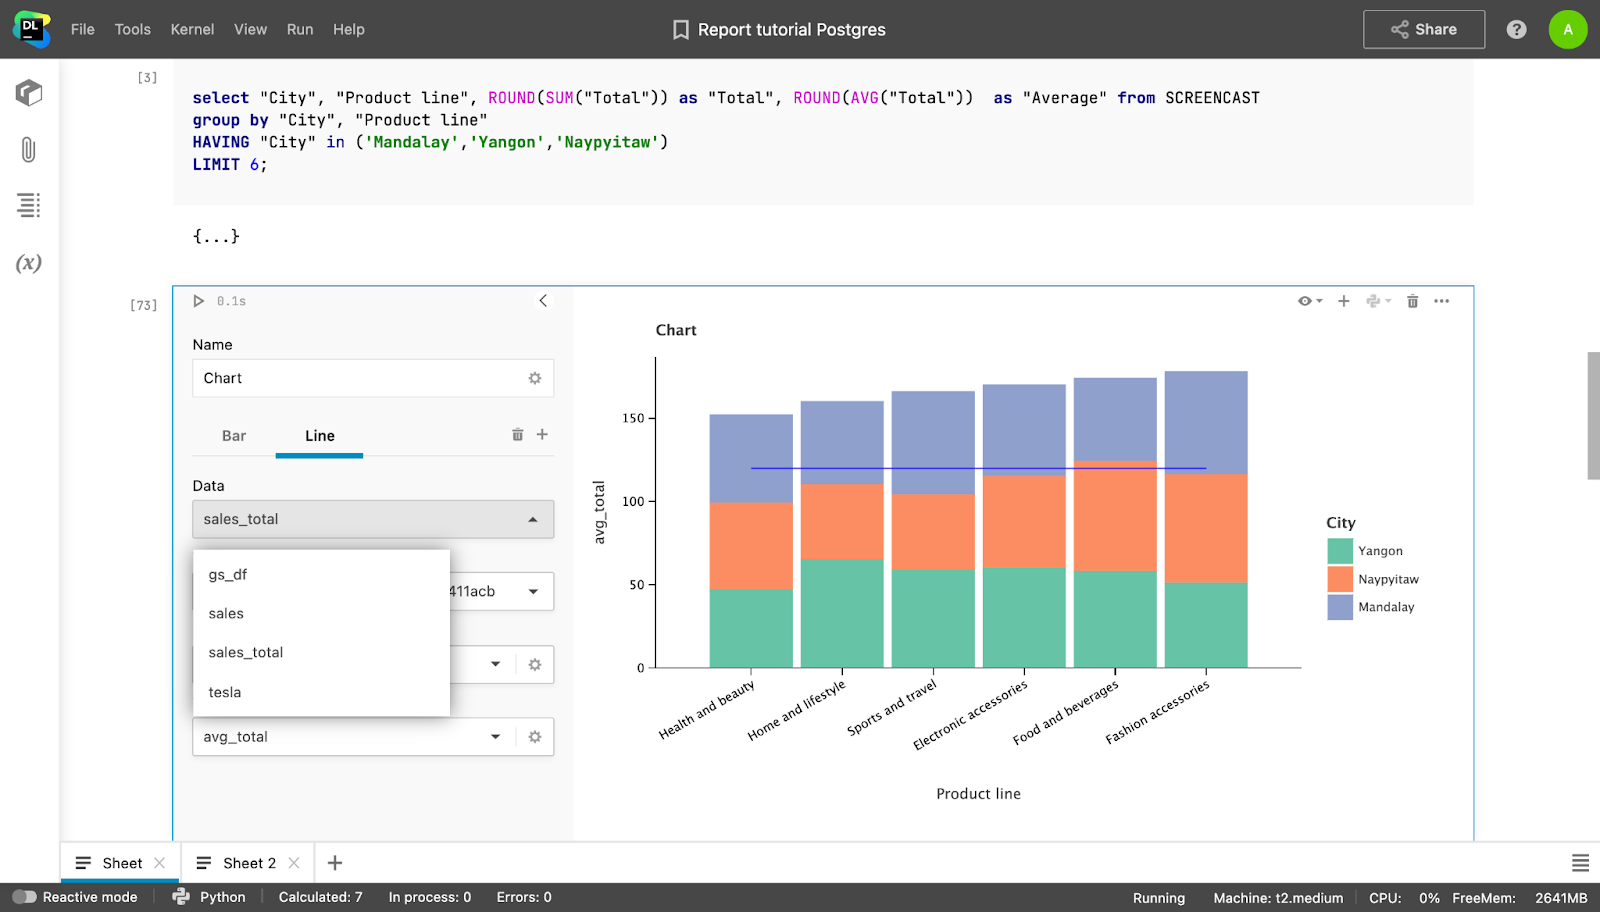
- You can create production-ready visualizations with just a few clicks inside Chart cells. The state of the cells is shared with collaborators, so you can work on visualizations together.
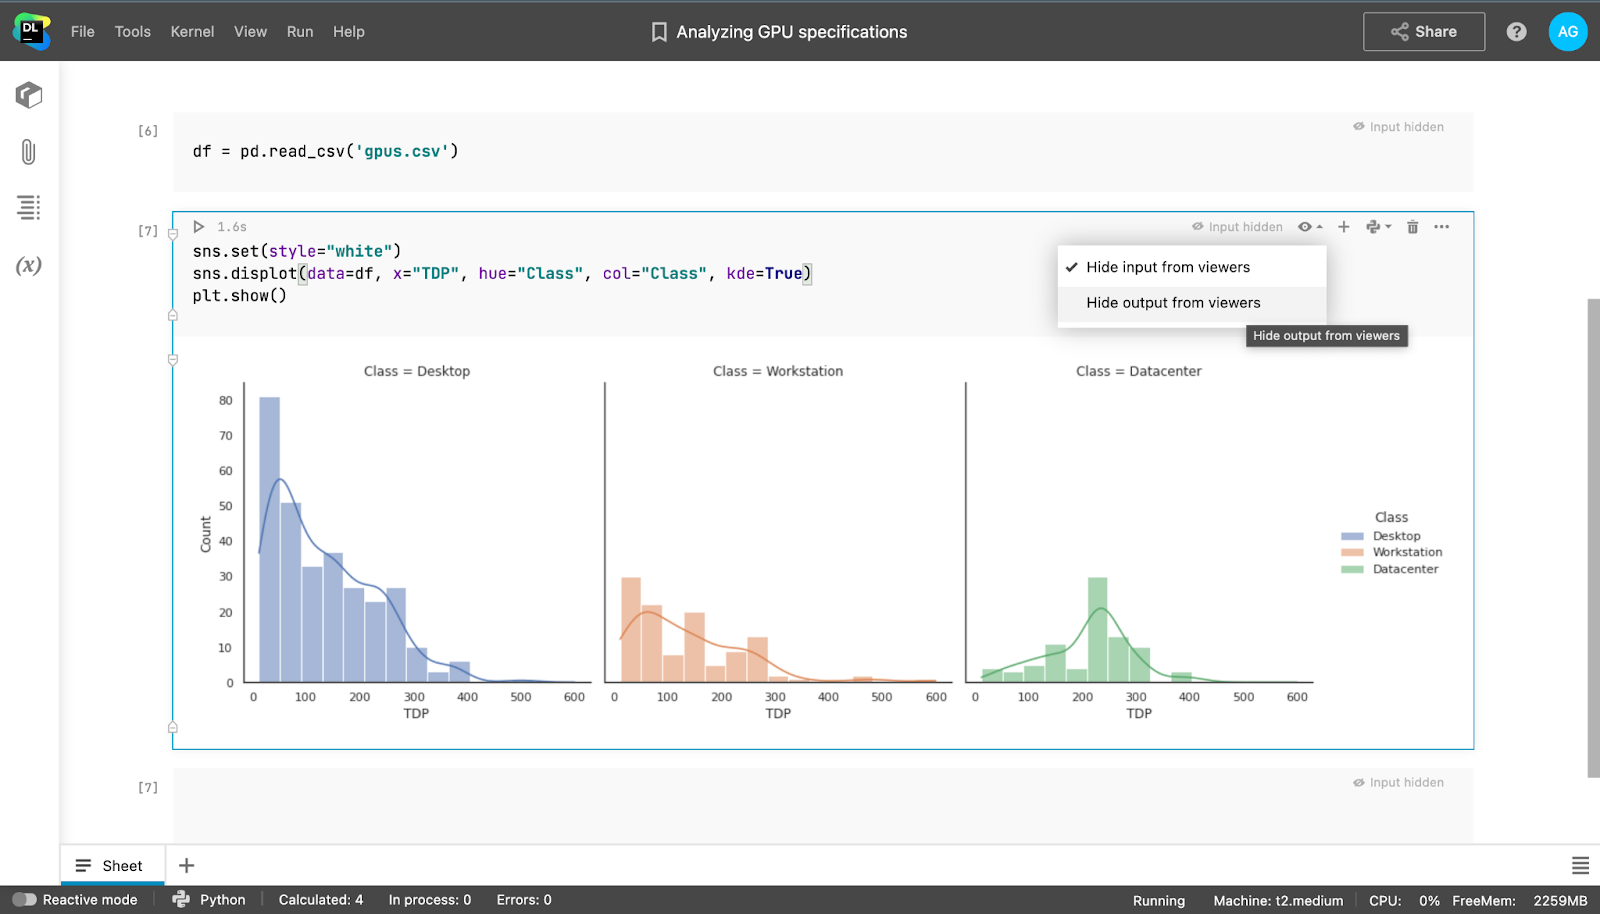
Configuring cell visibility options
When sharing your notebooks with viewers or publishing reports, you may want to completely hide specific information to make your notebooks look cleaner. In Datalore you can now hide specific cell inputs and outputs, or hide all inputs or outputs for the whole notebook.
Create R and Scala notebooks
With the new Datalore Enterprise release we’ve introduced support for the R and Scala languages. When writing code you’ll get code completion. For R you also have the conda package manager bundled.
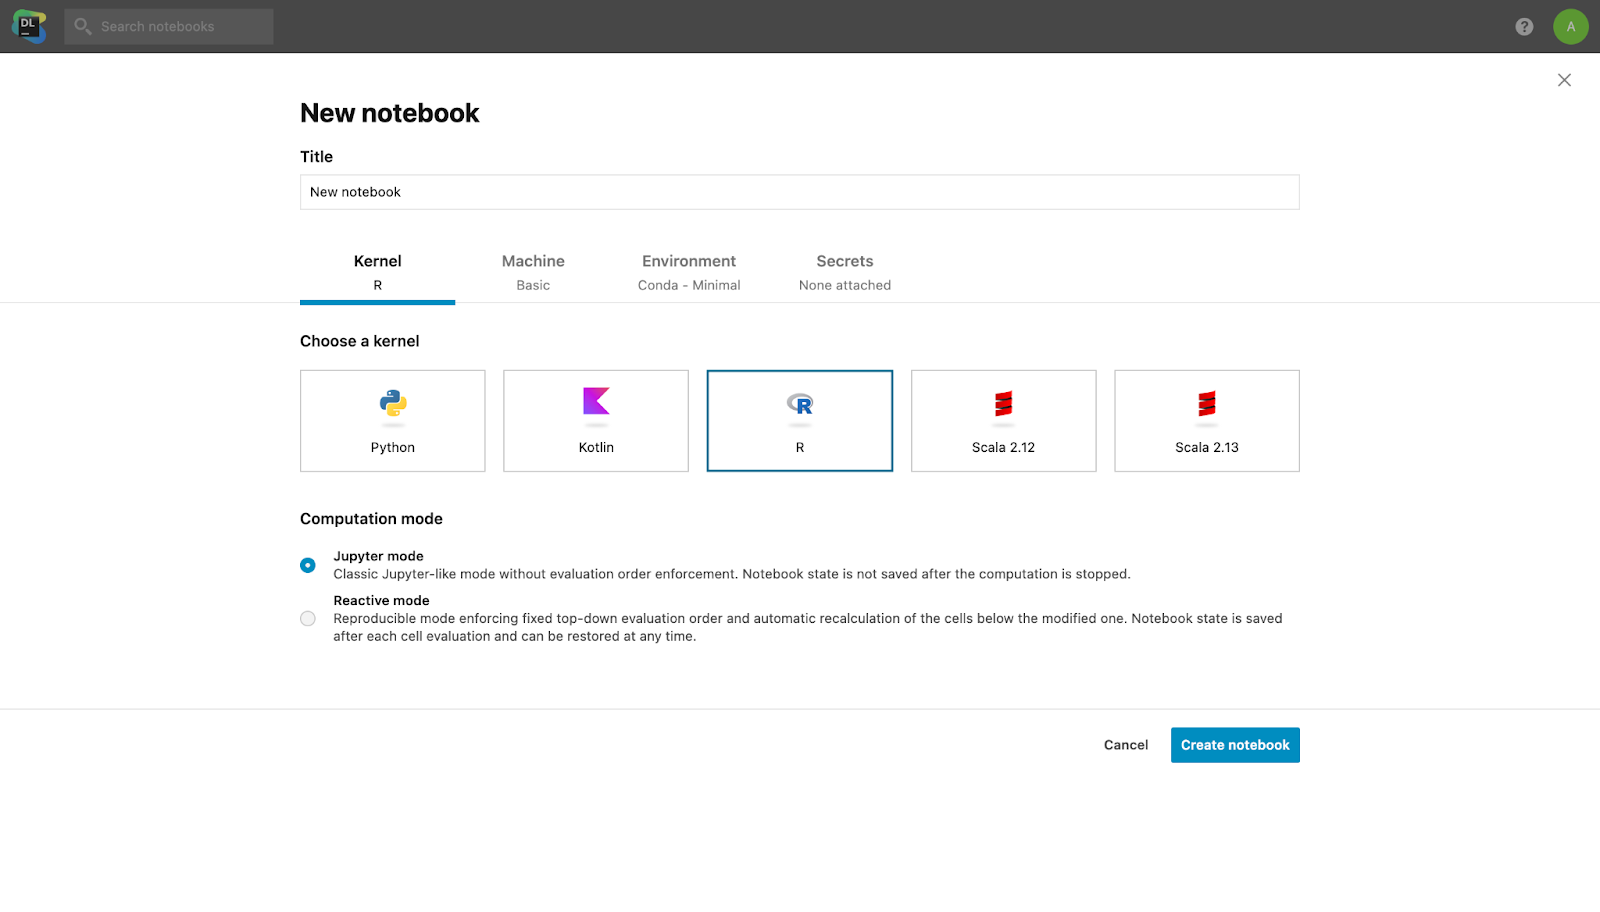
Use Reactive mode for reproducible research
For the last 3 years, our Datalore team has been experimenting with ways to address the topic of notebook reproducibility. Today we are happy to introduce the new Reactive mode to Datalore Enterprise. It helps you make sure your notebooks are always tidy and up-to-date.
With Reactive mode enabled, Datalore will enforce a top-down evaluation order and will automatically recalculate the cells below the modified one. Read more about Reactive mode and why the previous version required changes here.
Other improvements
Initialization scripts
Apart from configuring base environments and installing packages through the package manager, you can now add ad hoc customizations inside a script that you want to run before the notebook starts. Inside init.sh, you can specify all the build tools and dependencies you need for your notebook.
Support for Python 3.6+ versions
With the new version of Datalore Enterprise, you can choose from a variety of Python versions (3.6 or newer) and get corresponding code insight features for each one. You just need to preconfigure multiple base environments and your team will be able to switch between versions with a few clicks.
New plots in the Visualize tab
When you print a pandas DataFrame, Datalore will automatically show you a bunch of visualization options inside the Visualize tab. The new release introduces new plot types:
- Point plots
- Bar plots
- Area plots
- Correlation plots
You can now also configure the plot color based on specific column values.
GCS bucket mounting
Apart from AWS S3 bucket mounting, you can now also mount Google Cloud Storage buckets as folders to your notebook by simply providing the bucket name and .json authentication file content.
Last cell execution info
When hovering over the cell execution time you will now also see when the cell was last executed.
Cell collapsing
To help you stay more focused while writing code, we’ve added the ability to collapse specific inputs and outputs.
30-day free trial
You can try Datalore Enterprise free for 30 days. To request a trial or ask any questions, please contact us or schedule a meeting with our team. We provide a dedicated support channel for each Datalore Enterprise evaluator.
To stay updated about new features, subscribe to our blog and follow us on Twitter!
Kind regards,
The Datalore team