Datalore
Collaborative data science platform for teams
Introducing Datalore Enterprise 2022.1: Statistics Tab, Interactive Reports Upgrade, CSV File Editing, and More
Hello everyone,
Back in November 2021, we introduced two major features to Datalore Enterprise: interactive reports for sharing data insights and the Visualize tab for faster data exploration.
In Datalore Enterprise 2022.1, we’ve made improvements to these two workflows, and more. Read on to learn what else is new!
Interactive reports upgrade
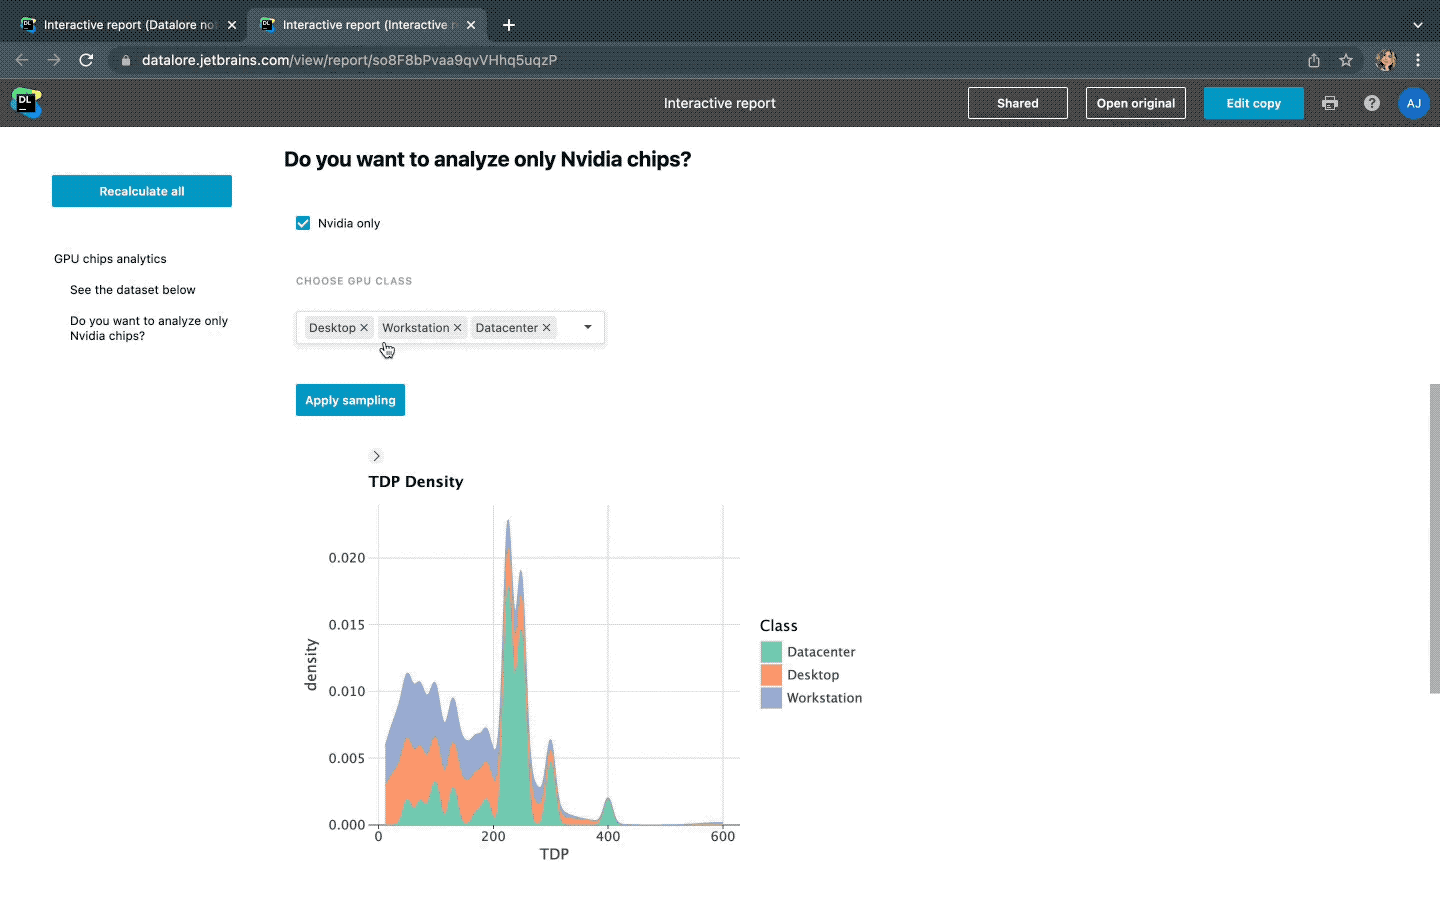
Introducing Reactive mode to reports
In Datalore you can turn your Python, R, Scala, and Kotlin notebooks into web data apps, which your colleagues can access via a link – even if they don’t have a Datalore account.
With Datalore Enterprise 2022.1, you can use Reactive mode in your interactive reports to update the report contents as the users interact with it. Without Reactive mode switched on, users will need to click the Recompute button to update the results each time.
You can try the interactive reports feature in our hosted cloud version (Community and Pro plans are available) or request a Datalore Enterprise trial for an on-premises setup.
See interactive report example
Datalore Enterprise is a data science notebook platform for teams that can be hosted privately, on-premises, or in the cloud.
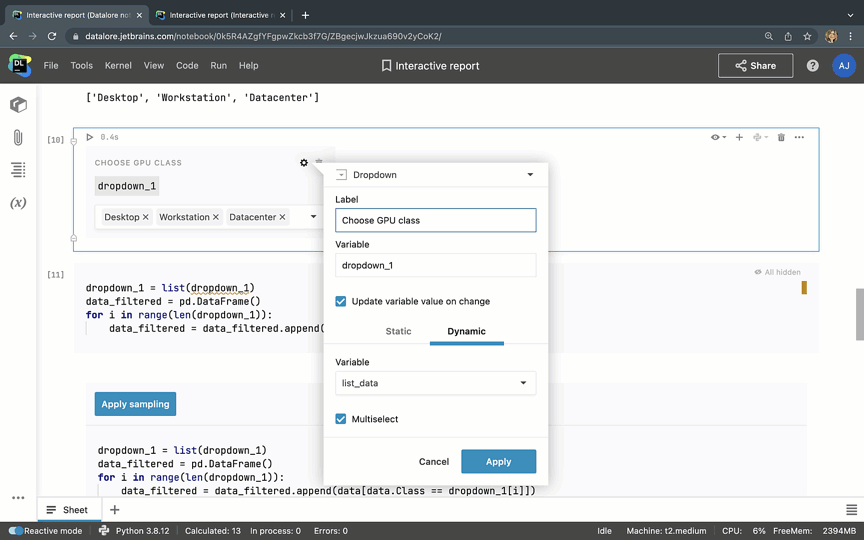
New interactive controls
We’ve added new interactive controls to the Datalore notebooks, and now you can add:
- Checkboxes that will assign a certain variable with either a True or False value.
- A multi-select option for dropdowns.
- A text area for longer text inputs.
- Visibility control that will collapse the specified number of subsequent cells in the reports.
- Upper and lower limits that can be defined from variables in the Slider controls.
New data exploration features
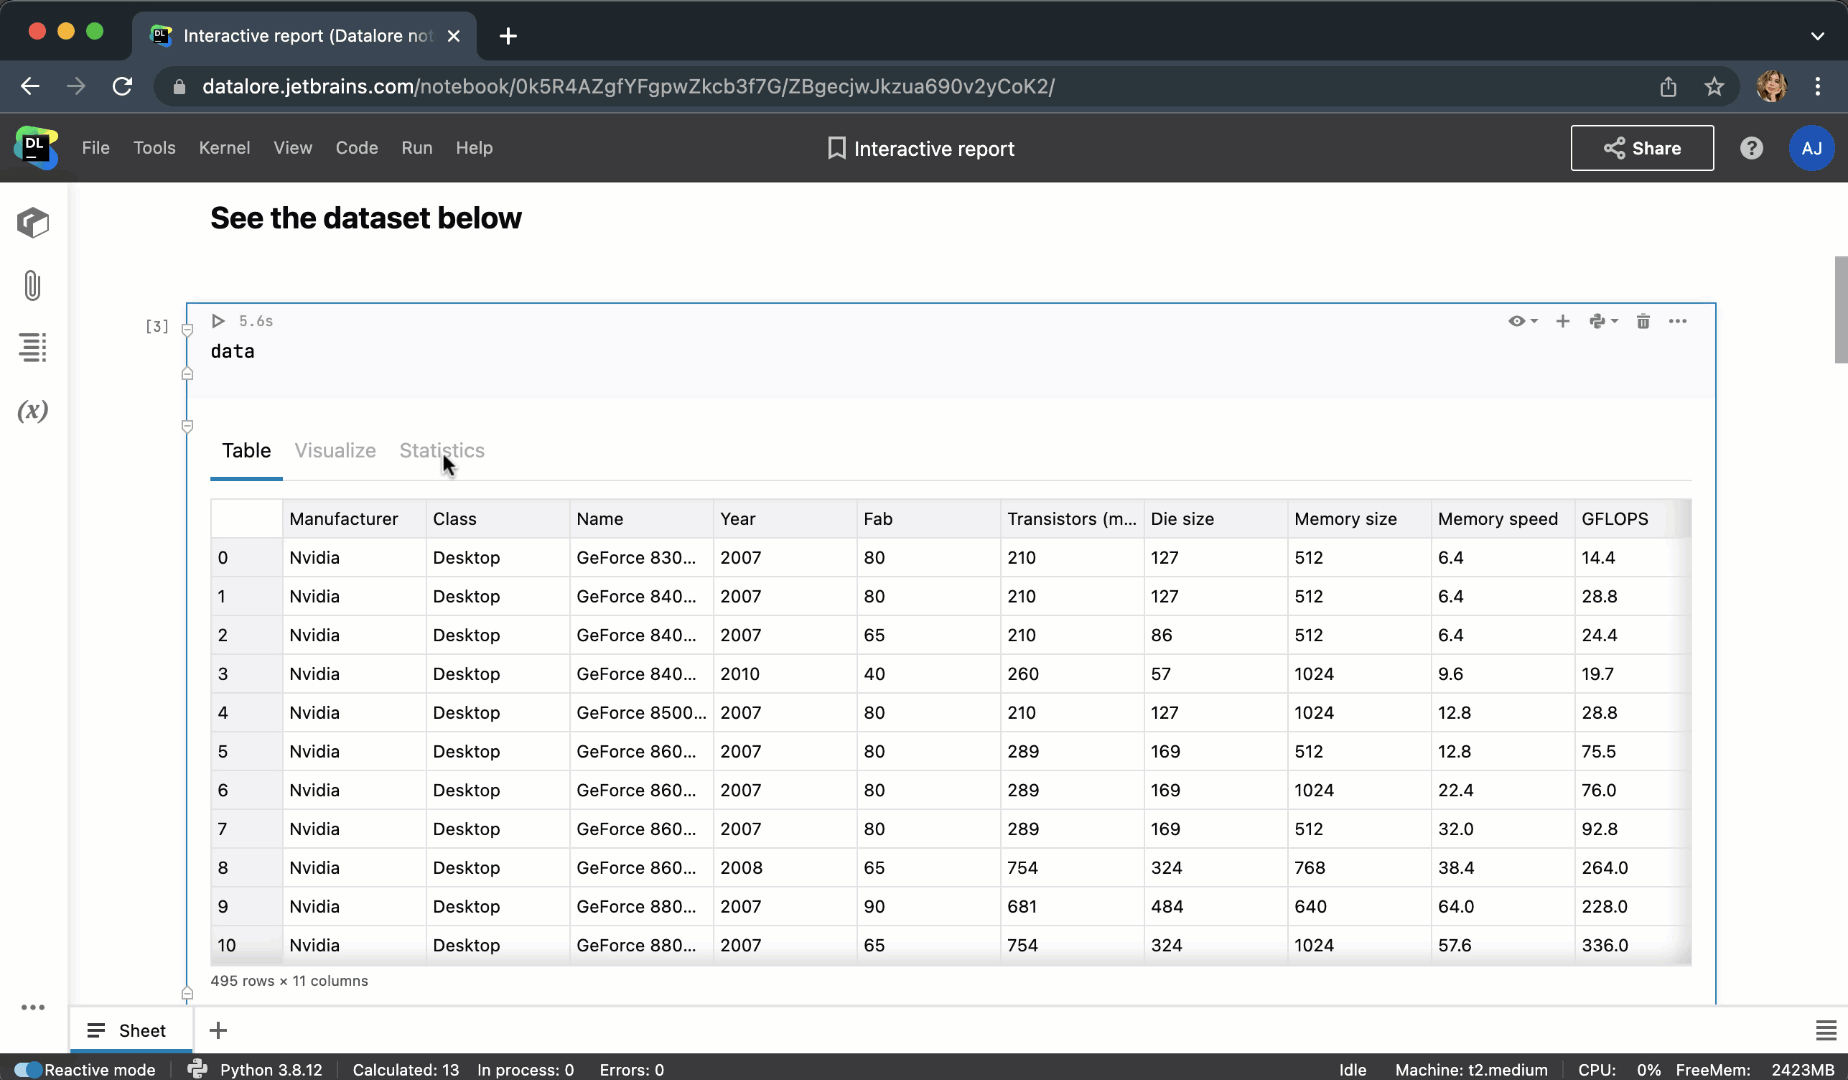
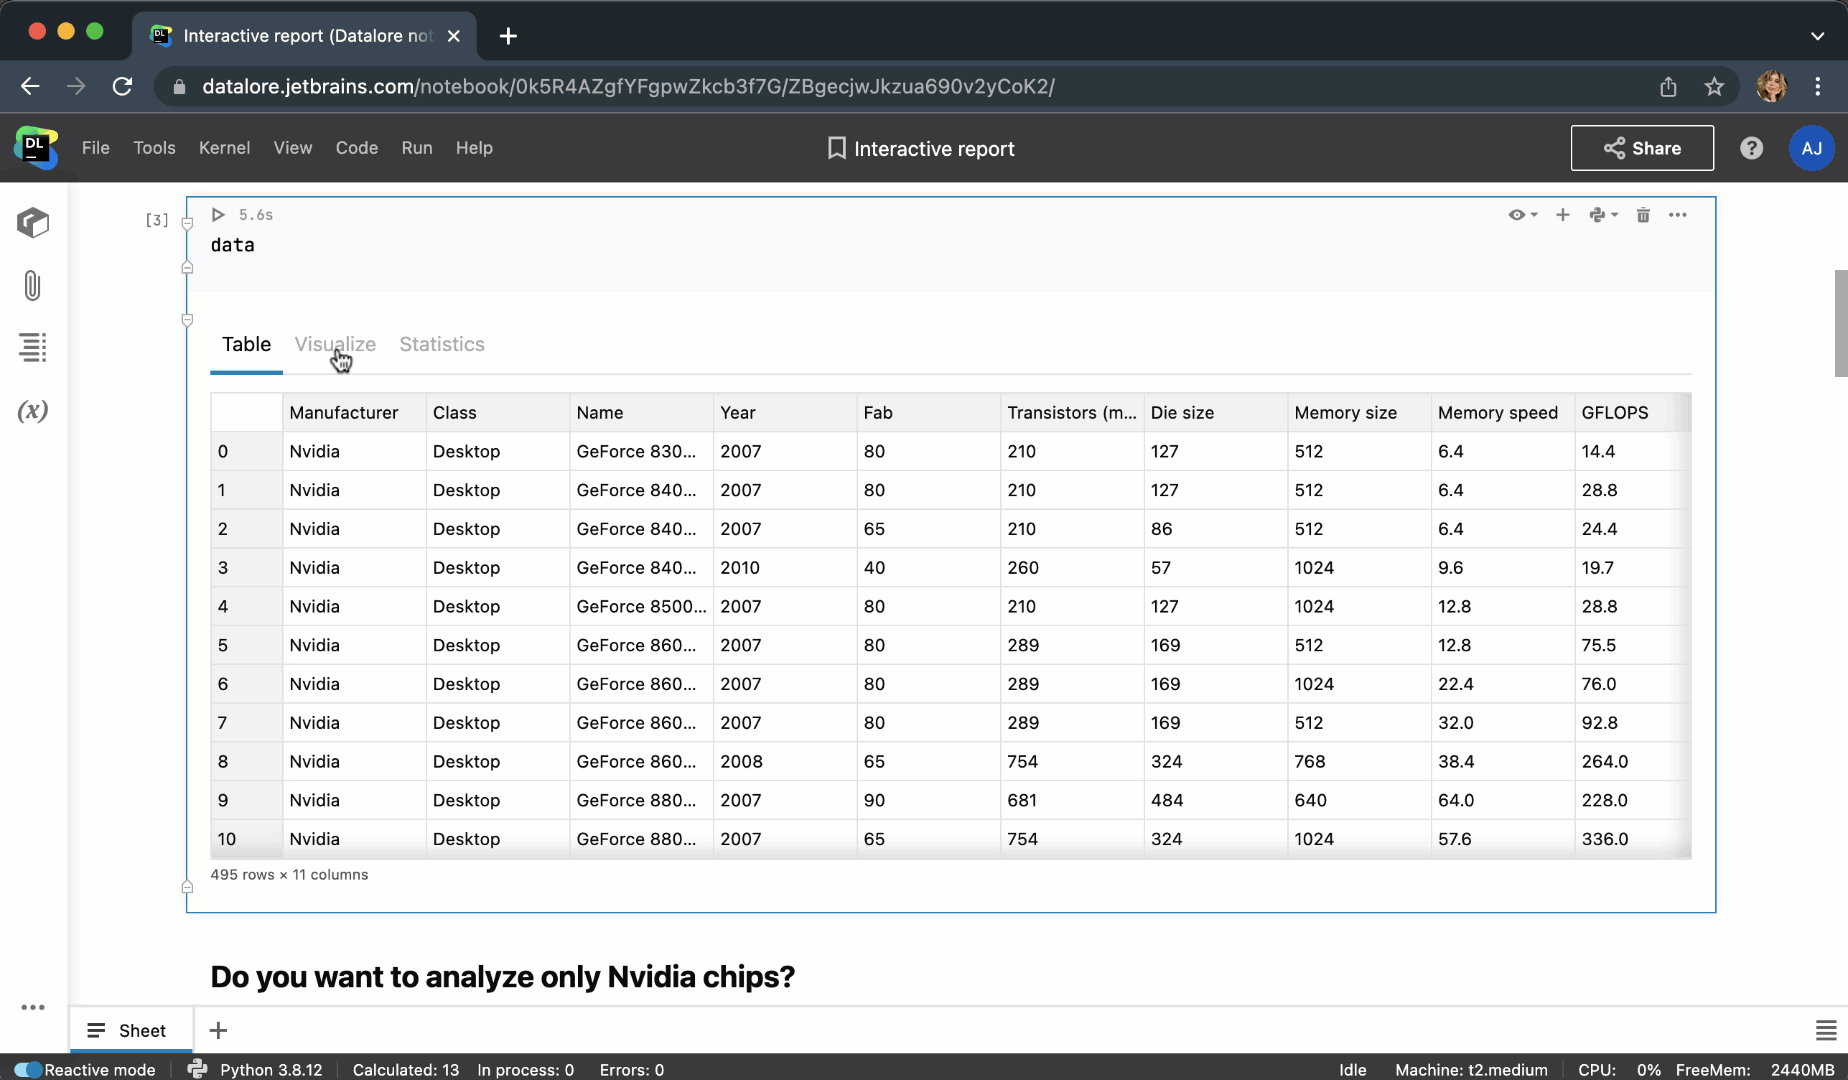
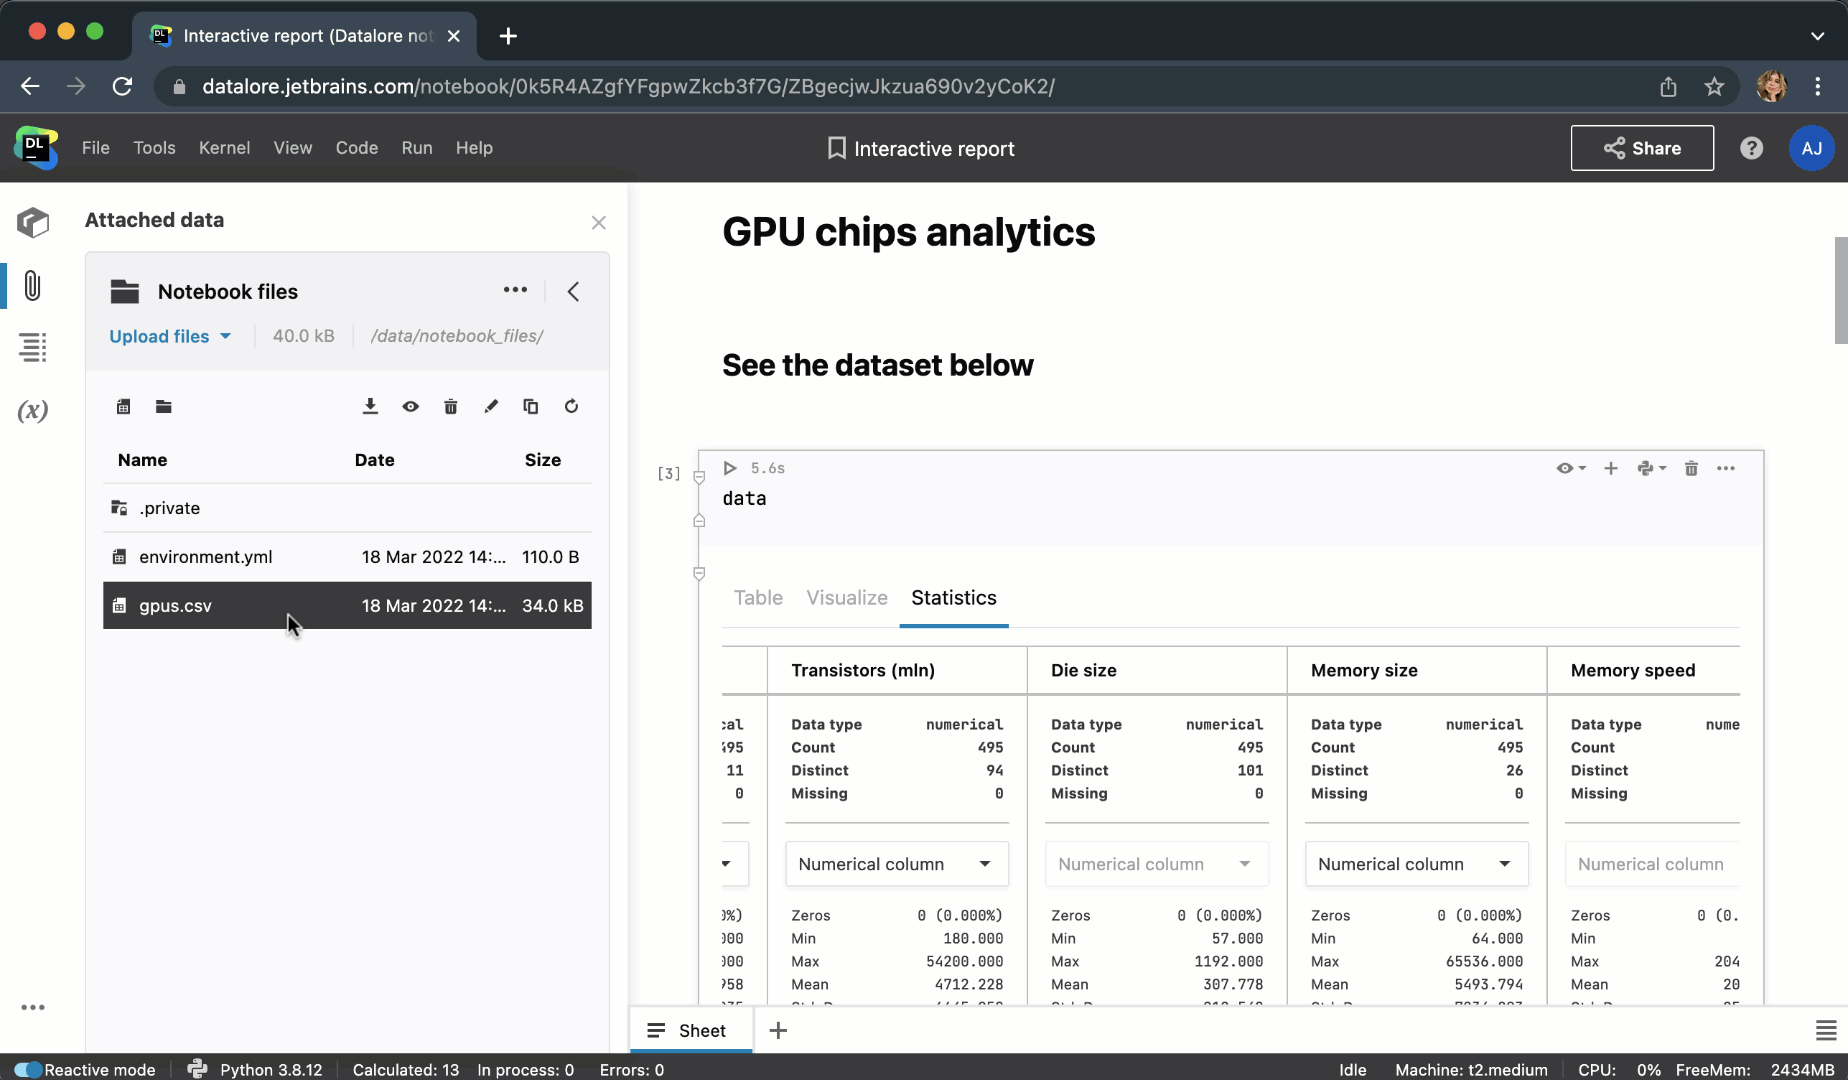
Statistics tab
With one click, you can get essential descriptive statistics for a DataFrame inside a separate Statistics tab. For categorical columns, you will see the distribution of values, and for numerical columns, Datalore will calculate the min, max, median, standard deviation, percentiles, and also highlight the percentage of zeros and outliers.
Visualize tab improvements
We’ve updated the look and feel of the Visualize tab:
- Plots are now bigger
- The plot configuration has been moved to the left-hand side of the tab
- Lets-plot library graphics have been updated
We’ve also added seamless transitions from the Visualize tab to Chart cells, where you can further customize plots, as well as create multi-layered visualizations and collaborate on them.
CSV file previews and editing
With Datalore Enterprise 2022.1 you can open, create, and edit CSV and TSV files right inside the Datalore editor. It is possible to modify the cells’ contents, add new rows and columns, and sort the data.
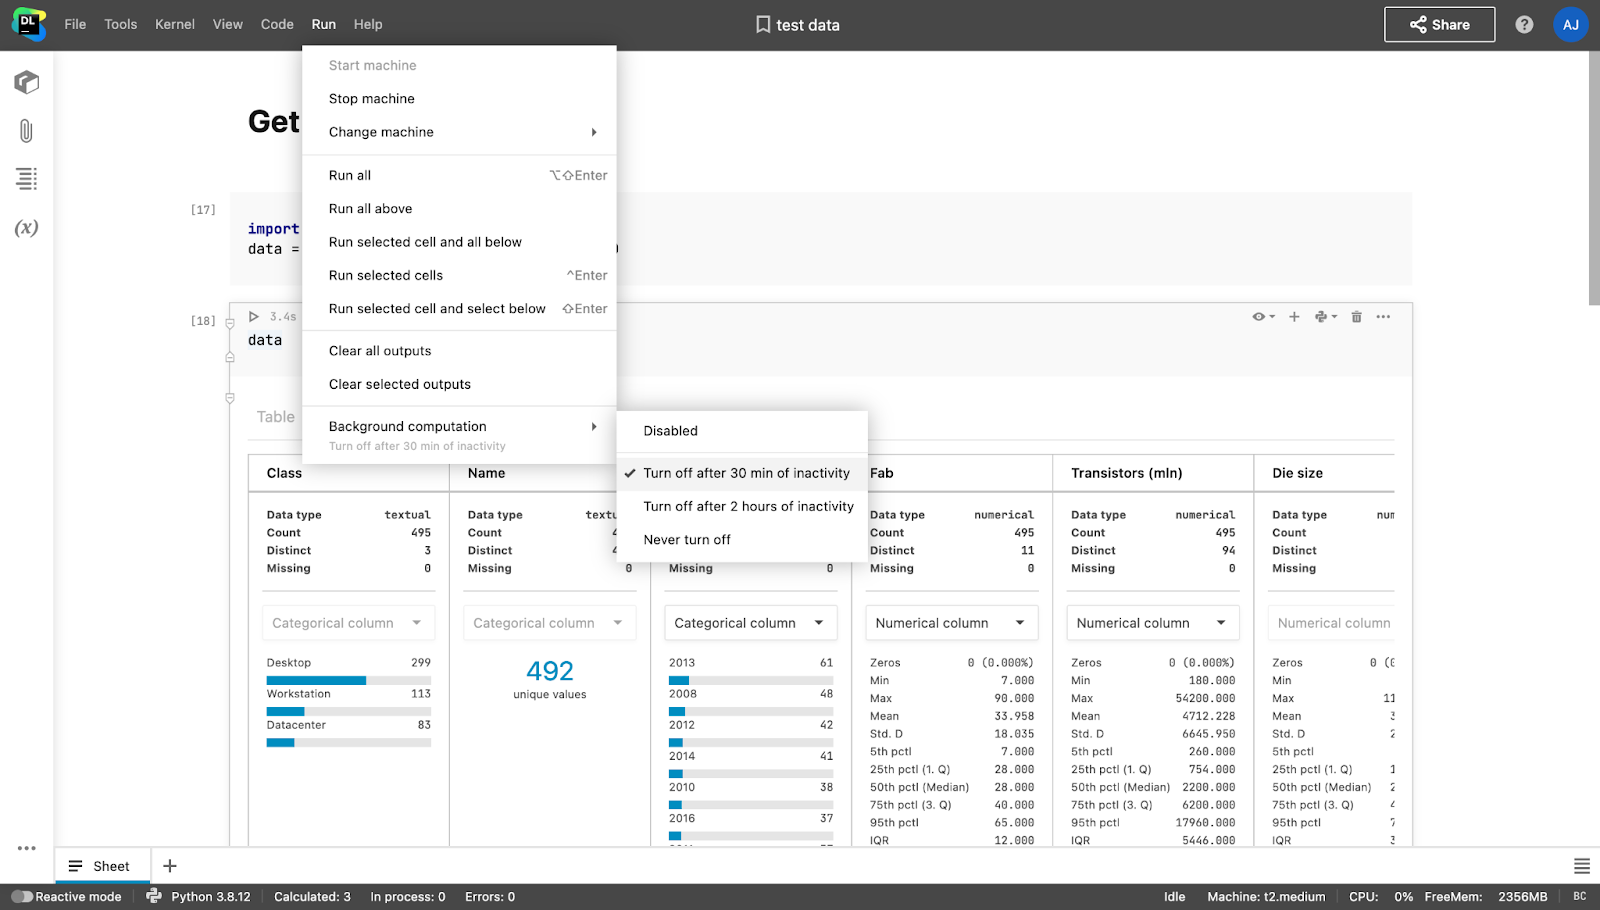
Сut-off timer for background computation
Background computation mode in Datalore allows you to run computations even if the browser tab is closed. In this release, we’ve added the ability to set when the notebook computation will shut down after the kernel goes idle. If you are training your models on expensive-to-run machines, this feature will help you reduce computation costs. To help you check whether Background computation is switched on, we’ve added an indicator to the bottom-right corner of the editor.
Audit log
You can turn on user action logging inside your on-premises setups. The logs will help you investigate any compliance requests.
Tracking collaborator’s cursors
You can navigate to a collaborator’s cursor and follow along in real time simply by clicking on the collaborator’s account icon in the upper-right corner.
Other improvements
- Reports can be published in full width mode to use the entire width of the browser window.
- Reports have improved error highlighting.
- Variable viewer now displays the object size.
- Worksheets can be duplicated in the notebook.
- The viewport will extend when the last cell of the notebook is scrolled past.
- Cells that are queued for processing are indicated better.
- Empty code cells are now automatically hidden in the reports.
30-day free trial
You can try Datalore Enterprise free for 30 days. To request a trial or ask questions, please contact us or schedule a meeting with our team. We provide a dedicated support channel for each Datalore Enterprise evaluator.
How to upgrade
To upgrade from your current Datalore version, please follow the steps in our documentation.
To stay updated about new features in Datalore, subscribe to our blog and follow us on Twitter!
Kind regards,
The Datalore team