

Datalore
Collaborative data science platform for teams
Introducing Interactive Reports to Datalore!
Greetings from the Datalore team!
We talk and write a lot about sharing in Datalore as we truly believe in the collaborative nature of data workflows.
When you get stuck on a piece of code, you can ask for help in real time by sharing your notebook with an Edit access link with your colleagues. When presenting live tutorials, sharing notebooks with a View access link comes handy. And when delivering results, you might want to share the final piece of work.
Today we are happy to introduce a new feature for the result sharing workflow – publishing of Interactive reports.
Read on to learn how you can create interactive data stories with Datalore.
What is an Interactive report in Datalore?
A report in Datalore is a web page that is accessible by everyone via link. Using reports, you can share your work with everyone, even those without Datalore accounts.
Previously, it was only possible to publish static reports. This is already better for many use cases than sharing a notebook as a PDF or IPYNB file, as you can update the content and your viewers always have access to the latest version of your results.
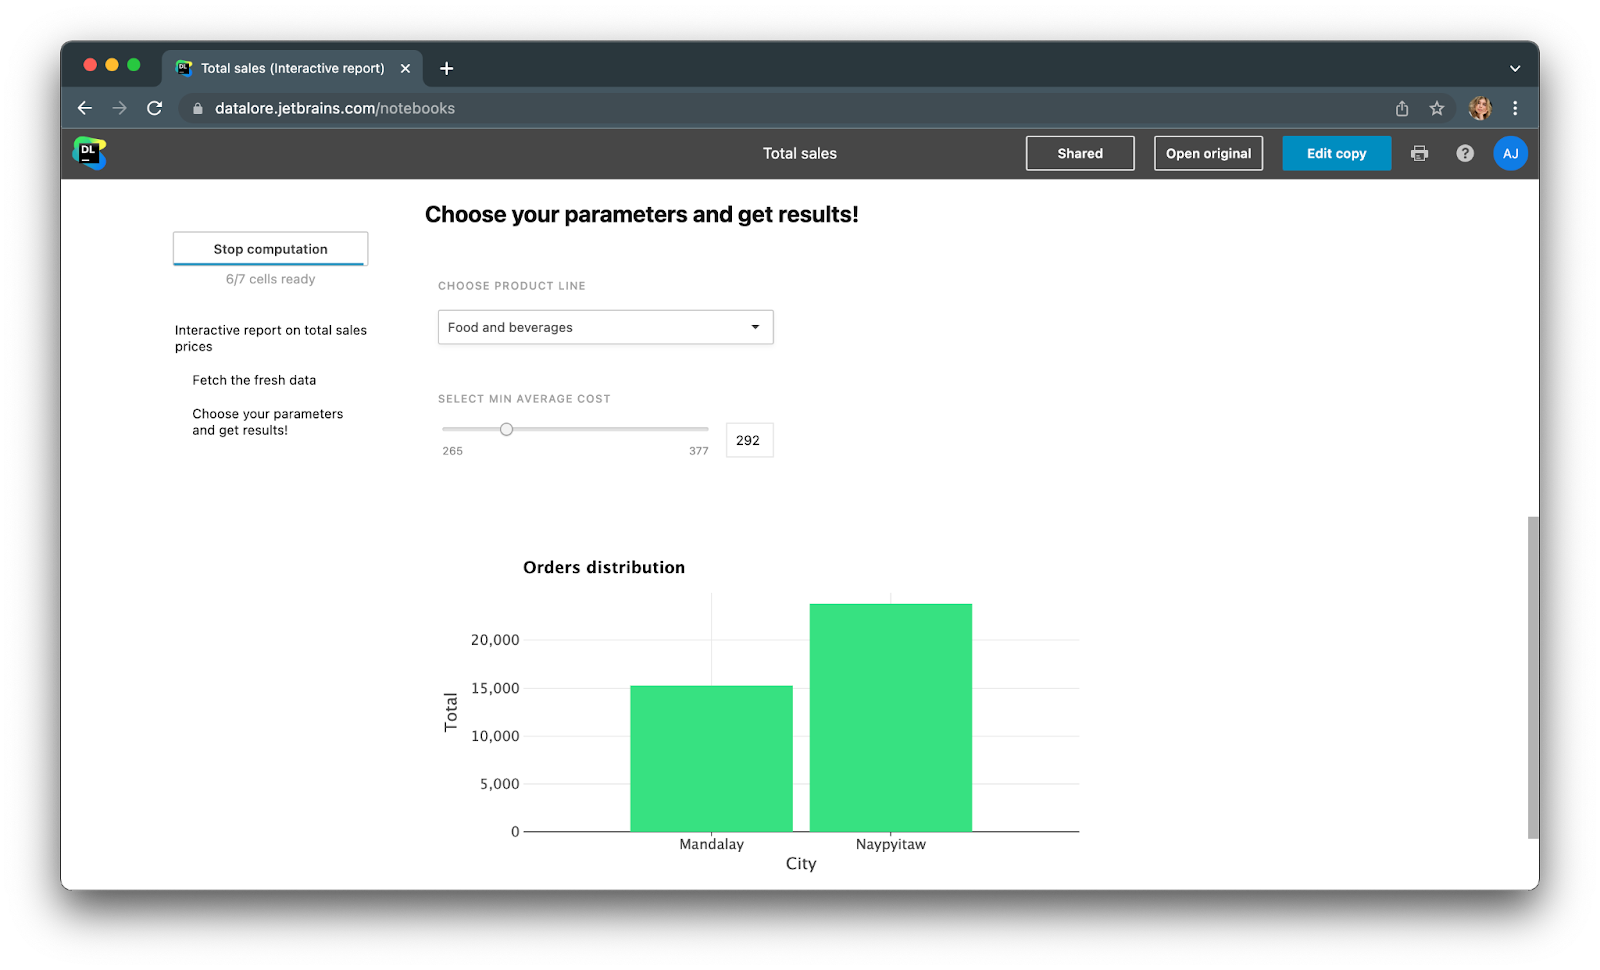
With new Interactive reports, report viewers can manipulate the controls (dropdowns, sliders, widgets, etc.) and get the results recomputed on demand. Each report viewer will get their own copy of the report and be able to manipulate the controls independently from other team members.
How to publish an Interactive report
Step 1: Add interactivity by using Datalore’s dropdowns, sliders, text inputs, or Ipywidgets!
Step 2: Hide unnecessary code by hiding specific cell inputs or outputs.
Step 3: Hit the share button, choose to publish as an Interactive report, and voila!
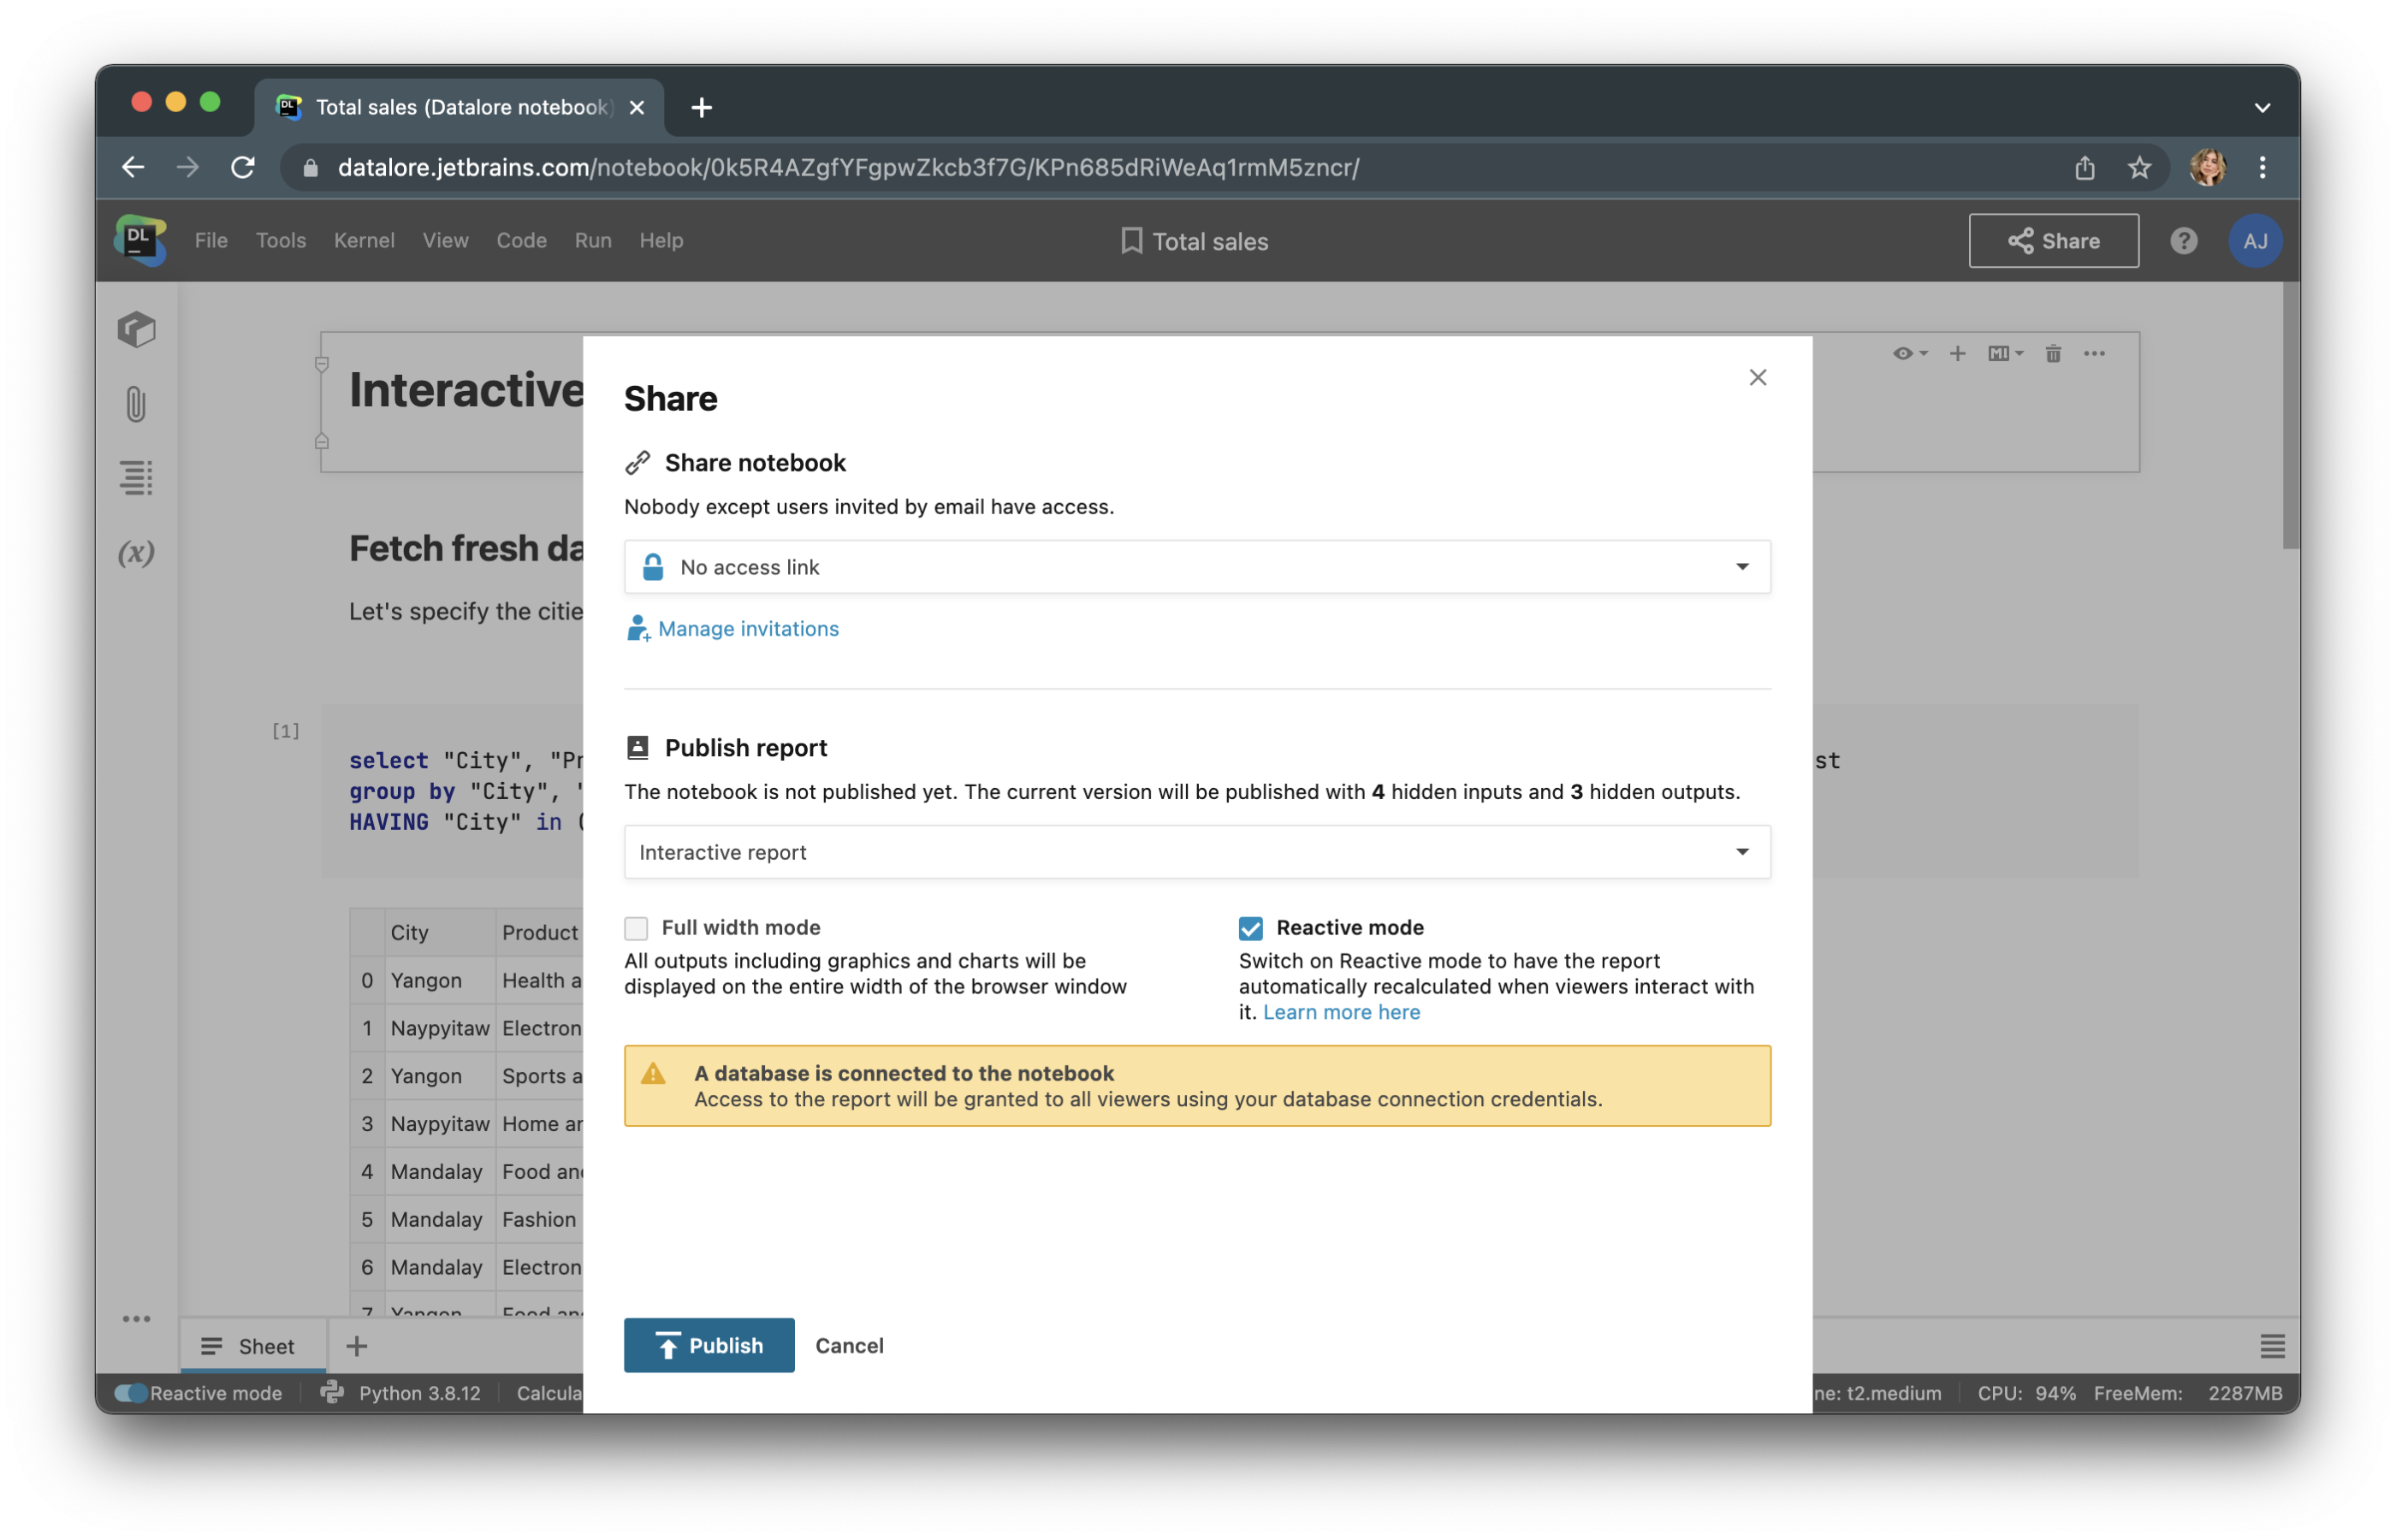
Tip: Turn on Reactive mode for your Interactive report to update the report contents when report users change the controls. Without Reactive mode, report users will have to click the Recompute button to update the results.
See an interactive report example
When are Interactive reports useful?
- When you want to bring a more personal experience to your stakeholders while avoiding duplicating your work. For example, you can prepare one sales overview report and each regional sales manager can choose to view data only for their region.
- When you are tired of updating reports on a regular basis. Just prepare a query that will take the fresh data, and each report viewer will get updated results right when they need it.
- When you don’t want to set up separate hosting services for your dashboards. Datalore will automatically publish your report via link, so you only need to send the link to your stakeholders.
FAQ
Who can create interactive reports?
Everyone! Datalore Professional and Enterprise users can create an unlimited number of Interactive reports and have them run by an unlimited number of concurrent users. Datalore Community users can publish one Interactive report and have up to two simultaneous report runners.
Do reports consume my computational resources?
Yes. When a report viewer hits the Recalculate button or changes the control value, a new computation is launched in the backend that consumes the report owner’s computational resources. This computation will also count as a parallel computation for the owner, so Community users’ Interactive reports can be run simultaneously by up to 2 users.
What kernels are reports available for?
Interactive reports are available for every kernel in Datalore. You can create Interactive reports with Python, Scala, R, and Kotlin and add SQL cells inside each notebook.
Do Interactive reports work with SQL cells and database connections?
Yes, they do. When the computation is launched, it uses the report owner’s credentials to run the SQL query in the backend. Passwords aren’t exposed and can’t be retrieved.
Last but not least, you can watch this short video tutorial for tips on mastering Datalore and to see the feature in action.
That’s all for now. Follow us on Twitter @Datalore to hear about our updates!
Happy analyzing!
The Datalore team


