

Datalore
Collaborative data science platform for teams
New in Datalore: Enterprise Release, Statistics Tab, Interactive Reports, and More
Dear Community, Professional, and Enterprise plan users,
In the past months, we’ve been working hard on improving the data exploration and collaboration workflows in Datalore. In this blog post, we’ll give you an overview of what’s new!
Before we start, we have a quick question, is there anyone here from Berlin? On April 11th, our team will be visiting PyData Berlin and it’s a great chance to meet in person! Just mention us on Twitter, if you are going, and swing by our booth to say “Hi!”.
Announcing Datalore Enterprise 2022.1
We’ve released Datalore Enterprise 2022.1 – our first major update of the year. It includes an Interactive reports upgrade, new interactive controls, a Statistics tab for exploratory research, and more.
Datalore Enterprise is a self-hosted version of the product for teams that need extra security, customizations, and unlimited features. You can request a 30-day free trial for your team below ??
You can read more about the release in this blog post.
Statistics tab
A huge part of data scientists’ time is devoted to data exploration and cleanup.You can now get essential descriptive statistics for a DataFrame inside a separate Statistics tab in Datalore without having to write a single line of code.
Interactive reports in Datalore Community and Professional!
First introduced to Datalore Enterprise in November 2021, Interactive reports are now available unlimited for Professional users as well. Community users can also try out this feature and publish one interactive report.
With Interactive reports, report viewers can manipulate the controls (dropdowns, sliders, widgets, etc.) and get the results recomputed on demand. Each report viewer will get their own copy of the report and can manipulate the controls independently from other team members.
Open interactive report example
You can read more about the feature in this blog post.
New interactive controls
We’ve added new interactive controls to the Datalore notebooks, and now you can add:
- Checkboxes that will assign a certain variable with either a True or False value.
- A multi-select option for dropdowns.
- A text area for longer text inputs.
- Visibility control that will collapse the specified number of subsequent cells in the reports.
- Upper and lower limits that can be defined from variables in the Slider controls.
Changes to background computation
Background computation mode in Datalore allows you to run computations even if the browser tab is closed.
We’ve added the ability to set when the notebook computation will shut down after the kernel goes idle. This feature will help you spend less quota time and get more from Datalore monthly plans.
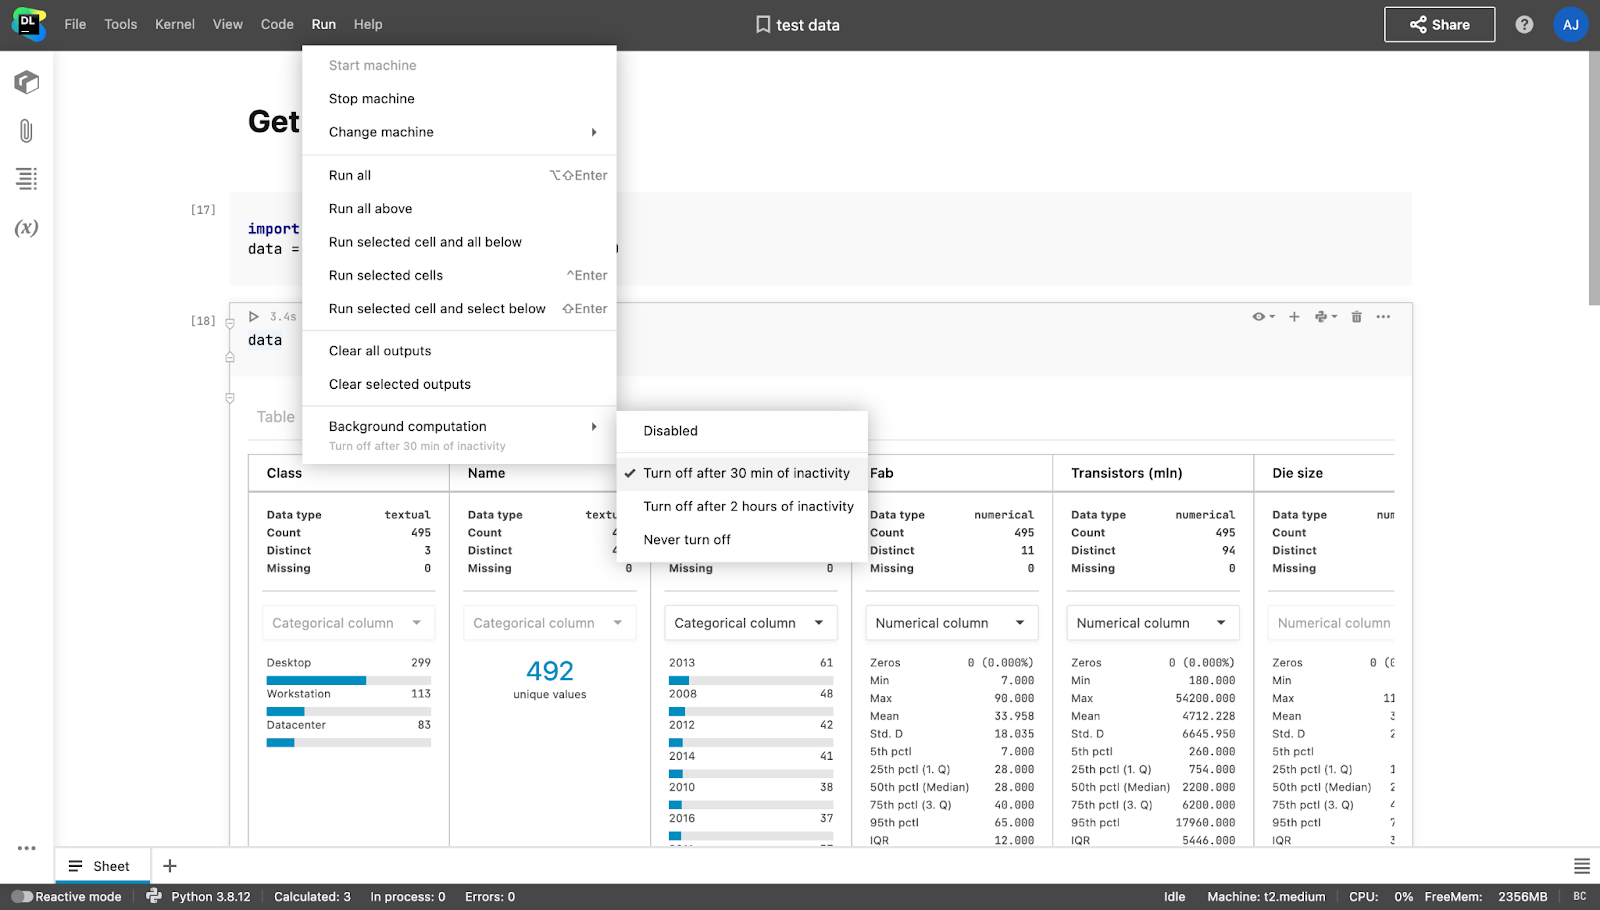
To help you check whether Background computation is switched on, we’ve added an indicator to the bottom-right corner of the editor.
For Professional and Enterprise plans the feature is unlimited, Community plan users get up to 4 hours of Background computation per session.
CSV file editor and previews
You can now open, create, and edit CSV and TSV files right inside the Datalore editor. It is possible to modify the cells’ contents, add new rows and columns, and sort the data.
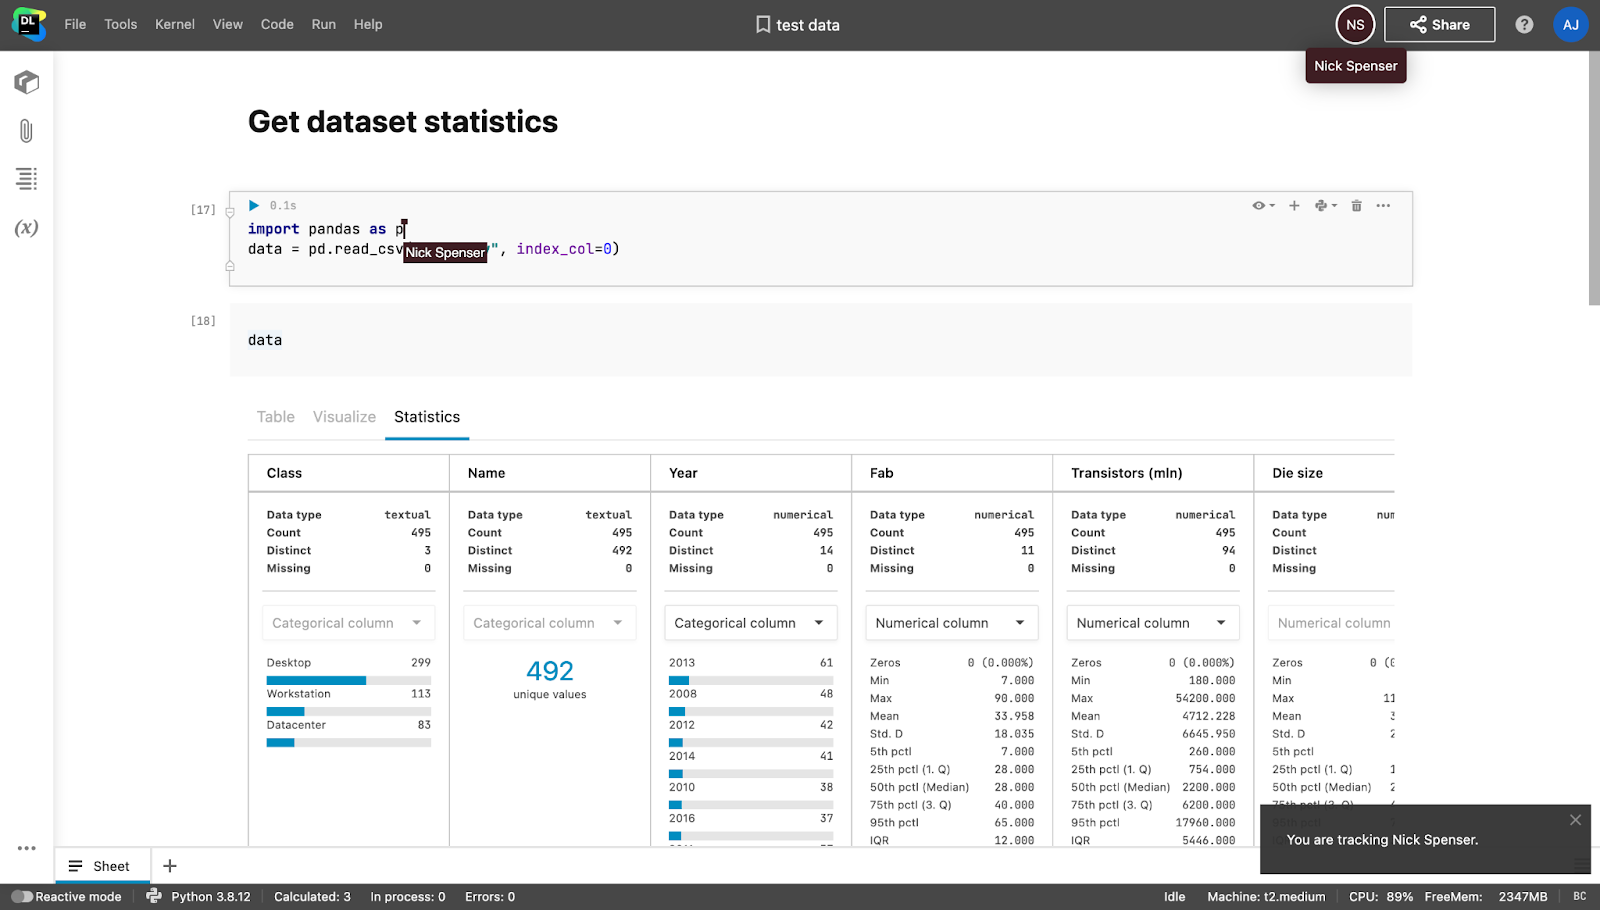
Tracking collaborator’s cursor
We truly believe that collaborative workflows can make data scientists’ daily routines more enjoyable. When working together on a notebook in real time, you can now navigate to a collaborator’s cursor and follow along by clicking on the collaborator’s account icon in the upper-right corner.
SQL cells and DB connections
Have you already tried connecting your database to Datalore and creating the first SQL cell? If you haven’t yet, you can get inspired by reading this blog post.
If you need support for a specific authentication option, please let us know on our forum.
And if you want to connect to a database located in a private VPC, please whitelist the IP address 63.33.83.29.
That’s all for now. Follow us on Twitter @Datalore to hear about our latest updates!
Happy analyzing!
The Datalore team


