

Datalore
Collaborative data science platform for teams
R vs. Python: Key Differences
Let’s understand the nature of R and Python! We’ll examine their purpose, features, and use cases. Read on to learn how to choose the right tool for your needs.
What Are Python and R?
Python and R are both open-source programming languages.
While Python has a more general purpose, R was created for specific tasks in statistical data analysis (for example, academic purposes). R and its packages provide you with enormous data visualization capabilities – your imagination is the only limit.
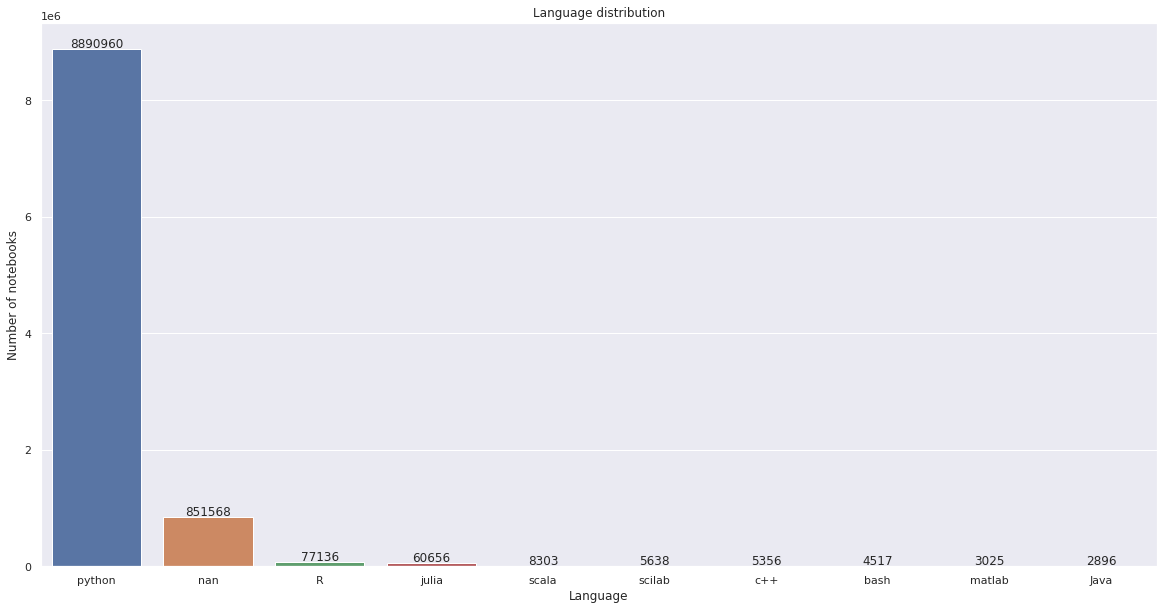
Python is by far the more popular language. According to JetBrains research on 10 million Jupyter Notebooks available publicly on Github in 2020, 8.9 million of the notebooks were written in Python, and only 77,000 were written in R.
Python and R: Key Differences
Here are some areas where R and Python have little in common.
Programming Style
Python is a dynamic, interpreted language (with no need for compiling), which enables easy coding and on-the-fly syntax checking. Python is a wrapper on C++, which is why it’s slower than other programming languages such as C++ itself, Golang, and others. Because of Global Interpreter Lock (GIL), there is a limitation on parallel programming without using any specific libraries. Python is more convenient for data analysis and prototyping for machine learning and data science. Python is also easy to read and master, while R has statistics-specific syntax.
R is a language for scientific programming, data analysis, and business analytics. Also, R supports many ways of visualizing data with numerous customization possibilities. R also supports a lot of statistical modeling tools such as modelr, Hmisc, and others.
R can’t be used in production code because of its focus on research, while Python, a general-purpose language, can be used both for prototyping and as a product itself. Python also runs faster than R, despite its GIL problems.
Data Visualization
Data visualization is a necessary step in reporting data analysis. R is well-prepared for visualizing data as graphs, and there are thousands of libraries for data visualization. Python doesn’t have many libraries for presenting data, but it’s still very efficient and convenient for data analysis tasks themselves. The most popular R libraries for data visualization are ggplot2, lattice, and dygraphs. The most popular visualization libraries for Python are matplotlib, seaborn, and plotly.

Libraries
R supports more than 12,000 data analysis libraries, which is why R is the first choice for data analysis tasks. Many of these libraries can also help you prepare the data analysis results in an easy and aesthetic way. Python also has an enormous number of data analysis libraries, but Python supports production libraries as well, enabling users to build apps.
What to Choose
Choosing the most suitable programming language – Python or R – really depends on your requirements. Let’s take a look at some of them.
Data Science
Both Python and R let you conduct data analysis and make predictions for data science tasks. However, if you plan to do research with reports, present your work results as applications, and use it in production, Python is a better choice. It is more convenient to create and train your models in Python libraries like pytorch and tensorflow. For R, there are a lot of libraries for ML, such as Mlr and Caret, so you can try them for prototyping models as well.
Research
If you need to conduct research, the choice is arguable. Python provides you with handy libraries for exploratory data analysis, such as pandas, and visualization can be done with plotly. However, it is useful only for general-purpose analysis. If you want to conduct statistical analysis with full reports, it is better to try R with its specific libraries, like as dplyr or esquisse.
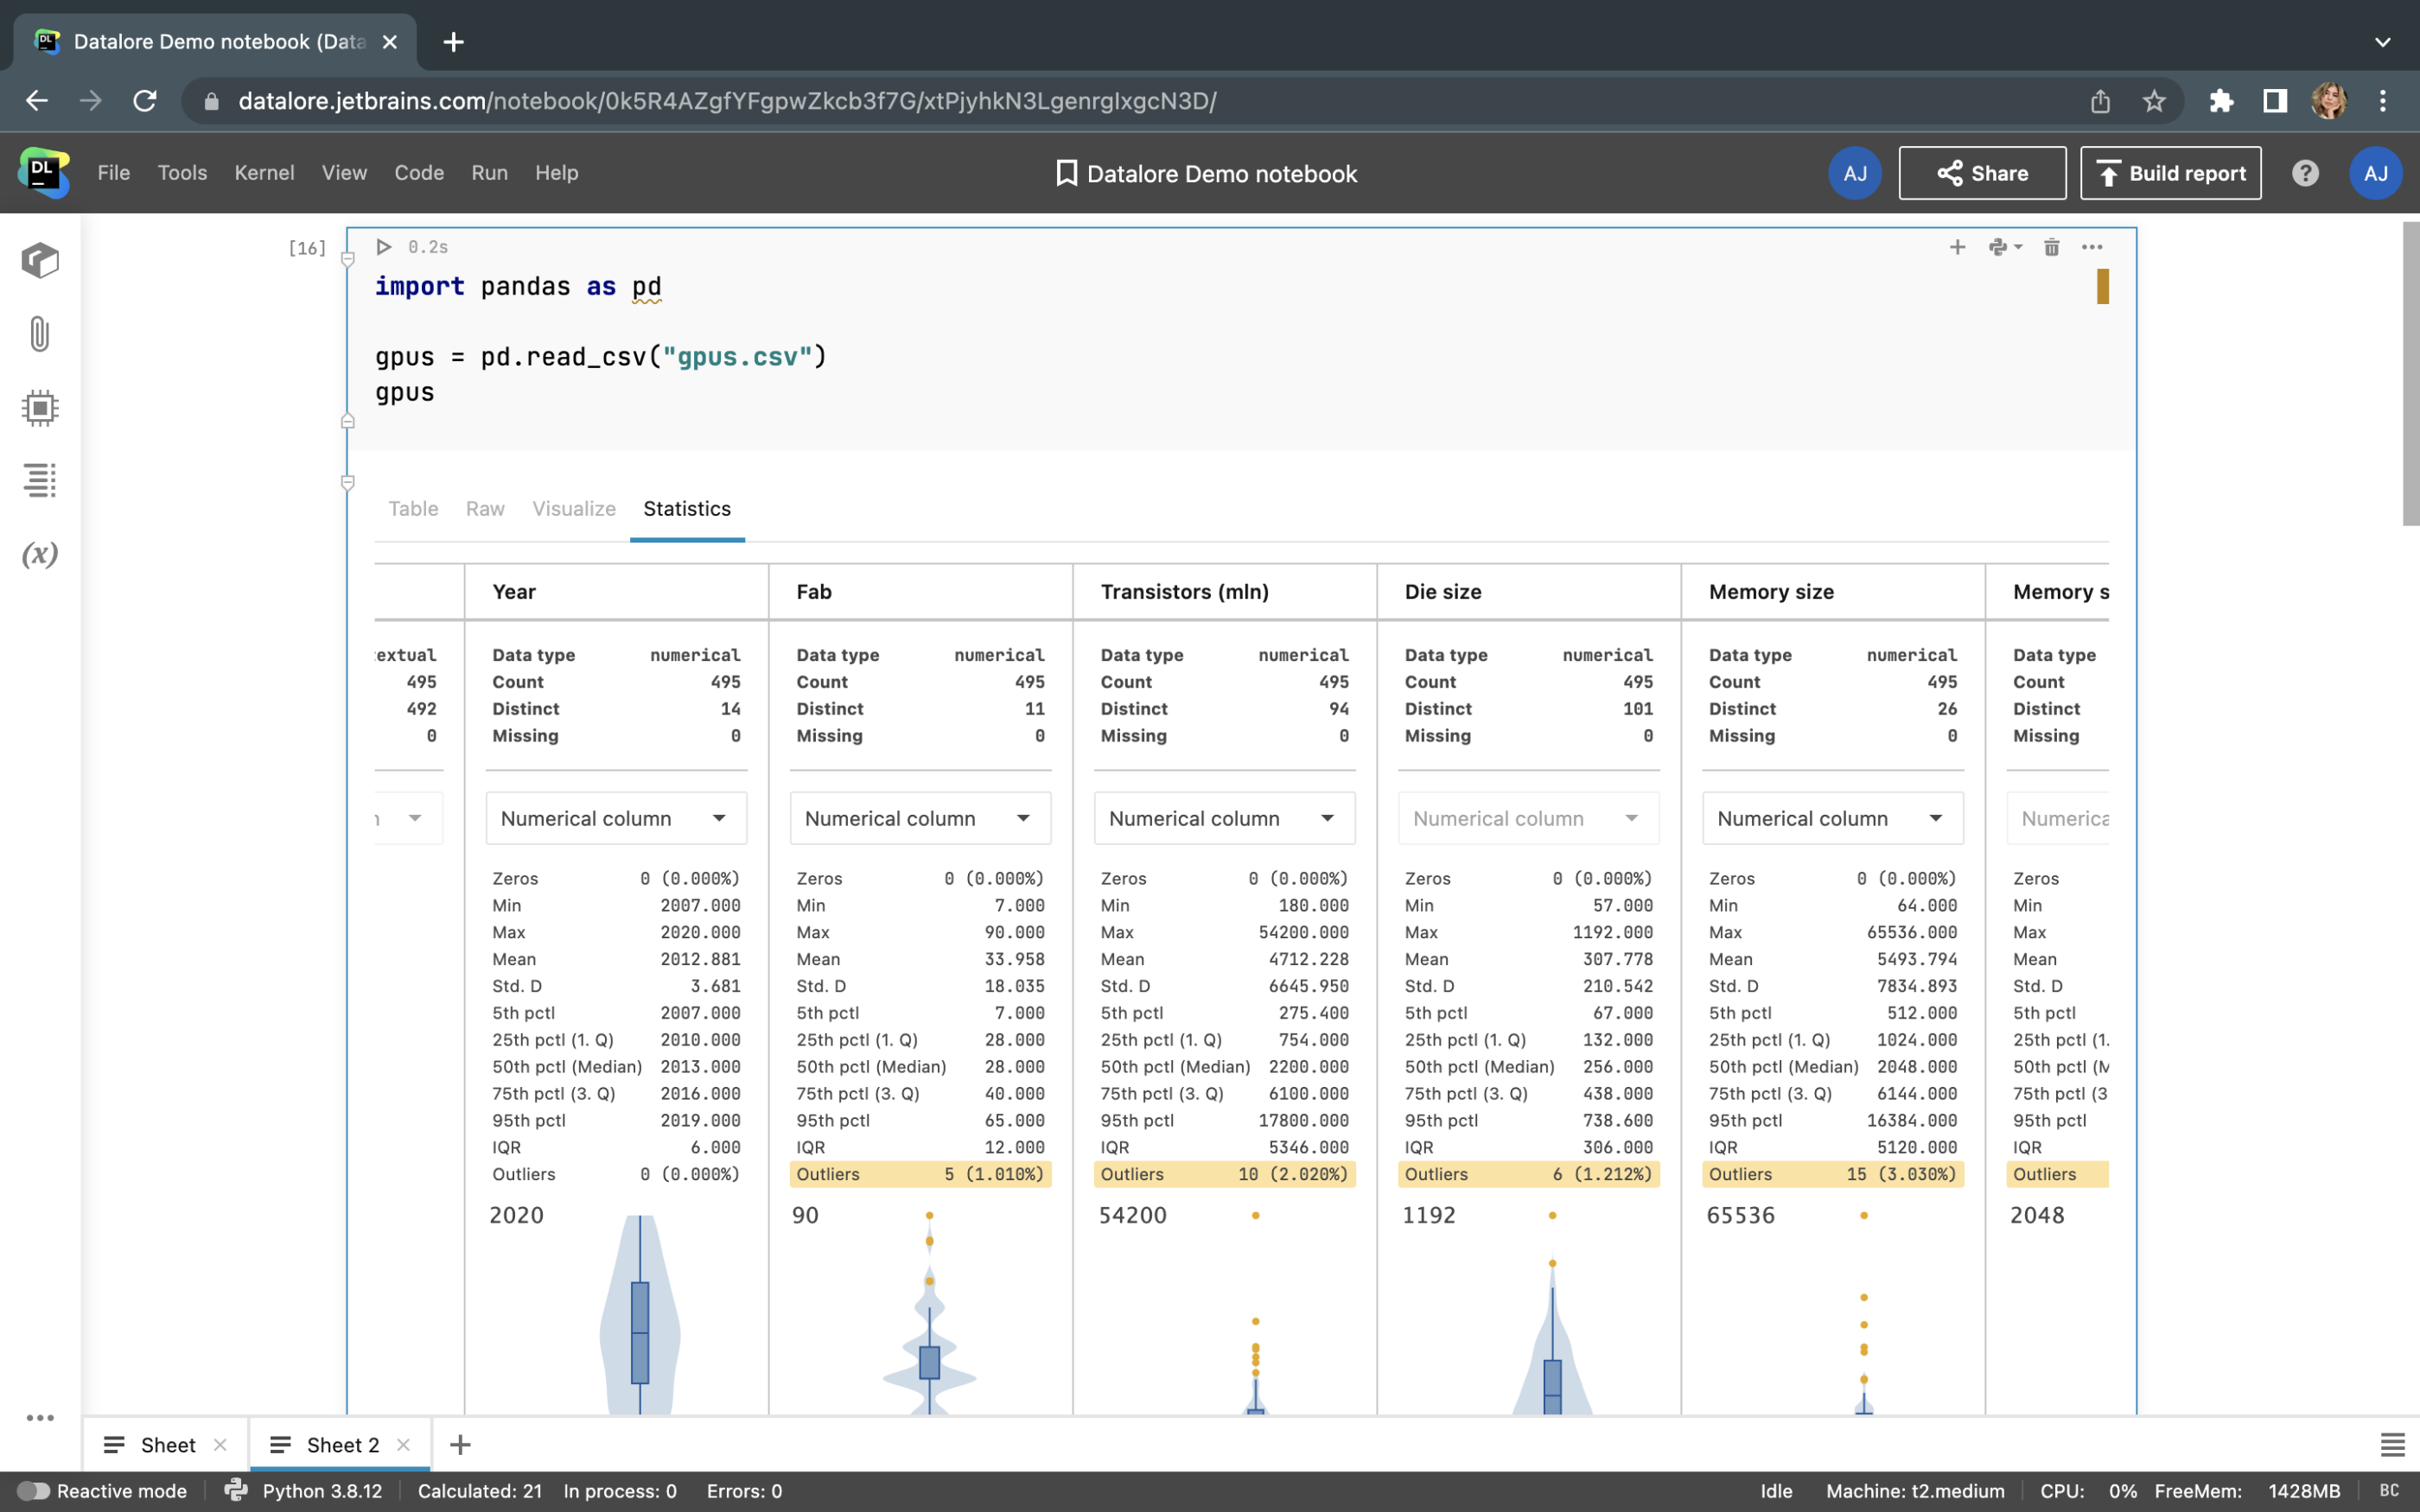
The Datalore team was inspired by the way R data analysis packages work and implemented out-of-the box statistics for Python datasets as well. Take a look at how you can get descriptive statistics with just one click!
Prototyping
As we mentioned before, R is more suitable for data analysis and is comprehensive for checking hypotheses and modeling. However, if you want to make a machine-learning model and try to observe how it works in your app, Python is the right choice. To create a simple app, these web-based frameworks can be used: django, flask, or fastapi.
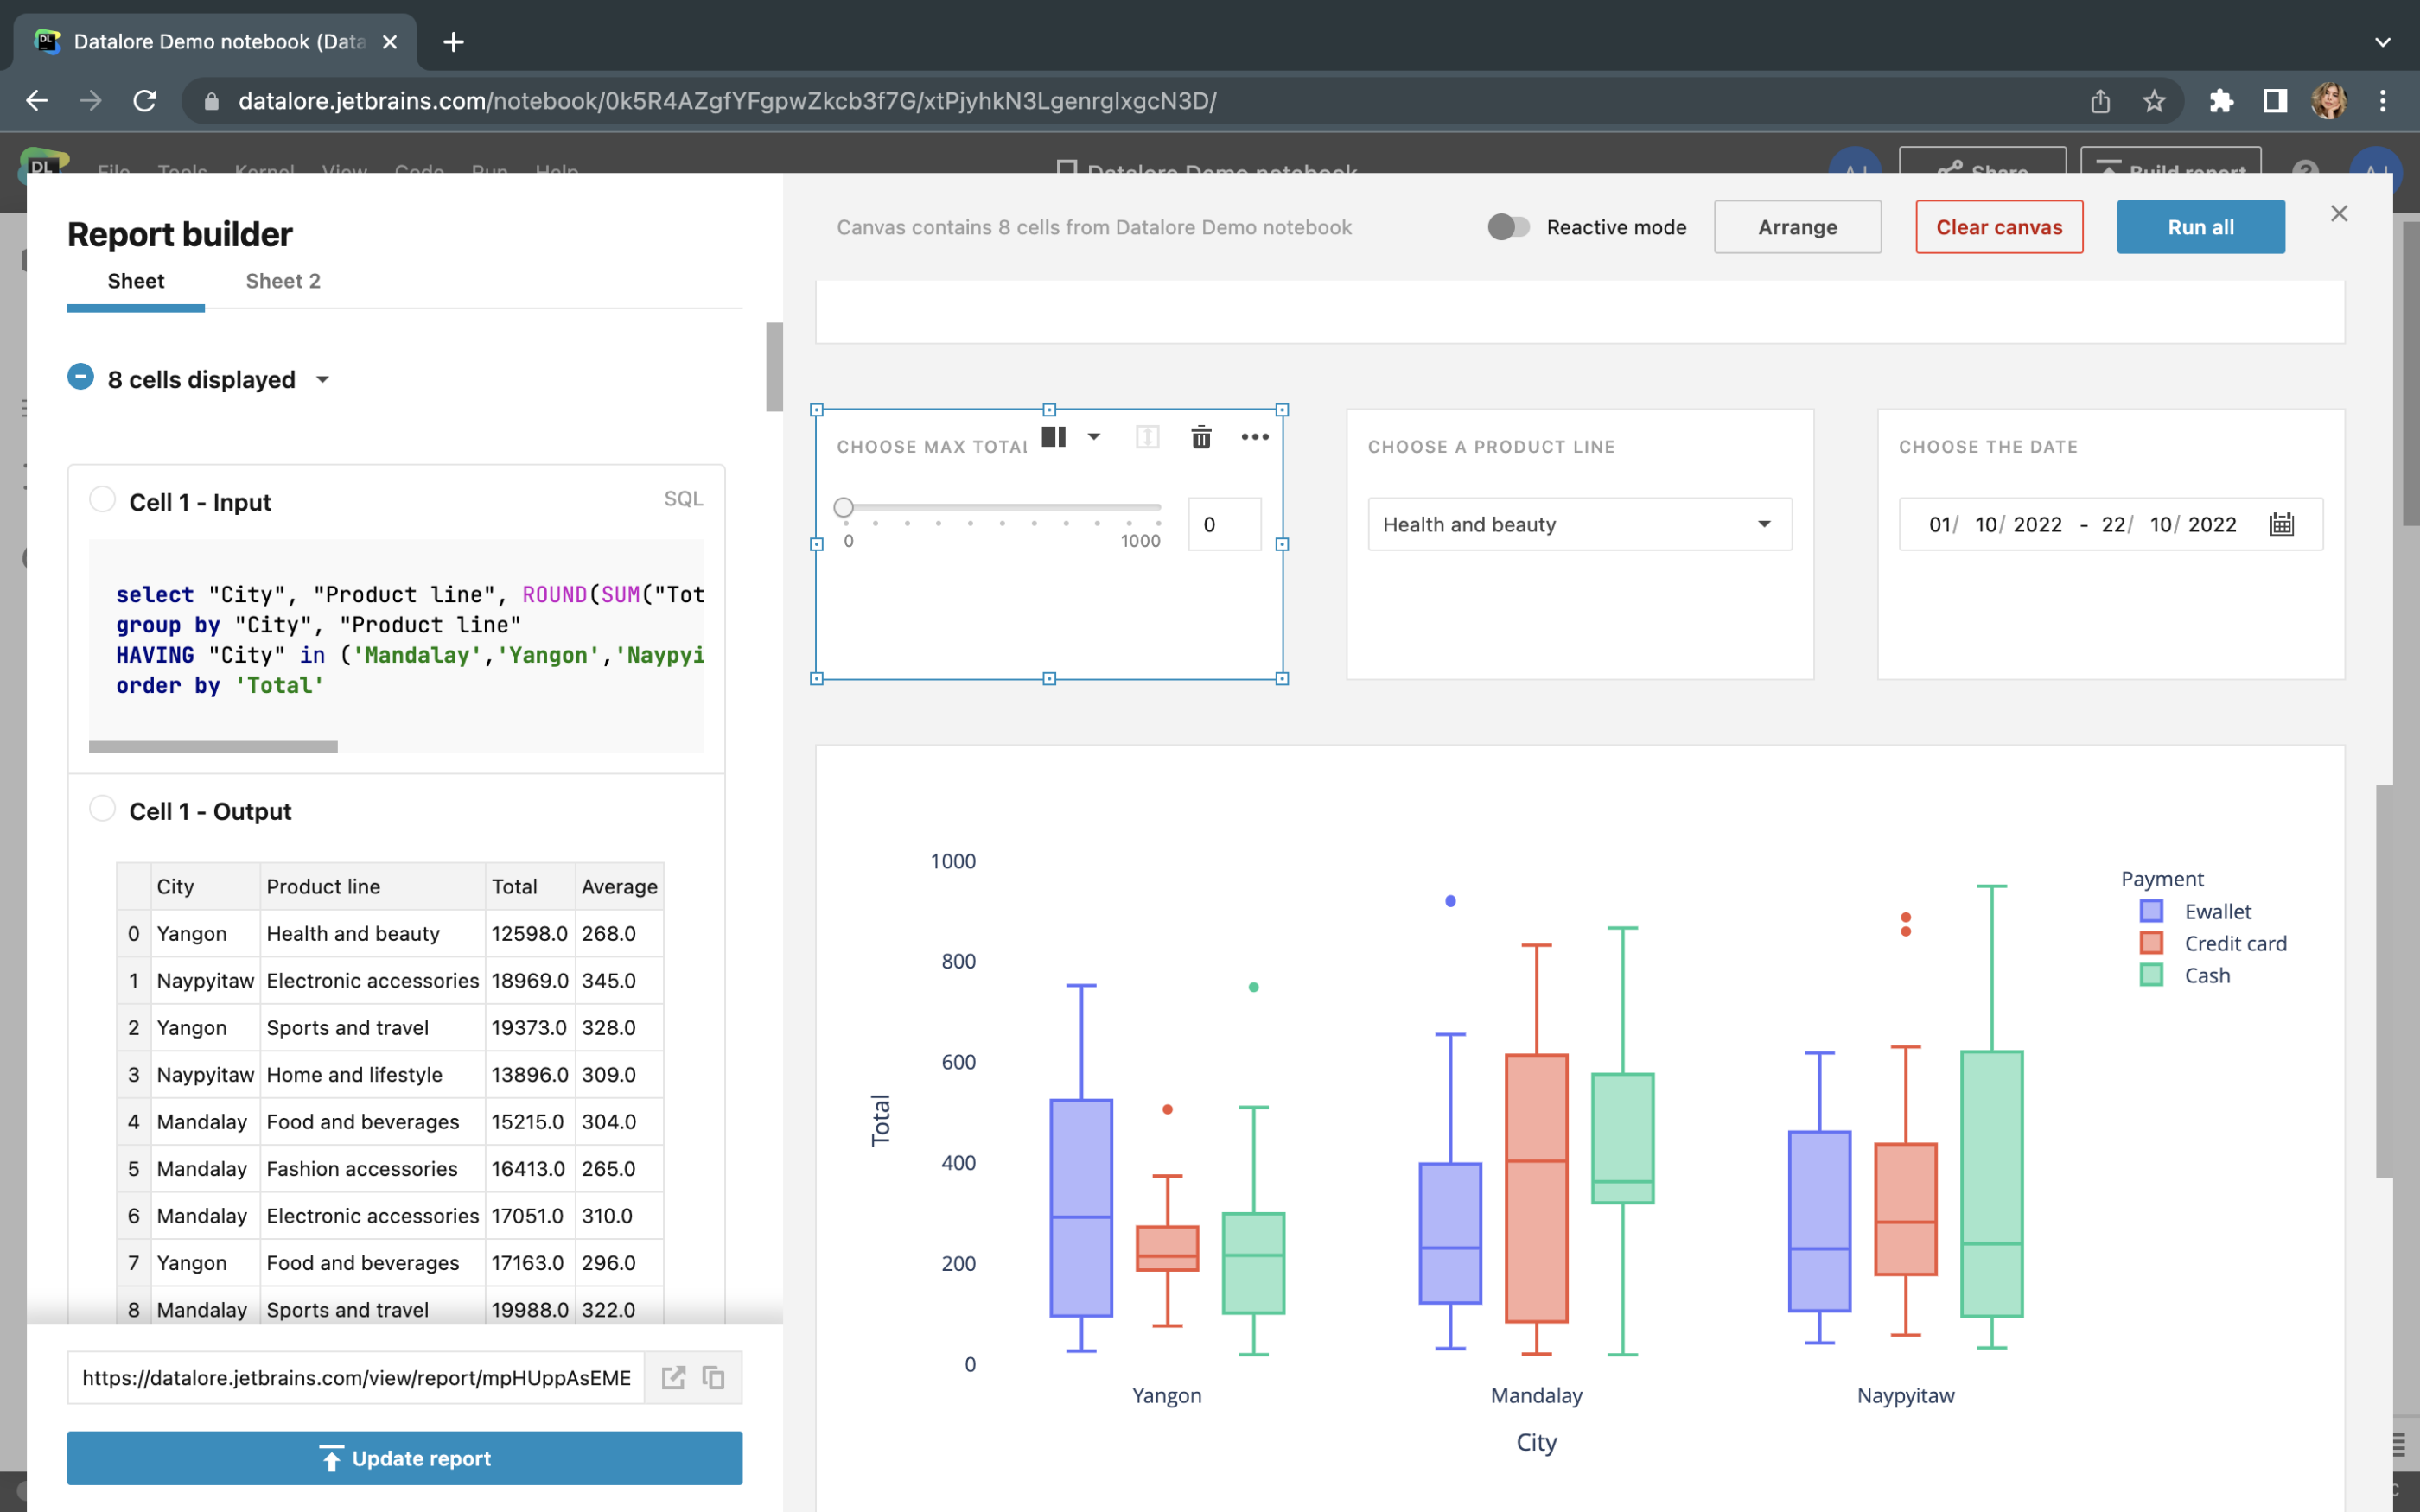
If you are just starting out in programming, Datalore can help you build apps from Python and R notebooks with a few clicks using the Report builder.
Conclusion
In this article, we introduced two popular programming languages for data analysis: Python and R. It looks like R is better for scientific and statistical programming, while Python is more suitable for wrapping your data analysis into production. In Datalore you can use both programming languages and it is easy to get started for free online with the Community plan.
Button: Try Datalore for free now


