.NET Tools
Essential productivity kit for .NET and game developers
How-To's

dotTrace 4.0 Puts On a Fine Performance
Front seats at the ballet: $200
Front seats at the ball game: $100
Quickly spotting bottlenecks in your .NET application: priceless
There are some performances money can buy. For everything else, there’s dotTrace 4.0 Performance.
Jokes aside, here’s what dotTrace 4.0 Performance, currently in Beta, brings to the table.
Support for:
- Visual Studio 2005, 2008, and 2010
- .NET Compact Framework 3.5
- .NET Framework 1.0 to 4.0
- Silverlight 4
New profiling modes:
- Remote profiling: connect to a remote machine to profile a standalone or web application, or a Windows service.

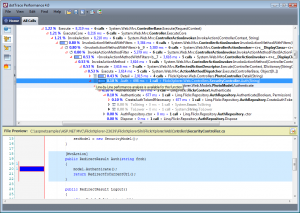
- Line-by-line profiling: view detailed timing information for every statement in methods that have source code available.

What-if scenarios:
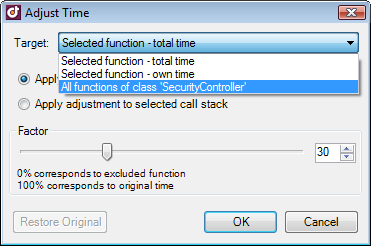
- Ever thought, “What if I optimize this function by 40%?”? Now dotTrace knows the answer! It can recalculate a snapshot without reprofiling your application, so you can instantly estimate potential performance gains.

New edition scheme:
- dotTrace 4.0 Performance comes in two editions: Standard and Professional. Standard Edition provides all the functionality that is available in Professional Edition, excluding support for .NET Compact Framework 3.5, Silverlight 4, and remote profiling.
Other goodies:
- Improved speed and accuracy in all modes, plus a ‘high accuracy’ flag to take into account the time spent inside the profiler.
- Extremely robust handling of huge snapshots (up to hundreds of GB!)
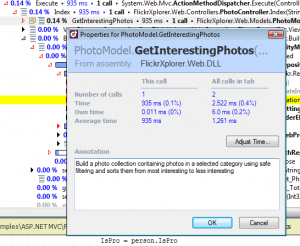
- Snapshot annotations:

Read more at What’s New.
Download a free 30-day trial of dotTrace 4.0 Performance Beta today.
More questions? Check out the updated dotTrace FAQ.
Prev post Introducing ReSharper 5.0: Call TrackingJetBrains to Launch dotCover EAP Next Week Next post
Subscribe to a monthly digest curated from the .NET Tools blog:


