.NET Tools
Essential productivity kit for .NET and game developers
Performance Optimizations in ReSharper 8.x

One of the most popular questions we’re facing as soon as we push a new release is whether it works faster than before.
ReSharper performance has a ton of dependencies related to hardware, Visual Studio configuration (including other installed extensions as well as native VS components like XAML Designer) and ReSharper’s own configuration. Nevertheless, the team always finds ways to improve the product’s performance. This is an ongoing process across all our releases, and 8.x is no exception.
Let’s take a look at where exactly ReSharper 8.x became faster: overall UI responsiveness, coding assistance, code analysis, and unit testing. No mile-length lists*, just highlights.
*For those who are interested in statistics, it’s 170+ improvements (and growing).
Coding Assistance
When the auto-completion pop-up takes seconds to appear, I get the urge to smash the monitor or throw my keyboard across the room. Can you blame me? Well, since the coding assistance improvements in ReSharper 8.x I’ve gotten way more peaceful, and hopefully you will too.
- Lower Impact on Typing
All phases of code completion have become interruptible. What does this mean for you? Typing should be much smoother now as it doesn’t interfere with coding assistance. - Faster Displaying of Lookup Items in Pop-Ups
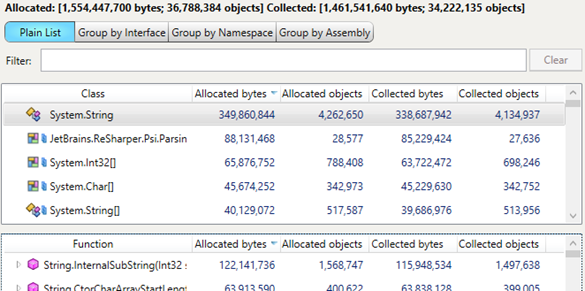
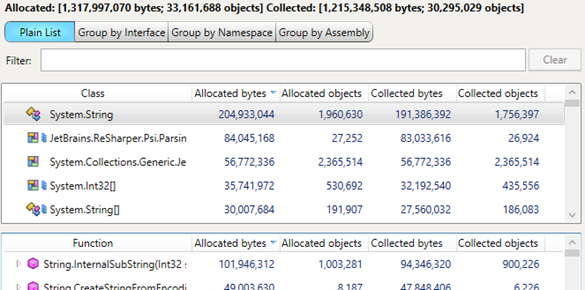
Now we cache all lookup items in Intellisense, meaning it works faster on the second run and all subsequent ones. For example, here are two call stacks taken with dotTrace for ReSharper 7 and ReSharper 8 correspondingly. Both reflect the second run of an auto-completion pop-up showing a list of graphic files available for selection within the project.
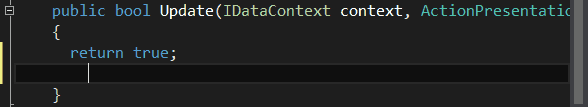
VS 2012 with ReSharper 7

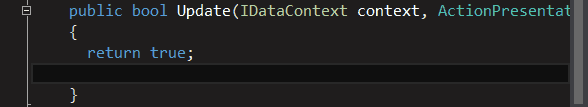
VS 2012 with ReSharper 8
 Thanks to caching introduced in ReSharper 8, the method that gets the results completes 16 times faster.
We’ve also fixed many other small assistance issues, like hangups during smart completion in VB, lags when erasing long symbol sequences, and more. Though most are minor, when taken together they result in a tangible performance improvement.
Code Analysis
Code analysis is also an area we consider to be crucial from the performance perspective. Even though solution-wide analysis is carried out in the background, poor performance here can lead to noticeable lags in Visual Studio. That’s why we’ve made some tweaks in this area.
- Optimized Solution-Wide Analysis
Solution-wide error analysis (SWEA) now utilizes the CPU much more efficiently. As a result, SWEA is finished a little bit faster, especially on complex solutions. What is more important, solution-wide analysis has a lower impact on the UI, thus improving its responsiveness.
On the screencasts below, you can see how typing performs in ReSharper 7 and 8 at the same stage of solution-wide analysis.
VS 2012 with ReSharper 7
VS 2012 with ReSharper 8
Overall UI Responsiveness
Many of you complained about lags in the user interface when performing some ordinary actions in the UI: lags during code editing, slow loading of context menus, slow auto-completion on JavaScript, and others.
It’s no secret that most of these problems are related to numerous tasks that ReSharper is doing in the background. These background tasks became our main target for optimization in 8.x releases.
- Faster Solution Building / Loading
We’re constantly working to reduce ReSharper’s impact on the performance of Visual Studio’s native features. As our tests show, Visual Studio with ReSharper 8.x builds a solution up to two times faster than Visual Studio with ReSharper 7. Moreover, VS with ReSharper 8.x loads a solution nearly 20% faster. - Faster Caching
ReSharper loads its caches much faster now. Among many improvements here, we optimized the way ReSharper works with its database that stores caches. The database (and your hard drive) is now accessed far less frequently.
As a result, there are no lags when typing while the caches are being loaded. Exact numbers are difficult to evaluate as they are highly dependent on solution complexity. - Optimized Memory Usage
We did our best to minimize memory traffic in main ReSharper usage scenarios. This should significantly lower the number of cases when Visual Studio UI hangs for a moment and then continues working. For example, consider such a common operation as Find Usages.
The diagrams below show memory traffic (for ReSharper 7 and 8 correspondingly) when searching for all string usages in a large project.
VS 2012 with ReSharper 7
VS 2012 with ReSharper 8
As you can see, the traffic in ReSharper 8 has dropped 15%. As we said before, large memory traffic causes excessive Garbage Collections which, in turn, lead to UI freezes (true for GCs longer than 200 ms). If you want to know how we fight such bottlenecks, it’s a combination of the Timeline view* in dotTrace and a new dotMemory tool (yep, we’re strong dogfooding followers). Timeline in dotTrace allows detecting all UI freezes (yellow stripes on the timeline diagram show Blocking GC) while dotMemory lets us determine exact objects that cause the traffic.* (This view will be available in the upcoming dotTrace 6.0.)
The snapshot was taken when typing during solution-wide analysis.
Unit testing
The unit testing subsystem was also redesigned for ReSharper 8 to eliminate the key annoying lag that users complained about in ReSharper 7.
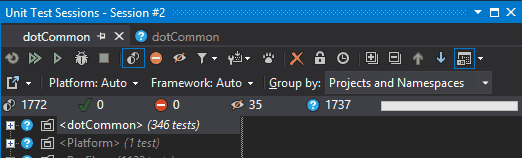
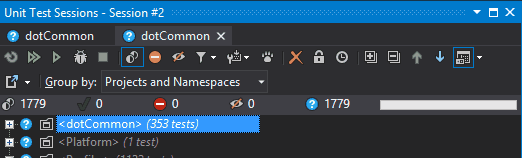
- Faster Start of Unit Tests
We’ve entirely reworked the way ReSharper runs tests. ReSharper 7 took a lot of time (whole seconds) before the tests were actually run. In ReSharper 8.x, it’s no longer a problem: tests are run almost instantly.
VS 2012 with ReSharper 7
VS 2012 with ReSharper 8
Your Help is Invaluable in Improving ReSharper’s Performance
Of course, we would never be able to find all these issues without the ReSharper community. Yes, we mean you, our valued customers and fans!
The main problem when fighting performance issues is that they are very hard to test and reproduce. The thing is, they are very sensitive to the environment: the complexity of your solution, installed Visual Studio plugins or NuGet packages, system components, and other factors. For obvious reasons, we are unable to test ReSharper on all possible environment combinations. And that’s where you can help us tremendously.
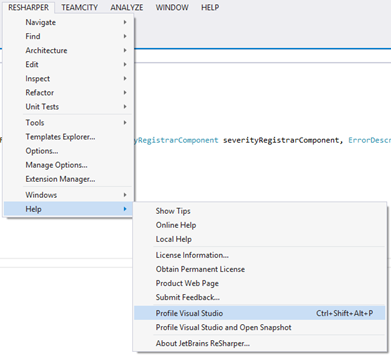
If you suspect ReSharper may be slowing down your work in Visual Studio, follow these steps to make sure that ReSharper is indeed the culprit. If it is, run the built-in dotTrace profiler (go to ReSharper | Help | Profile Visual Studio), profile Visual Studio and send a performance snapshot our way. We will look at your performance snapshot, locate the bottleneck and do our best to fix it.
As outlined above, we made a lot of performance optimizations to bring you the improved ReSharper 8.x. But of course we’re not stopping there. For ReSharper 9, we plan to do a lot more work in terms of improving performance. Stay tuned!

Subscribe to a monthly digest curated from the .NET Tools blog: