

.NET Tools
Essential productivity kit for .NET and game developers
dotMemory 4.0 out, dotTrace on sale

You’ve waited for this long enough! As of today, our profilers dotTrace Memory and dotTrace Performance assume new identities. Previously known as dotTrace Memory profiler, dotMemory is the newest product to rejoin the JetBrains .NET tools family. The decision to separate renewed memory profiler was natural since dotMemory was reworked from the scratch and re-invented even in analysis concept.
We are thrilled to announce the release of dotMemory 4.0, our smart and reliable .NET memory profiler.
At the same time, dotTrace Performance, now known as simply dotTrace, is on SALE. That’s right, our dotTrace .NET performance profiler can be yours for up to 58% OFF (commercial licenses) or up to 33% OFF (personal licenses). Profiling has never been this affordable. For more pricing details please check the dotTrace website.
So, back to dotMemory 4.0: it introduces a unique memory analysis concept. We believe that complicated and deeply intellectual memory usage analysis can be a fascinating and everyday activity. With dotMemory you start from all objects in memory and narrow to smaller object sets until the memory issue is solved. Just let dotMemory’s powerful functionality, multiple views on data and intuitive UI guide you through the journey.
Let’s have a closer look at key dotMemory features:
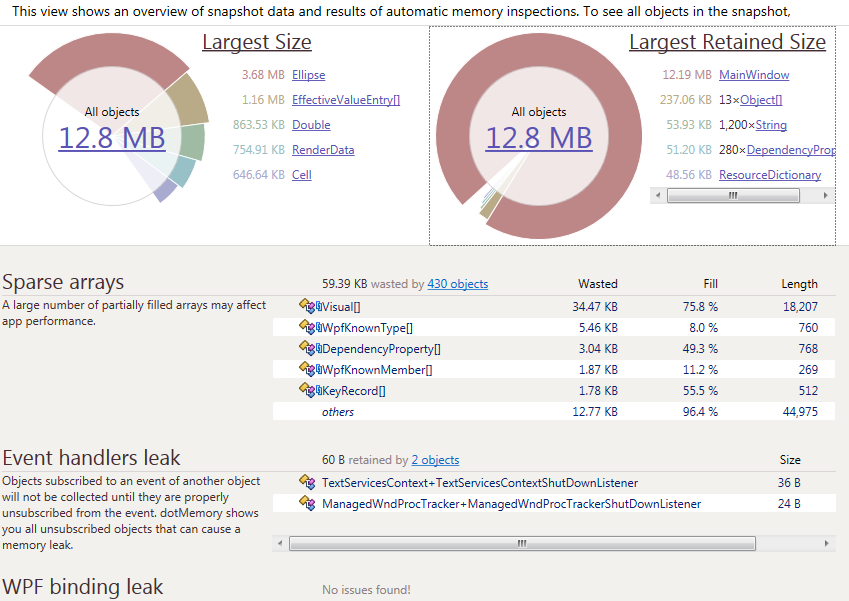
Powerful automatic inspections to instantly detect common types of memory leaks.
To ease your task, dotMemory automatically scans your snapshot for the most common types of memory issues. These inspections can be a great starting point in analyzing a snapshot if you’re not sure where to begin.
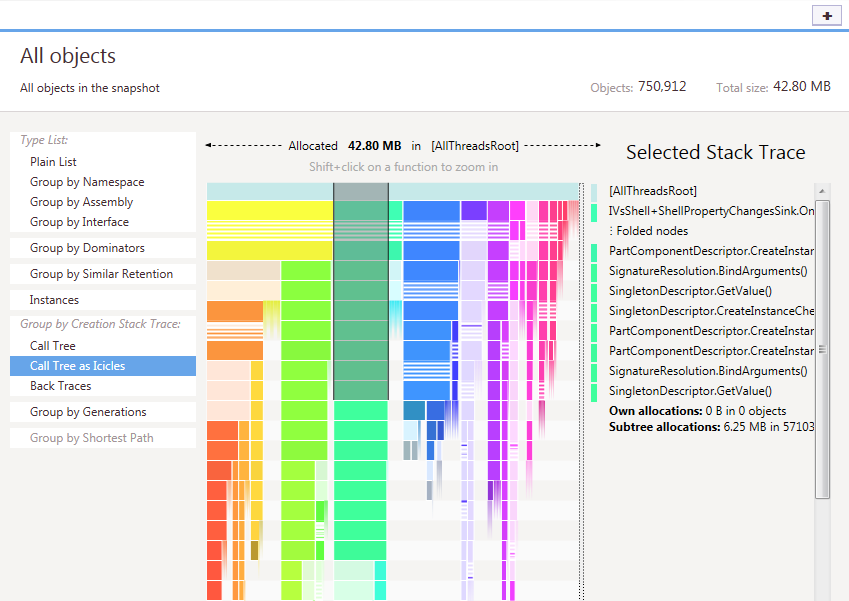
Multiple views on data are great for detailed analysis of memory usage issues.
Examine objects in the heap from multiple views. Want to know how objects relate to each other? What objects do they reference and through what fields? Which calls created these objects? No problem! dotMemory has a view for nearly everything. For example, you can group instances by dominating object sets or by similar retention paths. Other innovative views include the icicle chart to visualize the call tree.
Memory traffic analysis to detect what causes excessive garbage collection.
Excessive allocations and garbage collections may imply significant memory management overhead. Use the traffic view to understand what objects are created/collected most intensively in your app and what functions are causing this memory traffic.
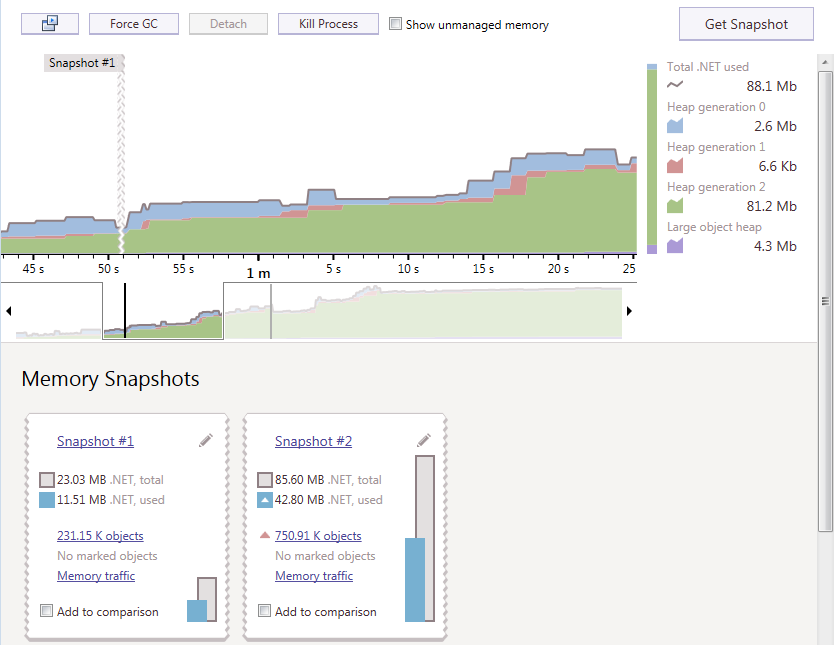
Comparing memory snapshots to visualize improvements or regressions in memory usage.
Comparing two snapshots is the main way to find objects that are causing a memory leak. Use the comparison view to find out how many objects were created between snapshots and how many objects were collected.
Timeline view with real-time data collection
To monitor memory consumed by your application, get snapshots and drop them to compare in one click.
Remote profiling — detect memory issues in running production environments.
Profile apps not only on your local computer but on any computer in your network or on the Internet. Remote profiling is especially helpful when you need to profile a web app on a production server.
A Profiling API lets you invoke the profiler from exact code positions in your applications.
Picking the right moment to get a snapshot is very important for memory analysis. Use the dotMemory API calls to take snapshots at exact places of your code.
Support for various .NET applications
Profile apps based on .NET Framework 2.0 to 4.5.1 including desktop, Silverlight 4, Silverlight 5, Windows Store, WCF, and IIS applications.
Visual Studio integration
dotMemory integrates with Visual Studio so you can start a memory profiling session right from the IDE, whenever you need.
To get to know dotMemory 4 better and explore getting-started hints, please visit Docs&Demos webpage.
dotMemory is available in different license types: commercial, personal, open source, and more. A new commercial license is priced at $249, and upgrades are just $79. If you purchased a dotTrace Memory license after January 1, 2012, you are welcome to upgrade your memory profiler for free. If not, we encourage you to take advantage of our low upgrade prices. All licenses include 1-year subscription for updates. Additional options and licenses details are available on the dotMemory website.
Download dotMemory 4.0 today and enjoy the new memory profiler. If you would like to first try it, a free 10-day evaluation license is available.
Profile with pleasure!
JetBrains dotMemory team


