.NET Tools
Essential productivity kit for .NET and game developers
dotPeek 1.2 EAP: Introducing Process Explorer
Have you ever wanted to dig deeper into a process running on your machine? We have. That’s the reason why the new dotPeek 1.2 EAP build introduces Process Explorer.
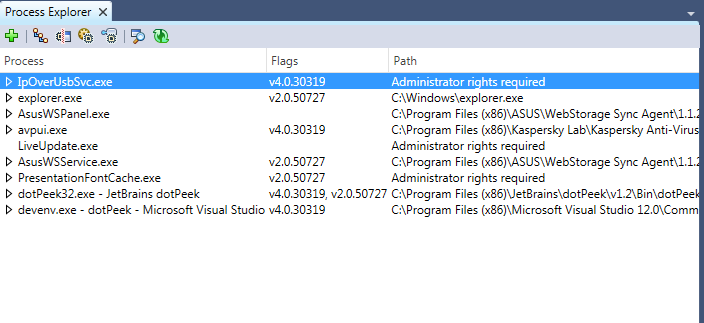
The Process Explorer window provides you with the list of all currently running processes and allows decompiling those of them that are .NET processes. Once you locate a process to decompile, you can add it to Assembly Explorer for further investigation by clicking the “+” button. From there, you can export decompiled code to a Visual Studio project if necessary.

You can see native processes in this window as well although you naturally shouldn’t expect dotPeek to be able to decompile them. To display native processes, click Show Native Processes in the Process Explorer toolbar.
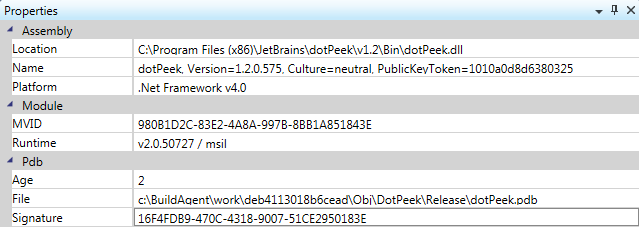
To display additional details about a process, for instance the .NET framework version used or MVID (which can be useful to double check that you are going to debug the right application), press F4, which should bring up a tool window displaying process properties.

In case you’ve missed it, note that dotPeek 1.2 EAP can now work as a symbol server and supply Visual Studio debugger with the information required to debug assembly code. Download dotPeek 1.2 EAP and give it a try!
Subscribe to a monthly digest curated from the .NET Tools blog:


