

.NET Tools
Essential productivity kit for .NET and game developers
Analyzing slow HTTP requests with dotTrace

Modern applications are becoming more complex and use an increasing number of subsystems such as databases, web services, third-party frameworks, and so on. When your application suddenly starts performing slower, it’s not always easy to understand which subsystem is to blame. This is when profiling can come to your rescue, and even then it may be tricky. Imagine that the calls in your application are evenly distributed among multiple subsystems. If your profiler doesn’t aggregate calls by particular subsystems, finding a performance flaw will become a headache. That’s why we always say that the more performance aspects and subsystems your profiler supports, the better.
A while ago we introduced support for analyzing SQL queries in dotTrace 6.1. Now the time has come for the next data filter: dotTrace 6.2 supports filtering out HTTP requests. When analyzing a snapshot, you can get the exact data on how a particular HTTP request is processed. For example, to process a request, a web application may access databases, communicate with a number of external resources via their APIs, process data, and so on. Performance flaws at any of these steps may result in a slow overall response of your application. The Incoming HTTP Requests filter will help you determine the exact cause and find the methods that run slowly.
Important notes:
- HTTP requests can be profiled only in the Timeline profiling mode.
- Only incoming HTTP requests are shown. More specifically, Timeline Viewer filters out time intervals between a server receiving a request and sending a response.
Let’s take a more detailed look at how this works.
Let’s say, we’ve updated a web application and now it works slower than before. Our workflow is pretty straightforward: we use Timeline profiling to reproduce the slowdown and take a snapshot, and then we open the collected snapshot in Timeline Viewer.
If we use dotTrace 6.2, we see that Interval Filters now has a new filter, Incoming HTTP Requests:
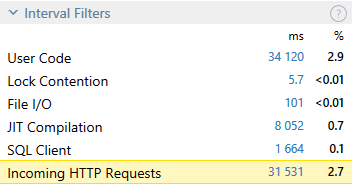
In our example, the application processes HTTP requests for a long 31 seconds. Let’s turn on the Incoming HTTP Requests filter to see what’s happening:
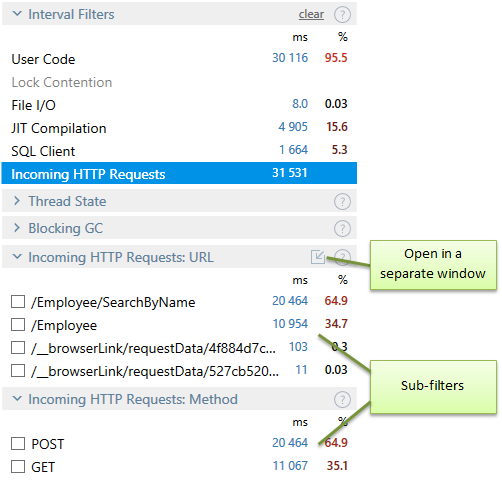
After we turn on the Incoming HTTP Requests filter, two more sub-filters appear: URL and Method. The URL sub-filter shows the time distribution between requests to particular URLs. The Method sub-filter allows us to understand how the request times are distributed among particular HTTP methods.
If the URLs do not fit the URL filter area, consider opening them in a separate Incoming HTTP Requests window.
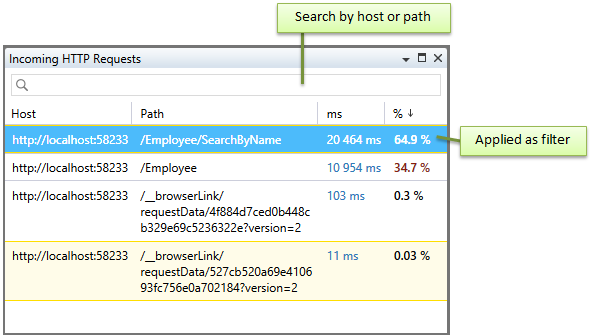
As we can see, our application spent most of the time processing requests to the URL /Employee/SearchByName. To find out what exact methods were called, we should apply the filter by this URL. Double-click on the URL, and now all other filters show data only for the time intervals where the request to /Employee/SearchByName was processed.
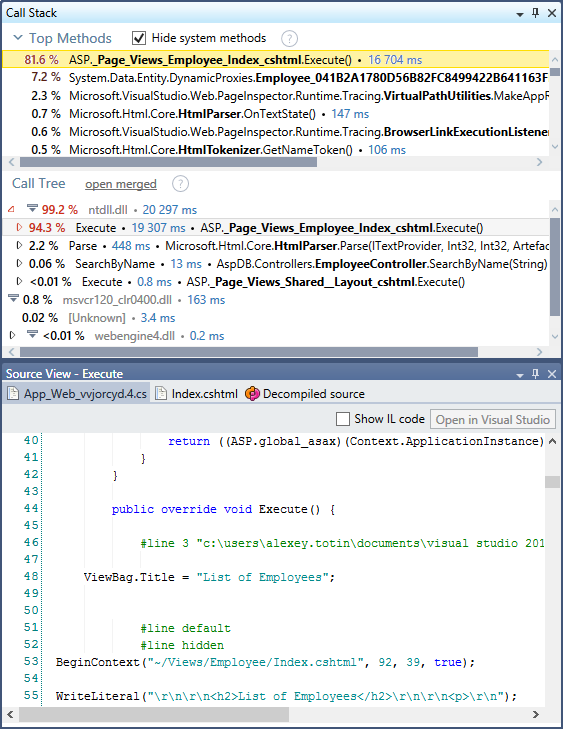
The Call Stack | Top Methods window shows that most of the processing time was spent in a single method:
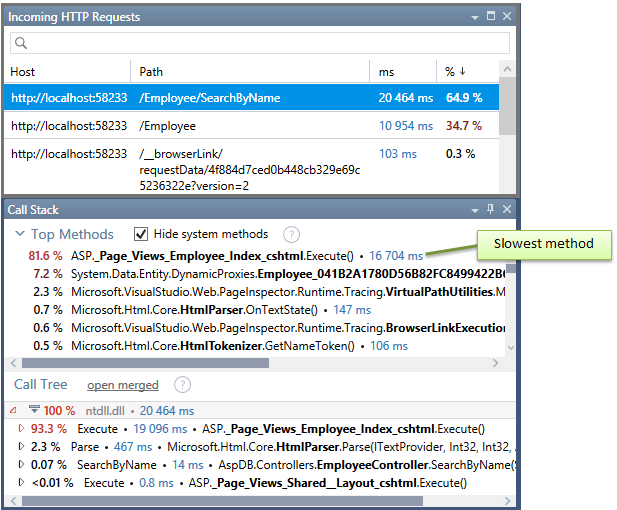
We click on this method to take a look at its source code in the Source View window. In our case, the web application spends most of the time in the ASP-generated Execute() method for the index page. This lets us assume that the application probably lags because of the large amount of data it has to display, and limiting the number of entries in a page can contribute to solving the problem.
We hope you find this new feature useful when developing and maintaining web applications. To try it on your own, download dotTrace 6.2 or later.


