.NET Tools
Essential productivity kit for .NET and game developers
Navigating to Source Code from dotMemory
We always look for ways to increase the value of ReSharper Ultimate and synergize our .NET tools. For example, in ReSharper Ultimate 9.2, we made it possible to profile ReSharper’s run configurations, so if you have both dotTrace and ReSharper you can even profile individual static methods in your project.
Now the time has come for dotMemory to get its portion of ReSharper’s functionality. dotMemory always lacked the ability to examine the source code of the profiled application. Just imagine how easier life would get if you could seamlessly continue the investigation of a suspicious object (one that may cause a leak) by examining its source code. Well, starting with dotMemory 10 and ReSharper Ultimate 10, you can!
To navigate to the source code from dotMemory
- In Visual Studio, open the solution that you have a memory snapshot for.
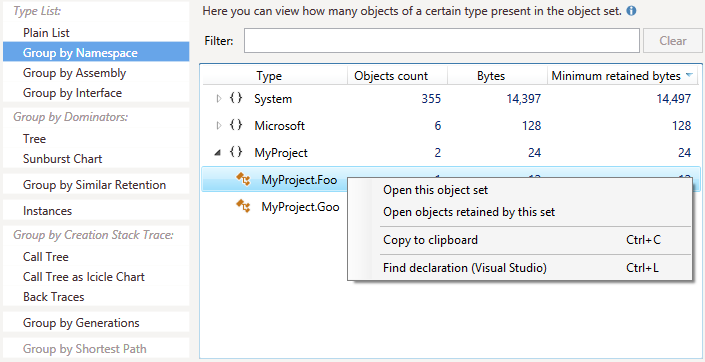
- In dotMemory, in any view that displays object types, right-click the type you’re interested in.

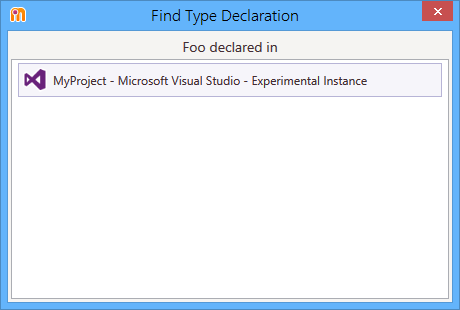
- In the context menu, select Find declaration (Visual Studio)*. This will open the Find Type Declaration window that lists all found type declarations in running Visual Studio instances.
* As an alternative to steps 2 and 3, select a type and press Ctrl+L.

- Click on the found declaration to navigate to it in Visual Studio.

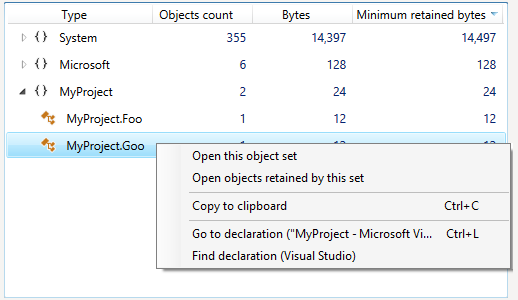
After you navigate to any type declaration at least once, the context menu will offer an additional item, Go to declaration (<solution_name>) (also available via the Ctrl+L shortcut). Selecting it instantly navigates you to the type declaration in a specific solution, bypassing the Find Type Declaration window.

To see for yourself how the feature works, download the latest dotMemory or ReSharper Ultimate. If you have any comments or questions, please feel free to ask in the comments to this post. Your feedback is greatly appreciated!


