

.NET Tools
Essential productivity kit for .NET and game developers
Analyzing native memory allocation with dotTrace 2016.3

With C#, we live in a comfortable managed world where everything is controlled by CLR. But sometimes, whether we like it or not, we have to work with ‘unmanaged’ objects, for example when we want to use some third-party DLL, a COM component, or a resource required for interoperability with the operating system (like a bitmap).
dotTrace 2016.2 and earlier had no way of showing you how your application worked with unmanaged memory. Version 2016.3 introduced a new event type you can analyze – Native Memory Allocation. It can be very helpful with all kinds of issues related to native memory: potential memory leaks, issues with unmanaged components used by your managed code, and more.
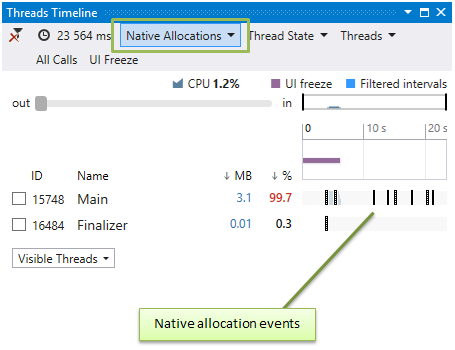
The Native Memory Allocation filter simply shows all events where allocations to the native heap occur. Note that dotTrace currently shows you only allocations of native objects that were not de-allocated by the time you took the snapshot. Thus, unfortunately, at the current stage you cannot use this filter to analyze excessive native memory allocations (native memory traffic).
A couple of notes before we take a look at how it works:
- You must have Windows Performance Toolkit installed on your machine.
- dotTrace collects native allocation data only in the Timeline profiling mode.
How to use it
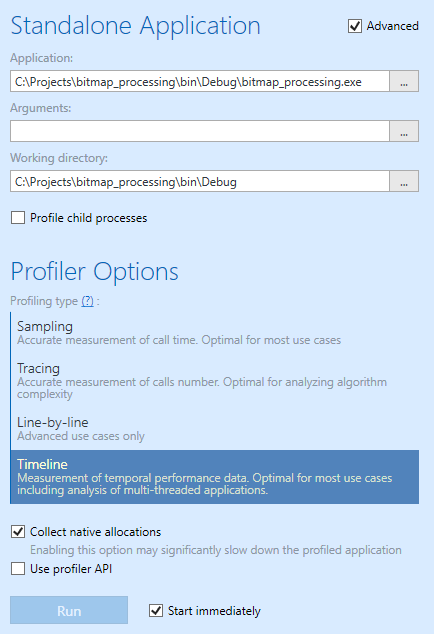
- First of all, when starting a profiling session, don’t forget to enable Collect native allocations in Advanced profiling options. (The option is disabled by default as it is a resource-consuming operation.)
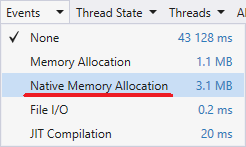
- When you open a profiling snapshot in the viewer, select Native Memory Allocations in the Events list:
- Like nearly everything in dotTrace, Native Memory Allocation works as a filter. To identify calls that are responsible for native memory allocation, perform these two steps:
- Select the Native Memory Allocation event. Calls in the Methods window are now sorted by the size of native memory they allocate.
- Select a particular method and press Enter to navigate to its code.
We hope you find this feature useful. To try it on your own, download ReSharper Ultimate 2016.3.


