

.NET Tools
Essential productivity kit for .NET and game developers
Exploring exception stack traces with ReSharper and Rider

We have all experienced bugs that throw exceptions in our applications. Using ASP.NET and getting a “yellow screen of death” (YSOD) with an exception message and stack trace? Using .NET Core and seeing stack traces printed to log files?
With ReSharper and Rider, we can explore and navigate stack traces from these exceptions better within the IDE. Let’s take a look at using the Stack Trace Explorer!
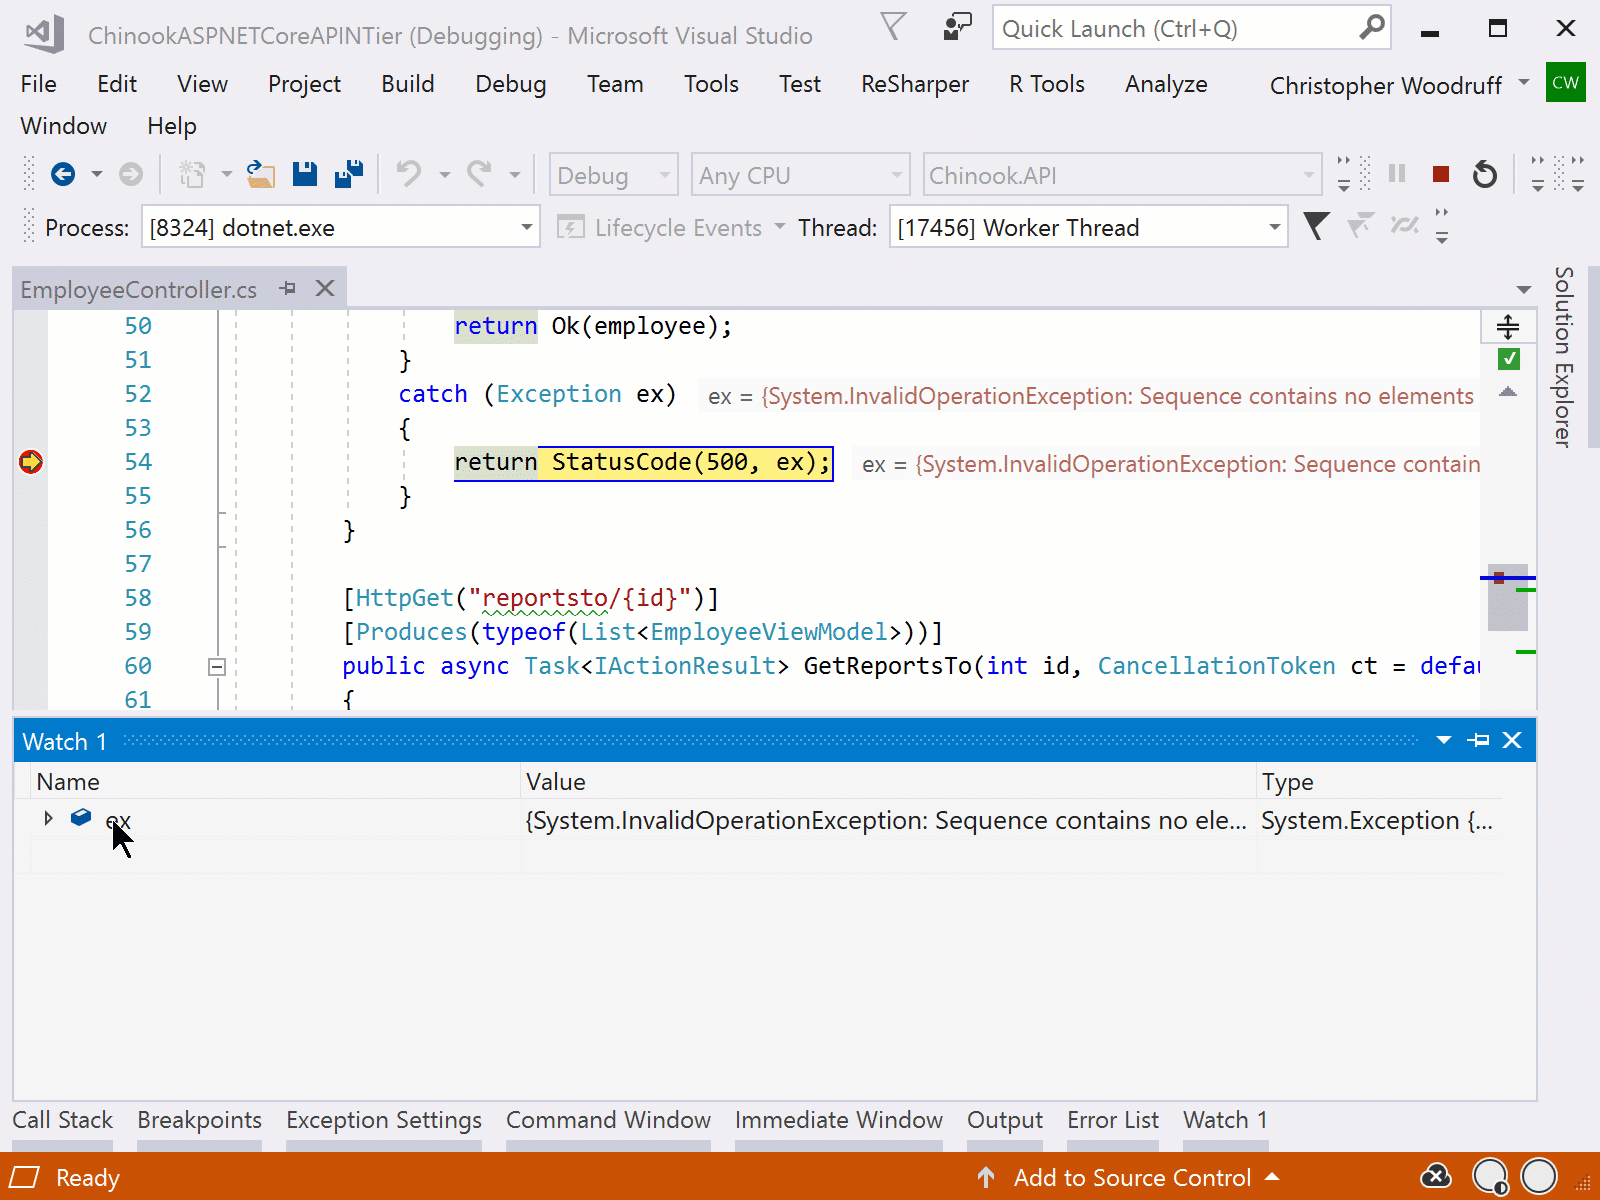
The experience for working with Stack Trace Explorer to examine an exception stack trace is very similar in ReSharper and Rider. If you want to work with the explorer window in Visual Studio with ReSharper, you can use the ReSharper | Tools | Browse Stack Trace… menu or the Ctrl+E, T shortcut (Visual Studio keyboard scheme).
When an exception stack trace is found on the clipboard, Stack Trace Explorer will show it. From the Stack Trace Explorer, we can jump to the line of code referenced, as shown below. We can also wrap long lines in the explorer.
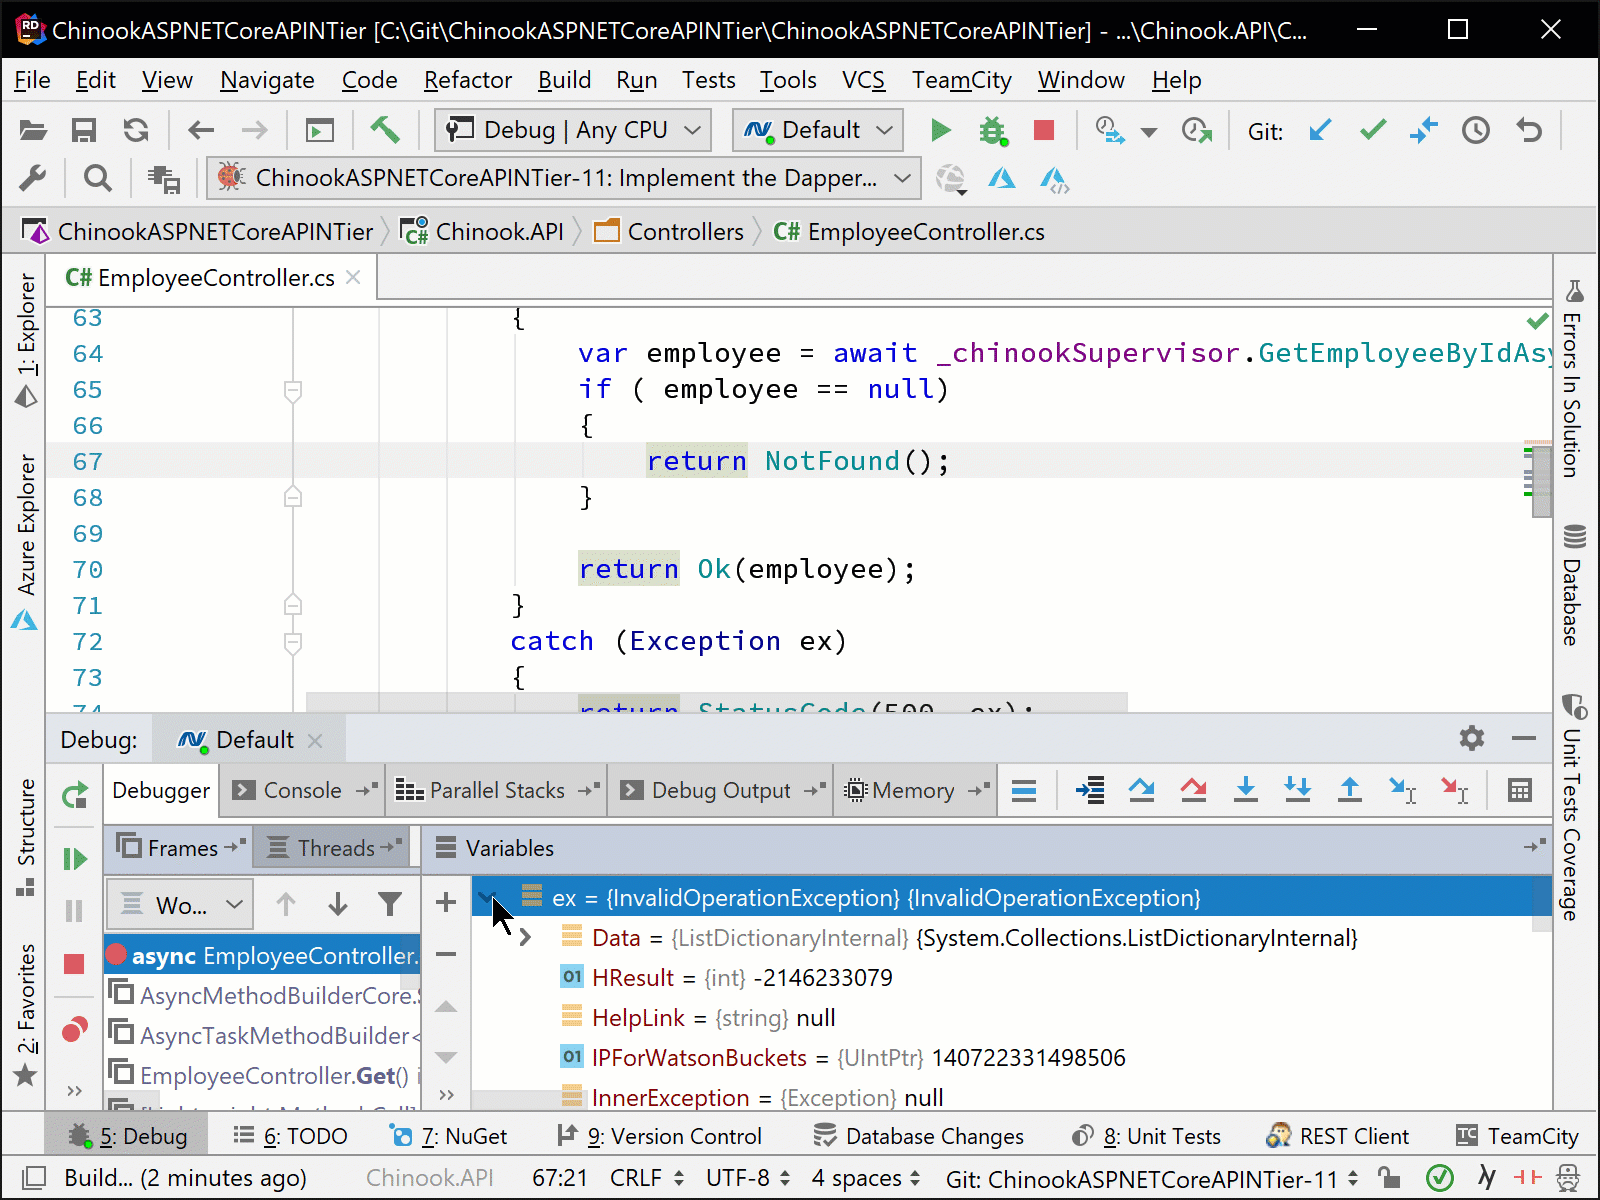
The experience is the same in Rider! We can use the Tools | Analyze Stack Trace… menu selection to view the explorer window or again use the Ctrl+E, T shortcut.
Working with the exceptions and the stack traces associated with them has never been easier to do with either .NET product you work with!
Download Rider 2018.3.3 or ReSharper 2018.3.3 and give them a try! We’d love to hear your feedback!


