

.NET Tools
Essential productivity kit for .NET and game developers
Auto-Detect Memory Issues in your App with Dynamic Program Analysis – Rider 2020.1

It seems that a common problem among profiling tools (including ours) is that they require too much effort from a developer. Profiling currently is seen as some kind of a last resort for when something has gone horribly wrong. The use of profilers is very episodic and chaotic, and it’s quite often ineffective because you simply can’t be an expert in a tool you use only once every six months. We find this kind of sad because we strongly believe that regular profiling is essential for product quality.
That being said, is there any solution? Well, our answer is “yes,” but with some caution. Since we can’t force people to use profilers all the time, the only possible solution is to make issue analysis automatic and move it as close to the user as possible. So, without further ado, we’re pleased to introduce Dynamic Program Analysis (DPA)!
What is Dynamic Program Analysis (DPA)?
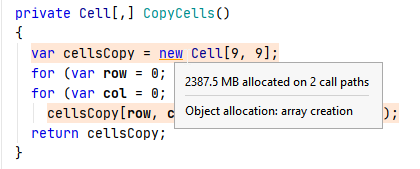
DPA is a process that runs in the background of your IDE and checks your application for various memory allocation issues. It currently checks for closures and allocations to large and small object heaps (LOH and SOH).
If a method call allocates more than the specified threshold, DPA will mark it as an issue.
DPA starts automatically each time you run or debug your application in Rider. The allocation data is collected with almost zero overhead (slowdown is no more than 2% in large solutions with high memory traffic).
Note that DPA currently supports .NET Framework and .NET Core on Windows only.
Why trace memory allocation?
From our experience, a significant number of performance issues are related to excessive memory allocation. To be more precise, they are related to full garbage collection caused by allocations. Quite often, such allocation issues are the result of bad code design and can be easily fixed.
Here’s a simple example: using struct instead of class. If a type represents a single value and is immutable, it can be defined as a struct. Defining it as a class makes it a reference type. As a result, its instances are placed on the managed heap instead of the stack, which means the instances that are no longer needed must be garbage-collected. You can find more examples in this series of blog posts.
Of course, we don’t want to limit DPA to memory allocation analysis only. In the future, we plan to add more runtime inspections, such as HTTP and SQL request analysis.
How to enable DPA
Typically, enabling DPA doesn’t require any additional actions from your side. All you need to do is install the JetBrains ETW Host service (after the 2020.1 release, the service will be installed along with Rider). DPA will then be activated when Rider starts. That’s it!
How to work with DPA
The coolest thing about DPA is that your typical workflow is not affected in any way! If you feel like you have time to go through allocation issues in your application, simply check the DPA icon status.
In more detail:
- Every time you finish running or debugging your project, pay attention to the DPA icon in the status bar. If it’s red like this,
 , click it and choose View Issues.
 - Go through the list of issues. At this step, you can:
- Double-click the issue to view its stack trace.
- Navigate from an issue to the corresponding code in the editor (with F4).
- And navigate back (with Alt+Enter -> View related memory allocation issues).
- If you think that the issue can be fixed, try fixing it using our tips.
- After you fix the issue, run the project one more time and make sure it no longer appears on the DPA list.
- If you think that the issue cannot be fixed, suppress this issue. One more way to make the issue disappear from the list is to increase the memory allocation threshold. You can find more details about this in the next section.
- Ideally, you should get the green DPA icon, which looks like this:
 .
.
Excluding False Positives
All programs require memory. A method may sometimes allocate a lot of memory – not because of code design, but just because this is required by the current use case.
If this is the case for just a few methods, the best solution is to suppress these issues. This is done by marking the corresponding method with the SuppressMessage attribute. To do his easily, use the quick-fix in the editor:
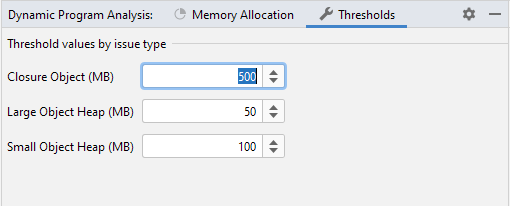
If you’re getting a lot of false positives, then you can simply increase the memory allocation thresholds. To do this, navigate to the Thresholds tab of the Dynamic Program Analysis window and set new thresholds for each issue type.
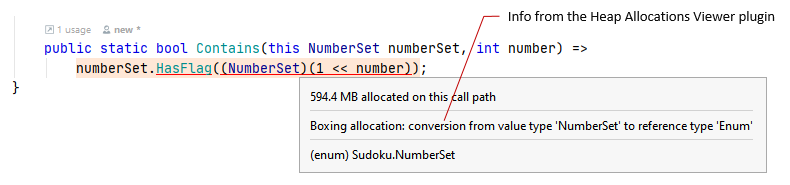
Heap Allocations Viewer plugin
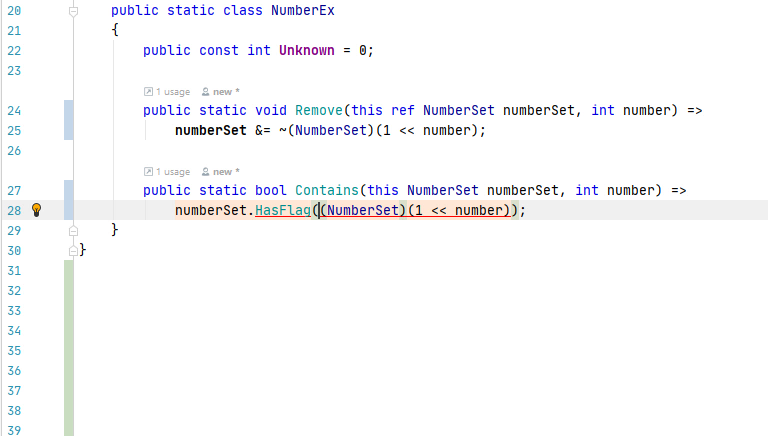
The Heap Allocations Viewer plugin highlights all the places in your code where memory is allocated. It’s a perfect match for DPA – together they make a perfect couple.
While the plugin shows allocations and describes why they happen, DPA shows whether a certain allocation is really an issue.
Feel free to download the latest Rider EAP and give DPA a try. And of course, please leave your feedback for us in the comments below.


