.NET Tools
Essential productivity kit for .NET and game developers
Troubleshoot allocations with Dynamic Program Analysis – ReSharper 2020.3 EAP

How often do you reach for a profiler? Only when things go wrong, right? All too often, we use profilers only as a last resort, even though dotTrace and dotMemory are both pleasant to work with.
What if we told you that Dynamic Program Analysis (DPA) in ReSharper automatically analyzes the memory usage of your applications and helps catch difficult-to-diagnose memory allocation issues before we deploy them to production. Because we all know an unhappy user is an unhappier developer, let’s see how DPA can keep us happy!
What is DPA?
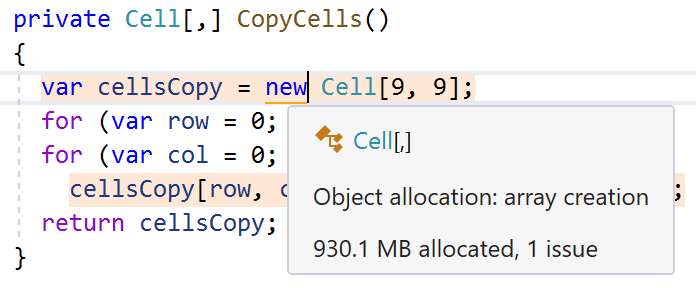
A simple description would be "it’s a kind of memory profiling that is always on". DPA is a process that runs in the background of your IDE and checks your application for various memory allocation issues. It currently checks for closures and allocations to large and small object heaps (LOH and SOH). If a method call allocates more than the specified threshold, DPA will mark it as an issue.
DPA starts automatically each time you run or debug your application in Visual Studio. The allocation data is collected with almost zero overhead (the slowdown is no more than 2% in large solutions with high memory traffic).
Why is DPA important?
Memory allocation issues are the most difficult to catch, and the most insidious, as we can’t easily spot them during code reviews. These errors can have catastrophic consequences in our production environments. We strive to do our best to find them, but sometimes we fall short. Tools like DPA bring us closer to our goal of eliminating allocation issues.
DPA is a process that runs in the background of our application and looks for various memory allocation issues. It currently checks for closures and allocations to the large and small object heaps (LOH and SOH). It starts automatically every time we run or debug our apps, and there is almost no overhead cost associated with collecting memory allocation data.
We can set memory allocation thresholds, which means we can be selective about what constitutes a performance concern and what might be expected behavior.
Where to find DPA?
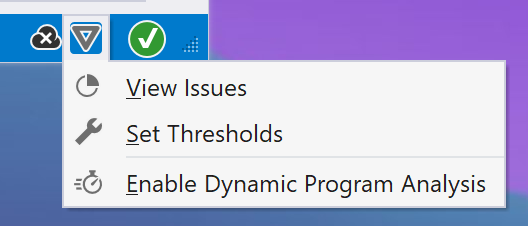
DPA is installed by default with ReSharper. After installing the latest version of dotUltimate, we can see an upside-down triangle located on the right-hand side of the Visual Studio status bar at the bottom of the window. Clicking the icon allows us to toggle DPA functionality on or off. From this icon, we can also bring up the DPA tool window and set memory thresholds.
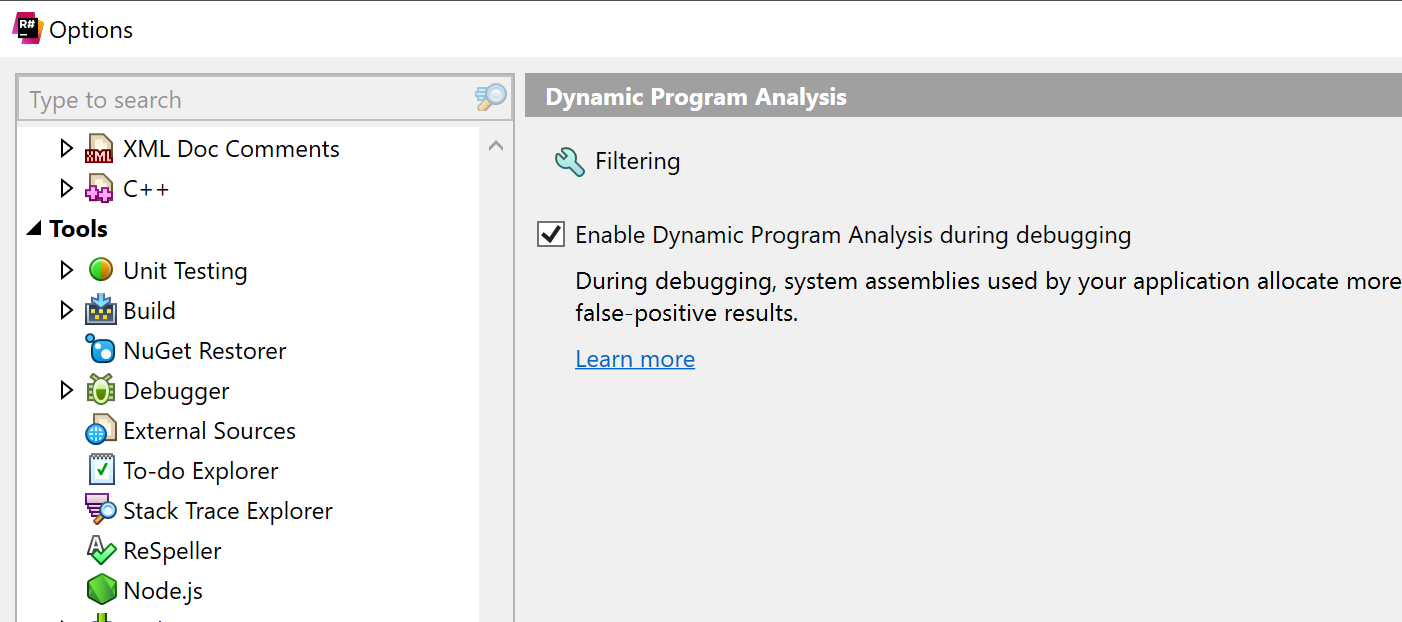
In the ReSharper options, we can decide whether to run DPA while debugging. Running DPA while debugging can lead to false positives, as the code compiled during the debugging process may perform additional memory allocations and is generally unoptimized. That said, it may provide indications of potental memory issues. We recommend running DPA in both release and debug run configurations to get a better understanding of any likely issues.
Now let’s see what information DPA can give us!
Memory allocation warnings with DPA
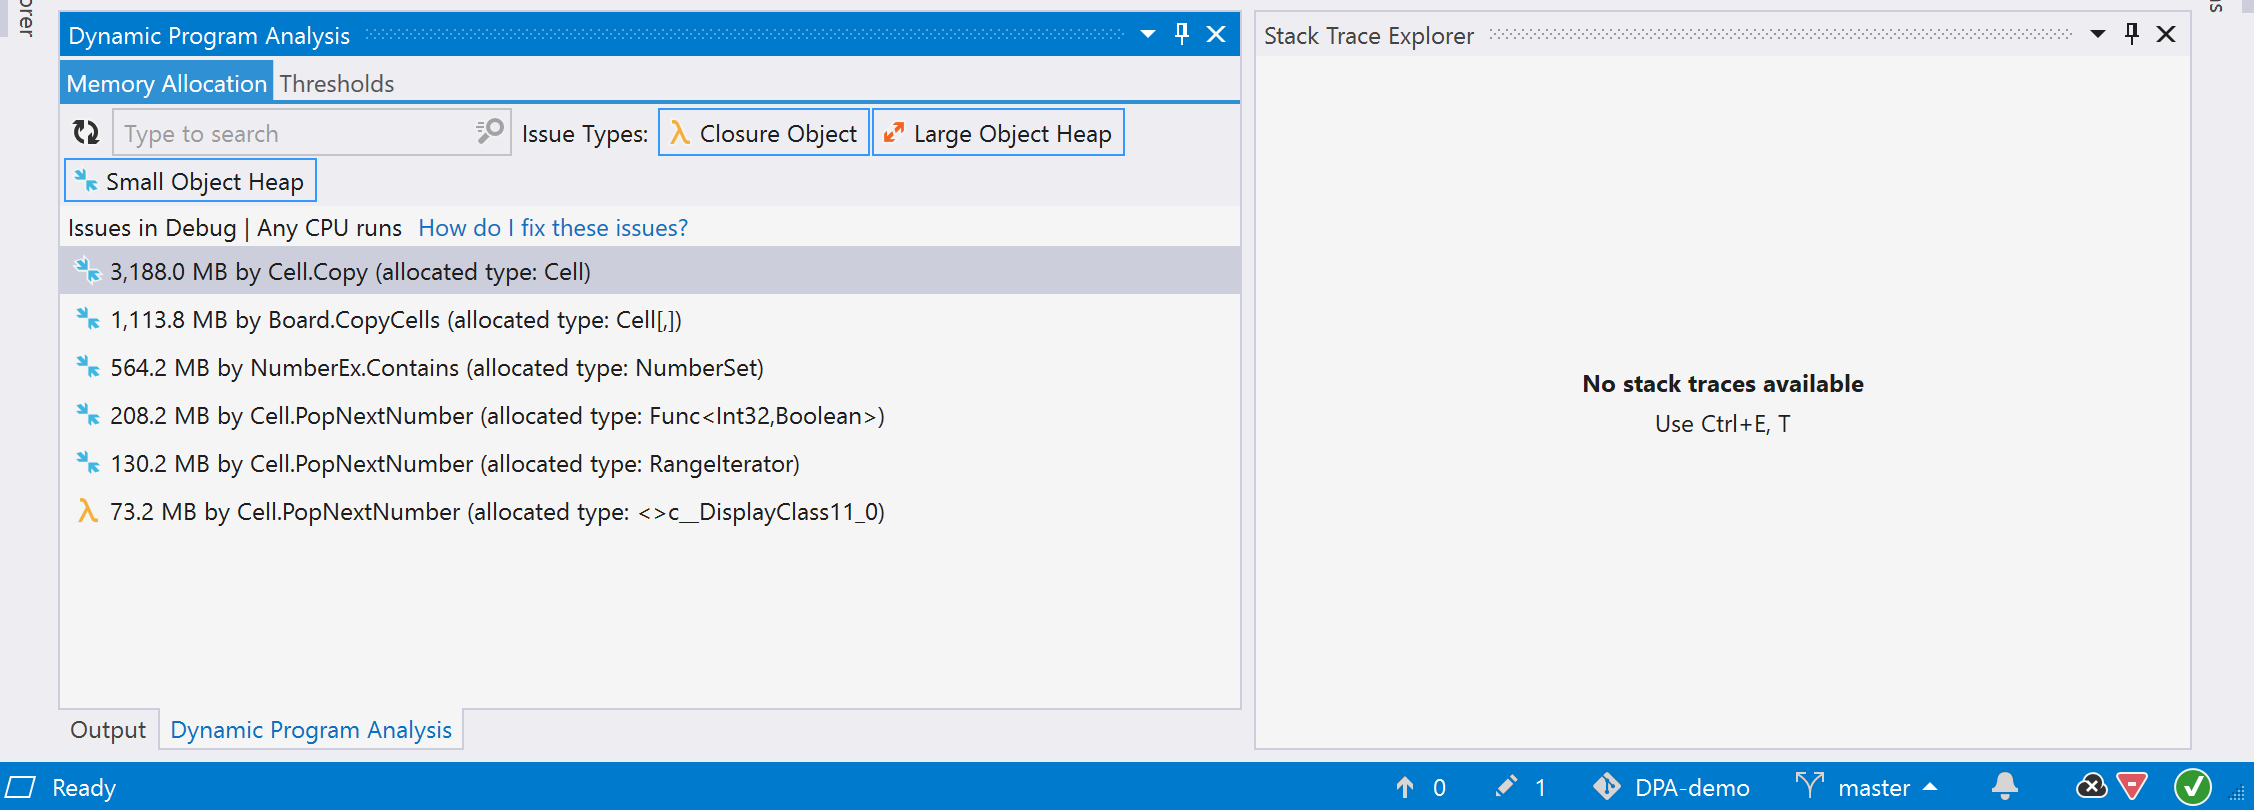
We have a sample Soduku solver application on GitHub that you can use to give DPA a try. After running it and opening the Dynamic Program Analysis tab, we can see DPA flagged some memory allocation issues around closures, the large object heap, and the small object heap. The DPA status indicator is shown in red, indicating we may have serious issues that need to be addressed.
Double-clicking any problem will open the Stack Trace Explorer, allowing us to navigate to the issue’s exact location in code.
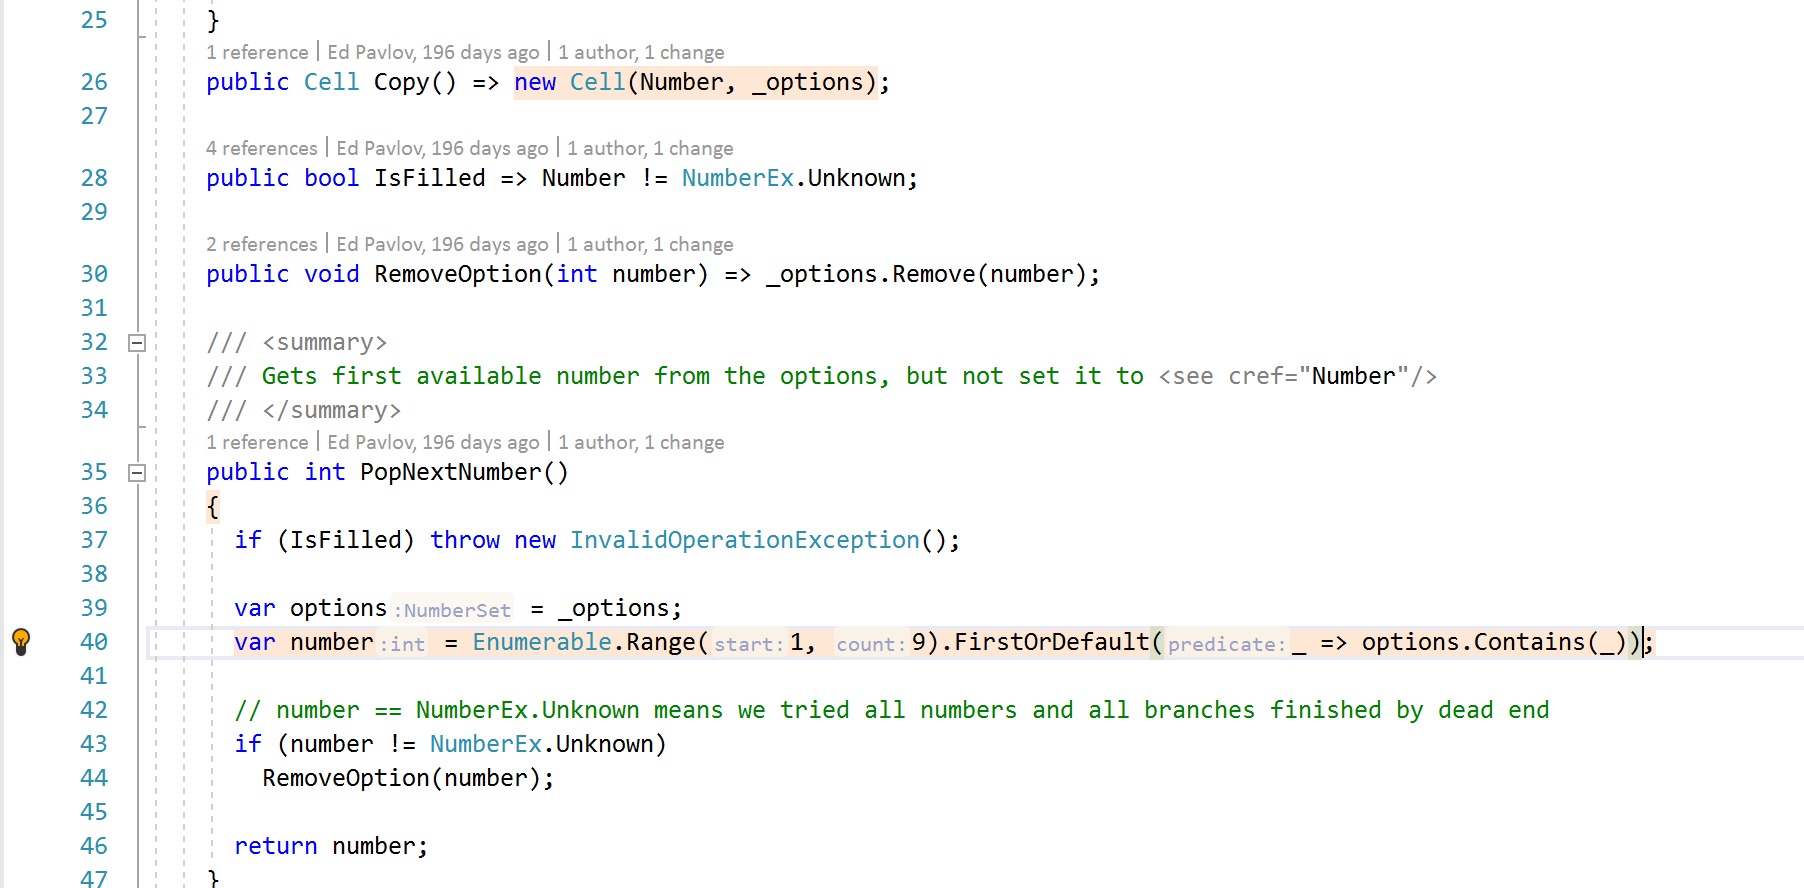
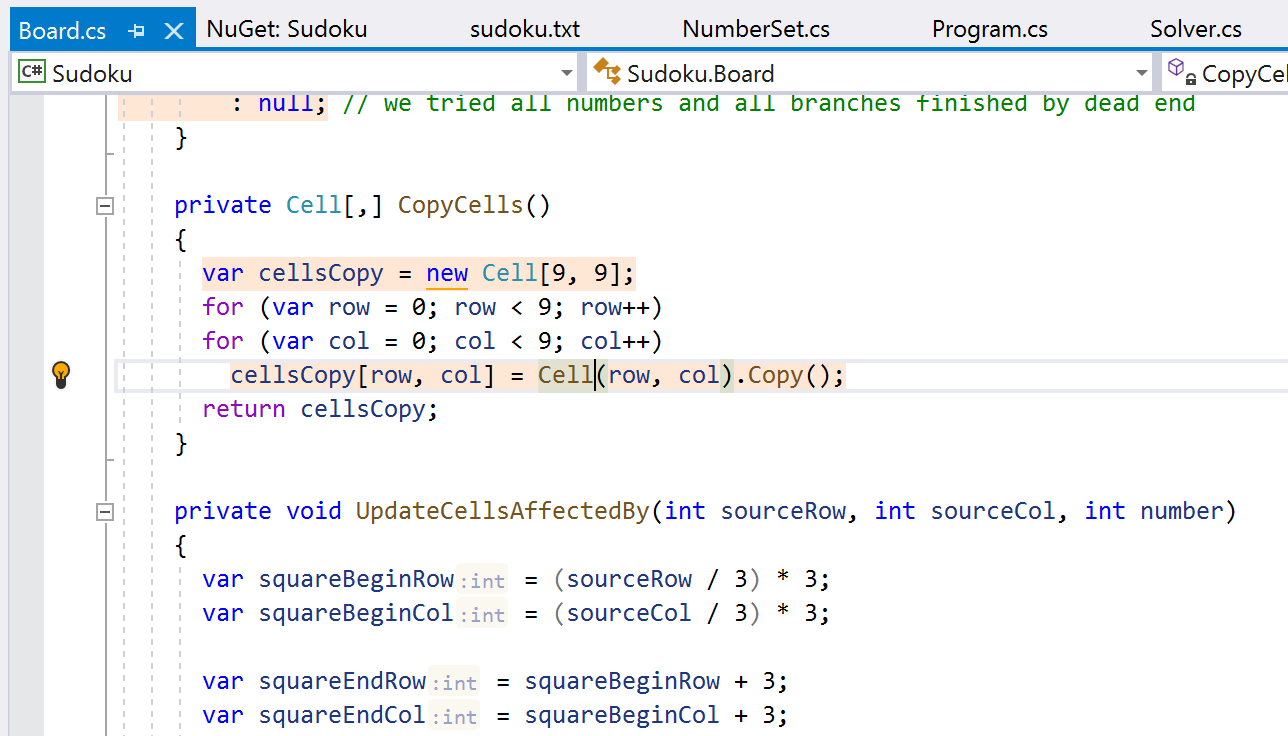
Navigating into our code, we can see memory allocation issues highlighted directly in the editor. Catching these issues can help us diagnose and eventually solve these production problems waiting to happen.
Great, no? What incredible power at our fingertips!
Check out the Heap Allocations Viewer plugin for ReSharper, which can help you identify where an allocation may be happening. We also have some guidance about solving the types of memory allocations DPA helps discover. An older blog post highlights several other common memory allocation issues in .NET.
DPA focuses on memory allocation issues. In our experience, a large number of performance issues are related to excessive memory allocation and the garbage collection that comes with it. Quite often, such issues are the result of bad code design and can easily be fixed. For a more thorough analysis, check out dotMemory.
Excluding False Positives
All programs require memory, and specific methods can allocate a lot of memory – not because of a particular flaw or mistake, but just because this is required by the current use case.
In the case of these memory-hungry methods, the best solution is to suppress the warning messages. We can accomplish that by marking the corresponding method with the SuppressMessage attribute. To do his easily, use the quick-fix in the editor:
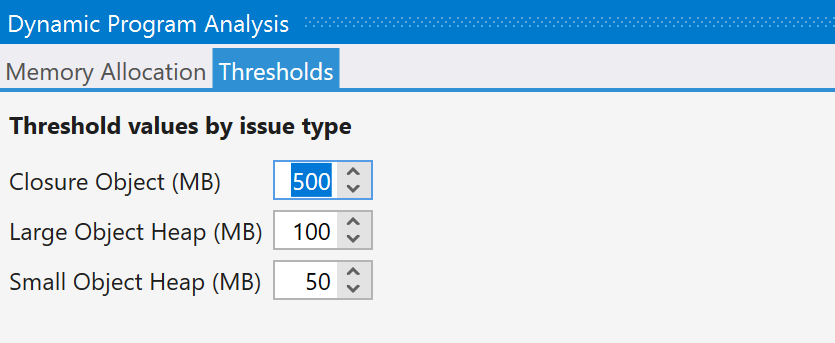
If we’re getting a lot of false positives, then we can simply increase the memory allocation thresholds. To do this, navigate to the Thresholds tab of the Dynamic Program Analysis window and set new thresholds for each issue type.
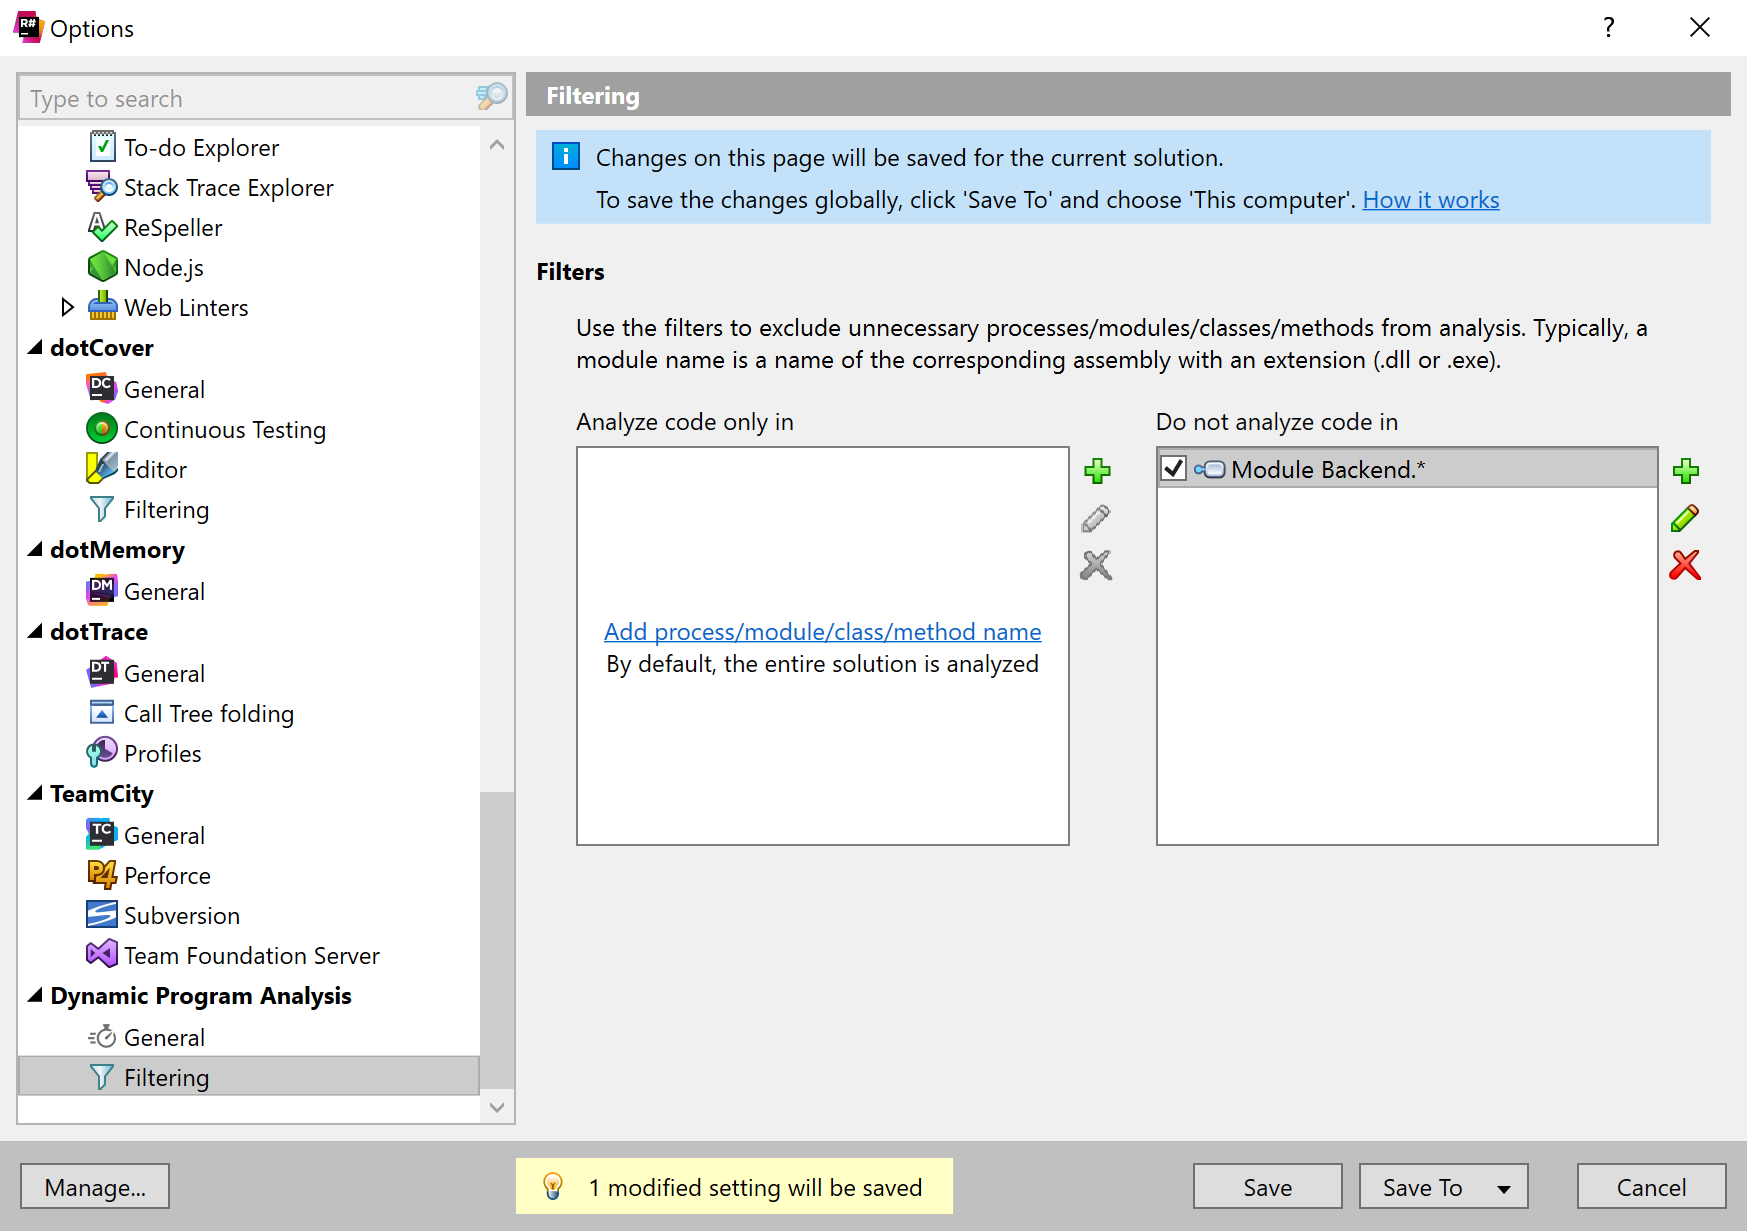
Excluding code from analysis
Large solutions can include hundreds of projects with teams working on them simultaneously. There may be several reasons we would want to exclude particular parts of the solution from analysis: for example, if we’re not the owner of the code or if it isn’t related to your current work.
We can exclude code with the help of filters. Those experienced with dotCover filters, will find the DPA filter familiar. To add a filter, go to ReSharper | Options | Dynamic Program Analysis | Filtering:
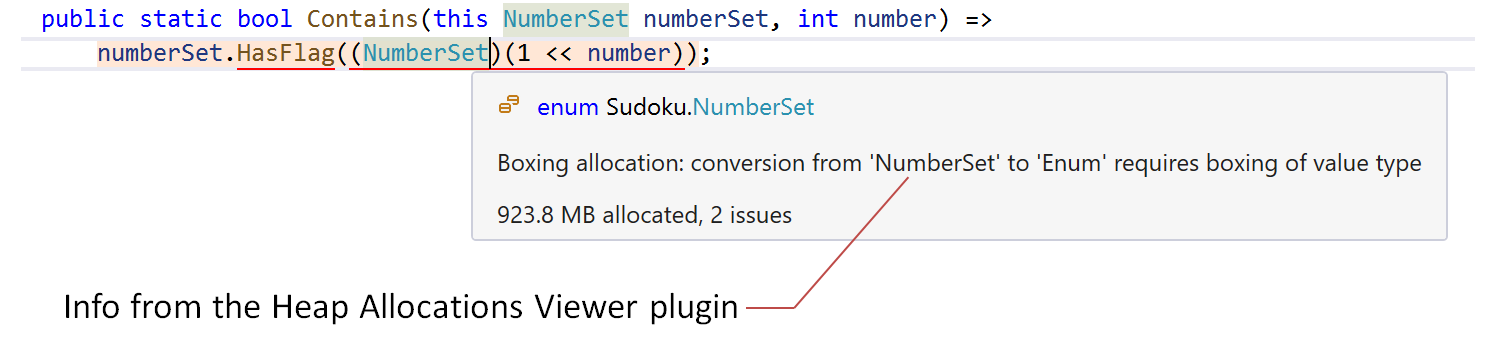
The Heap Allocations Viewer plugin
The Heap Allocations Viewer plugin highlights all the places in our code where memory is allocated. It’s a match made for DPA – together they make a perfect one-two combo.
While the plugin shows allocations and describes why they happen, DPA shows whether a certain allocation is really an issue.
Conclusion
Dynamic Program Analysis is another excellent feature that helps ReSharper users produce highly efficient applications. One of the most significant aspects of DPA is that it fits into our daily development workflows, so there’s no need to block out hours to profile our apps. We highly recommend visiting our JetBrains .NET Guide, where developer advocate Maarten Balliauw shows you in depth the ways we can use DPA to build better applications.
For anyone interested in trying DPA on a project known to have memory issues, we’ve created a sample in our GitHub repository.
Please let us know in the comments what you think of DPA, and file any ReSharper feature requests or bugs in our issue tracker.
Thanks to Alexy Totin for helping co-author this post

Subscribe to a monthly digest curated from the .NET Tools blog: