.NET Tools
Essential productivity kit for .NET and game developers
Investigate memory issues with ease – Introducing real-time inspections in dotMemory Allocation Analysis

Memory issues can be challenging to diagnose, especially when we’re under the stress of an extreme performance issue and unhappy users. Luckily, dotMemory 2021.1 users will appreciate the new and improved memory allocation analysis in our product’s latest version.
Using our new allocation analysis UI, we’ll quickly locate those wasteful allocations bringing our application to a grinding halt. We’ll spend seconds, not hours, investigating any memory issue. Let’s see how.
Timeline Intervals and Memory Allocations
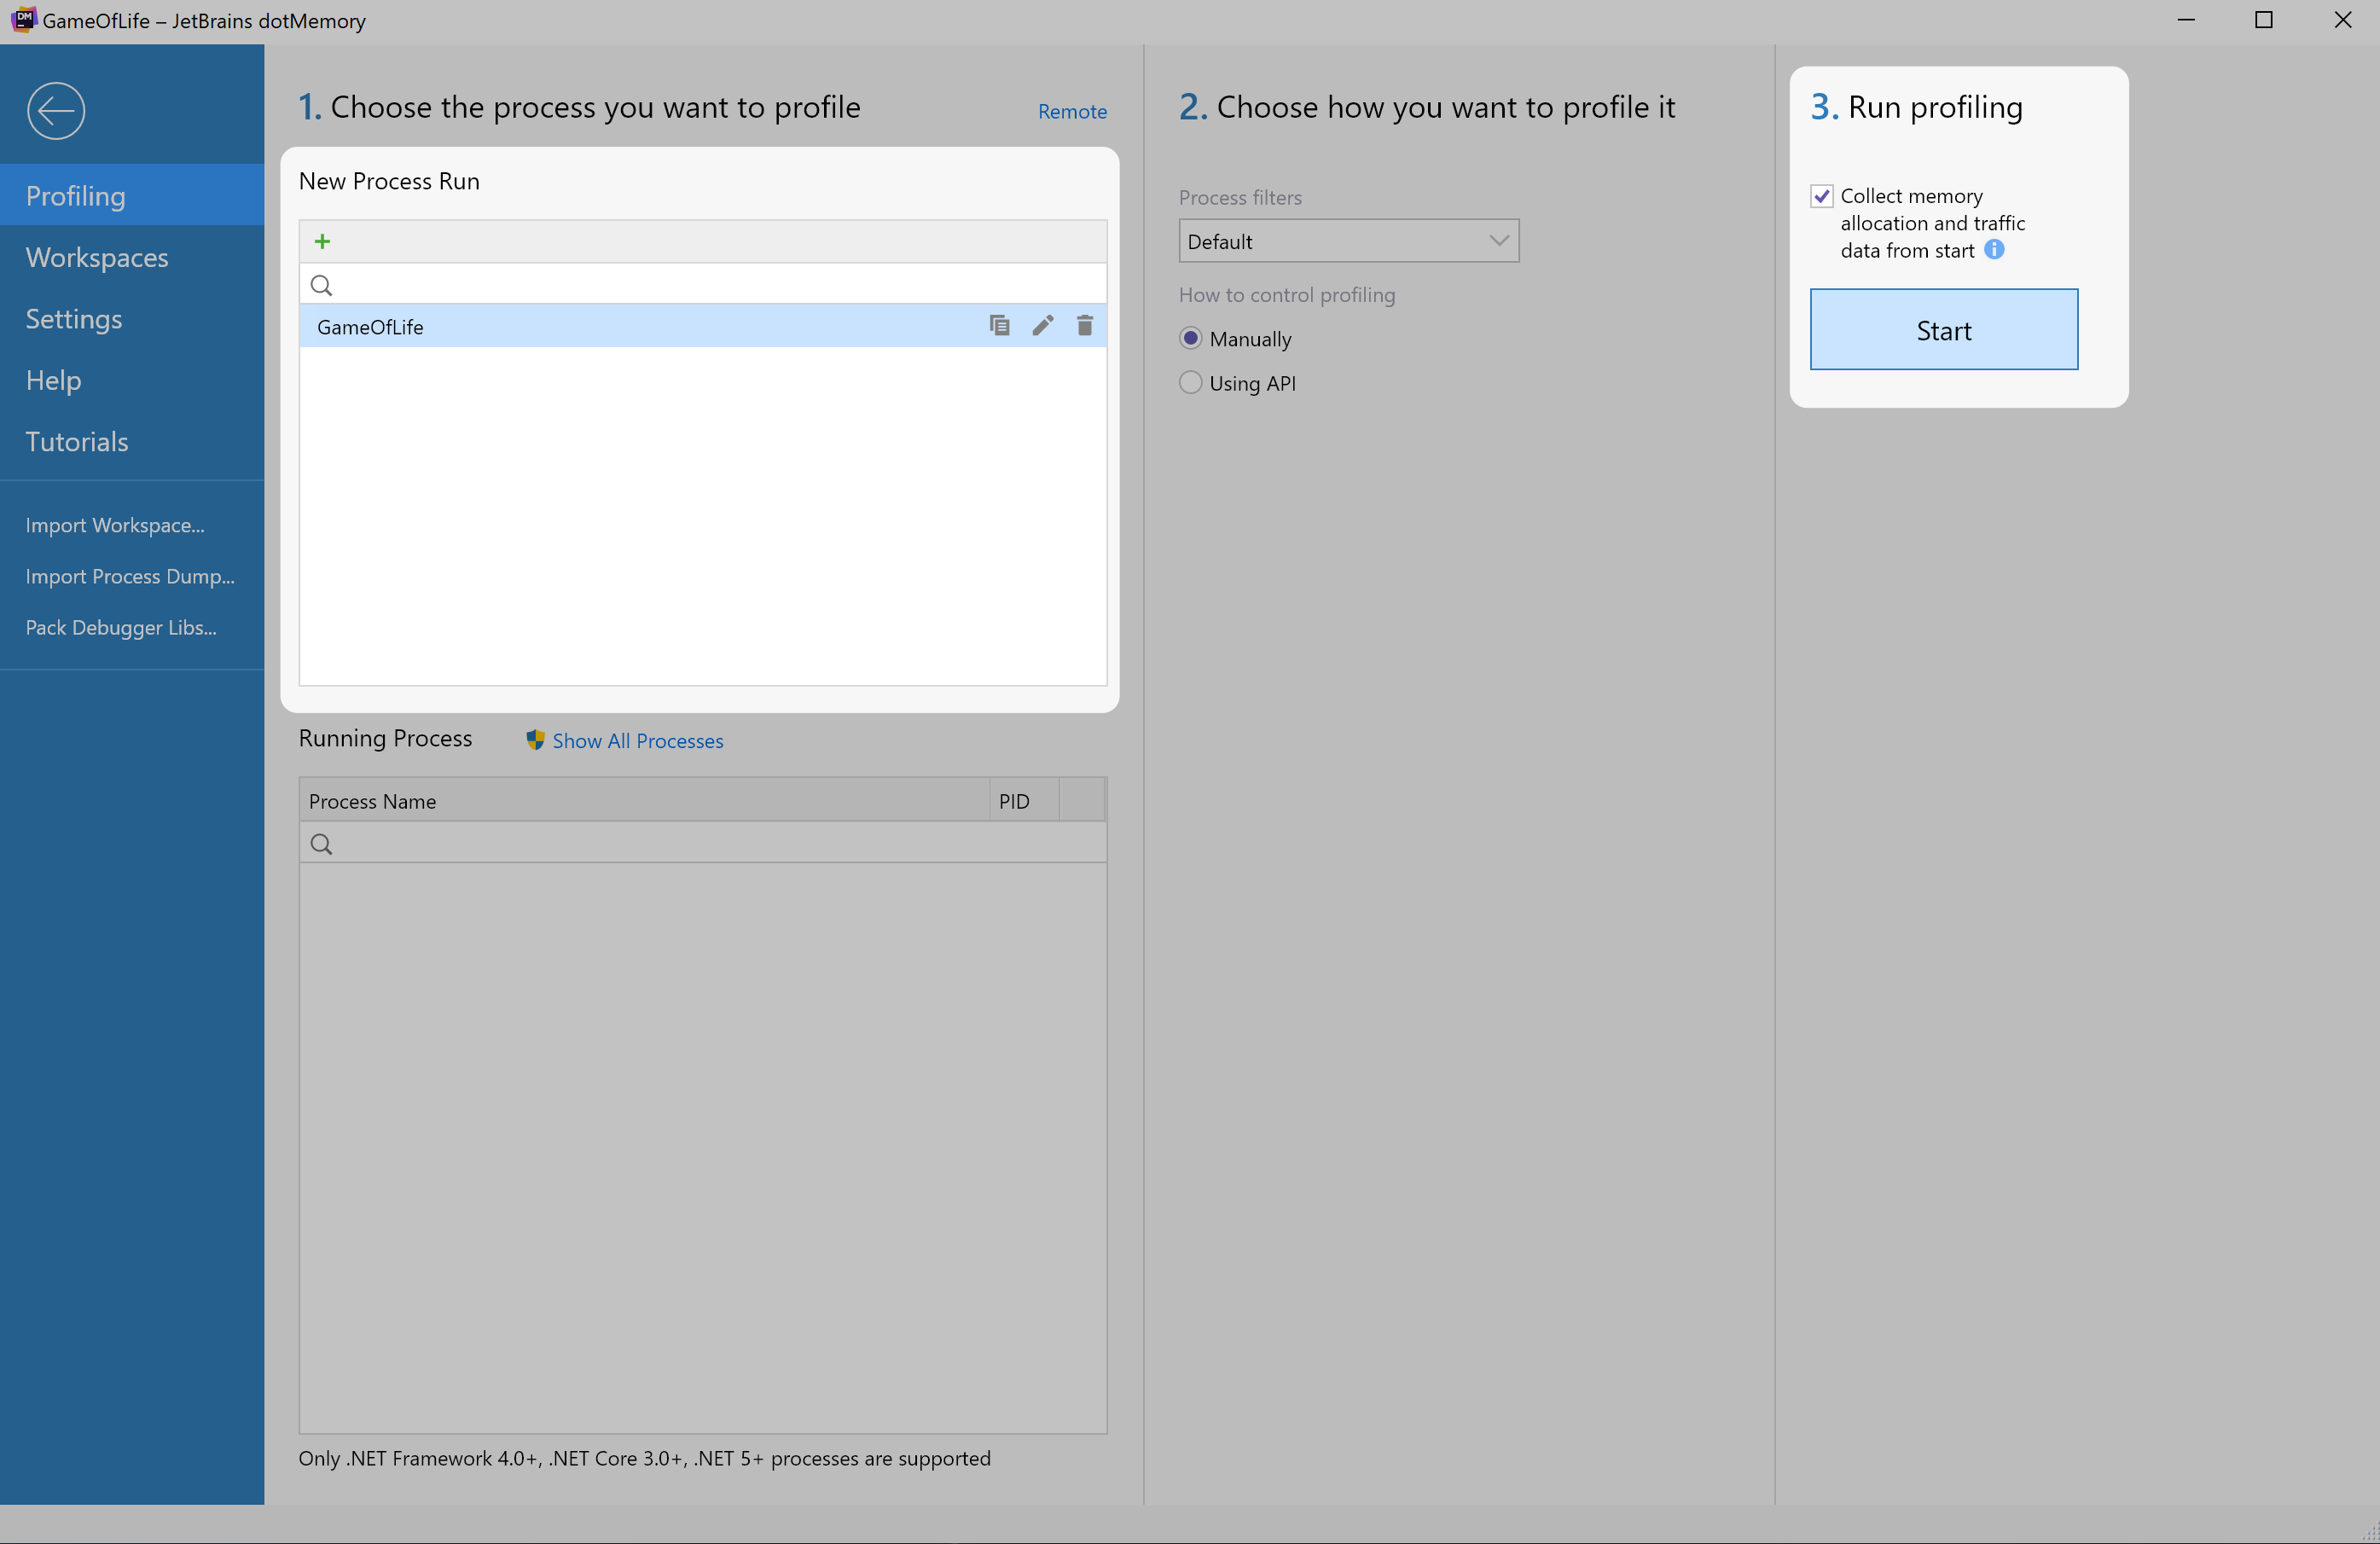
We’ll start a new profiling session using dotMemory by adding a New Process Run and selecting the problematic .NET application. Once our app is selected, we can start profiling by using the Start button under the Run Profiling section on the dotMemory UI’s right-hand side. We need to be sure that the Collect memory allocations and traffic data from start option is checked. The collection of allocations can be toggled during the session, if necessary, as it may affect performance.
You will see object allocations in real-time on the timeline graph. We can drag and highlight regions of our timeline to focus on visibly problematic areas. This sample shows the classic sawtooth pattern associated with a potential memory leak.
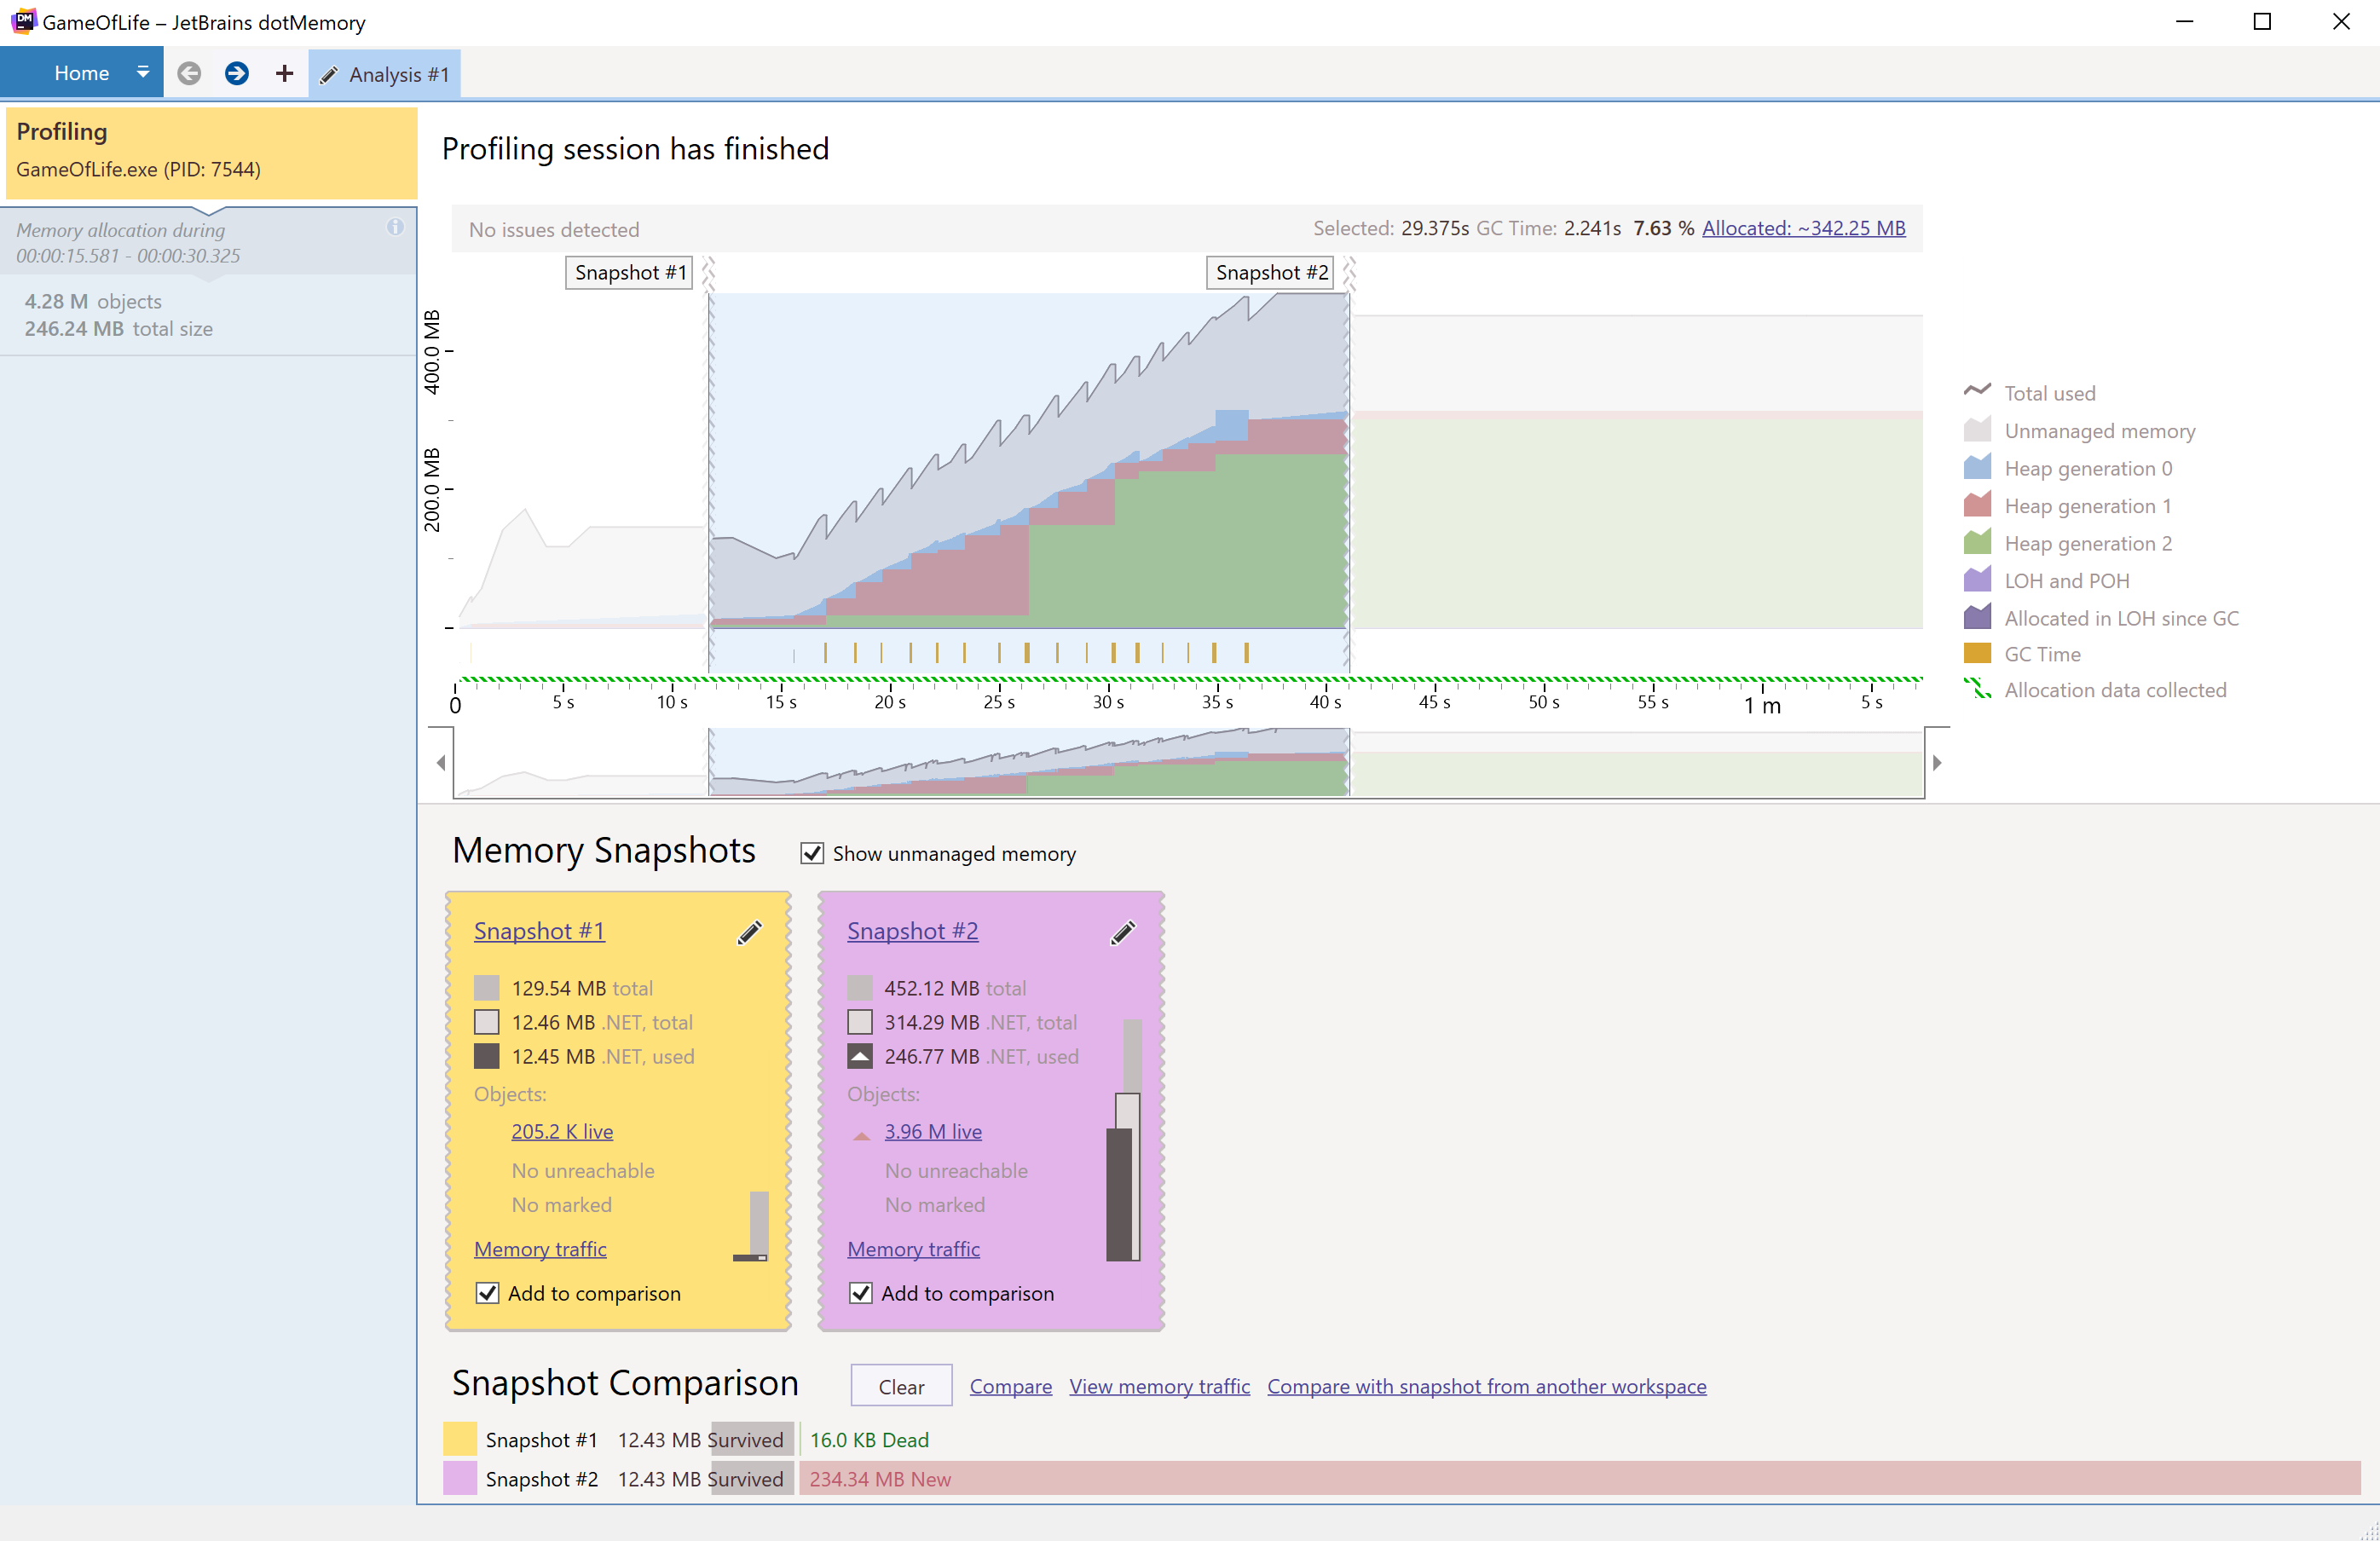
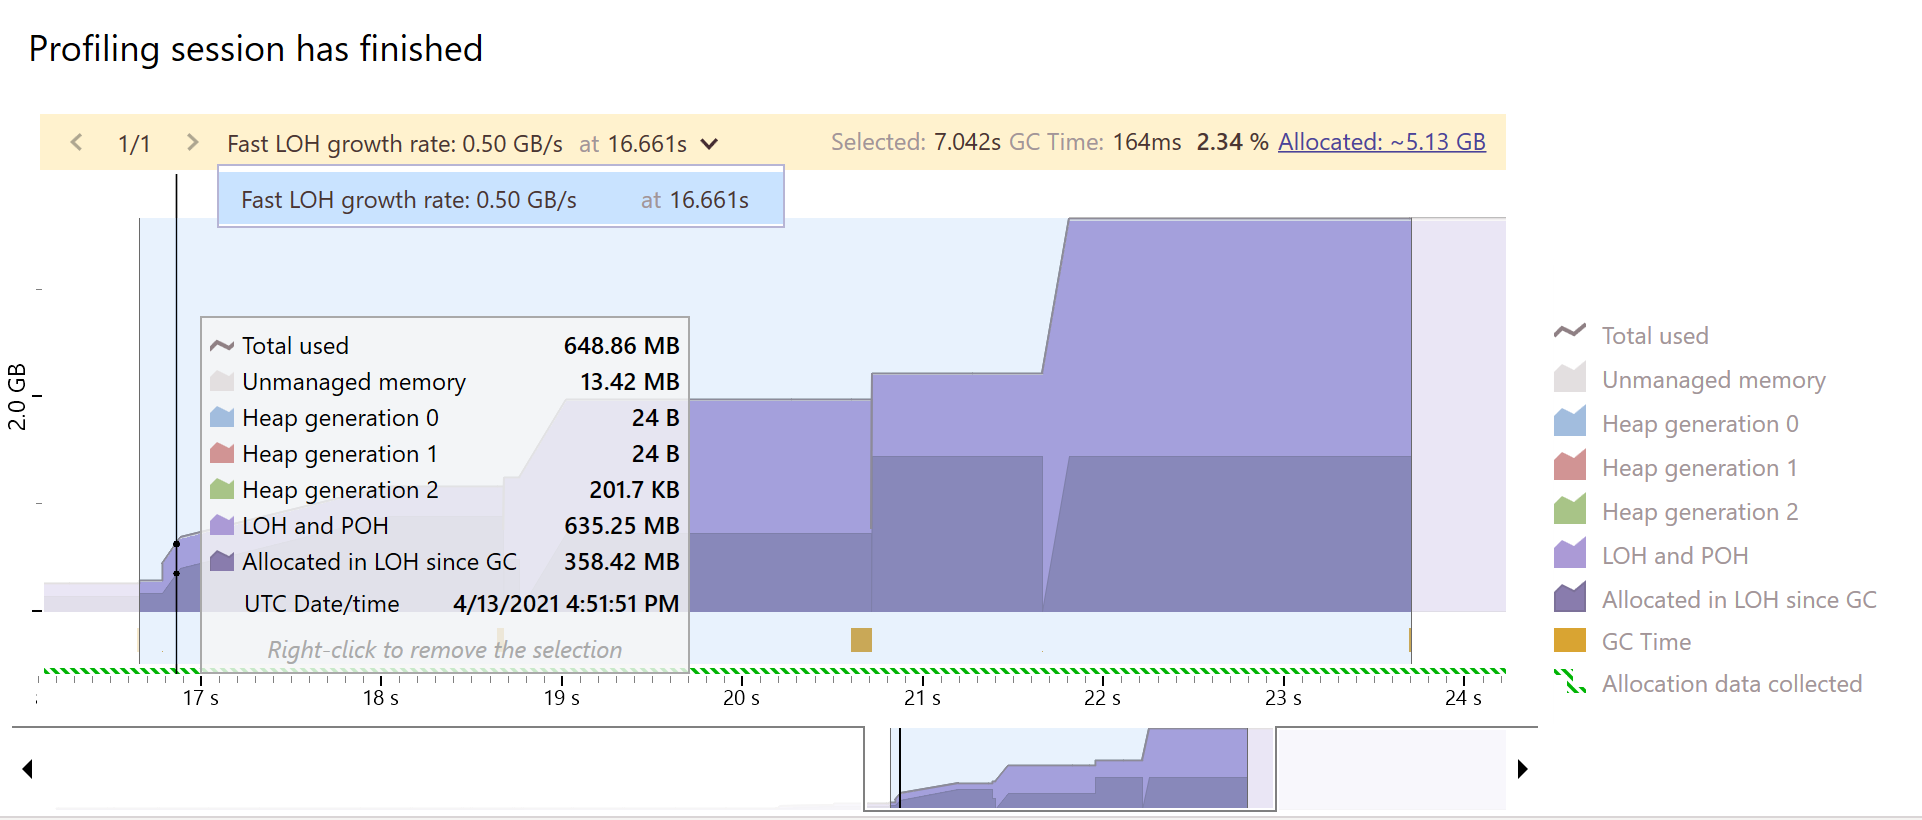
After selecting a region, we’ll see a new UI element giving us information about the chosen area’s total time in seconds, the garbage collection time, garbage collection time to total time in percentage, and physical size.
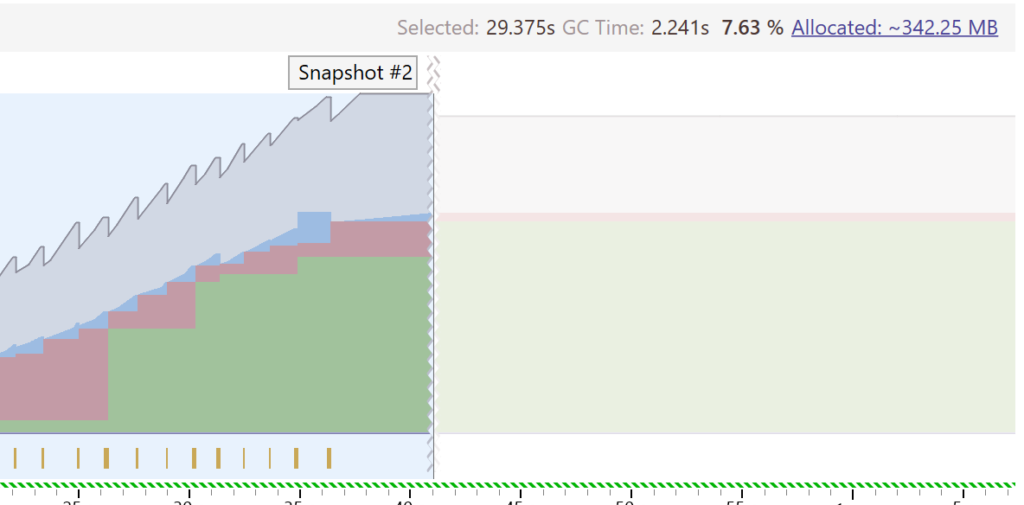
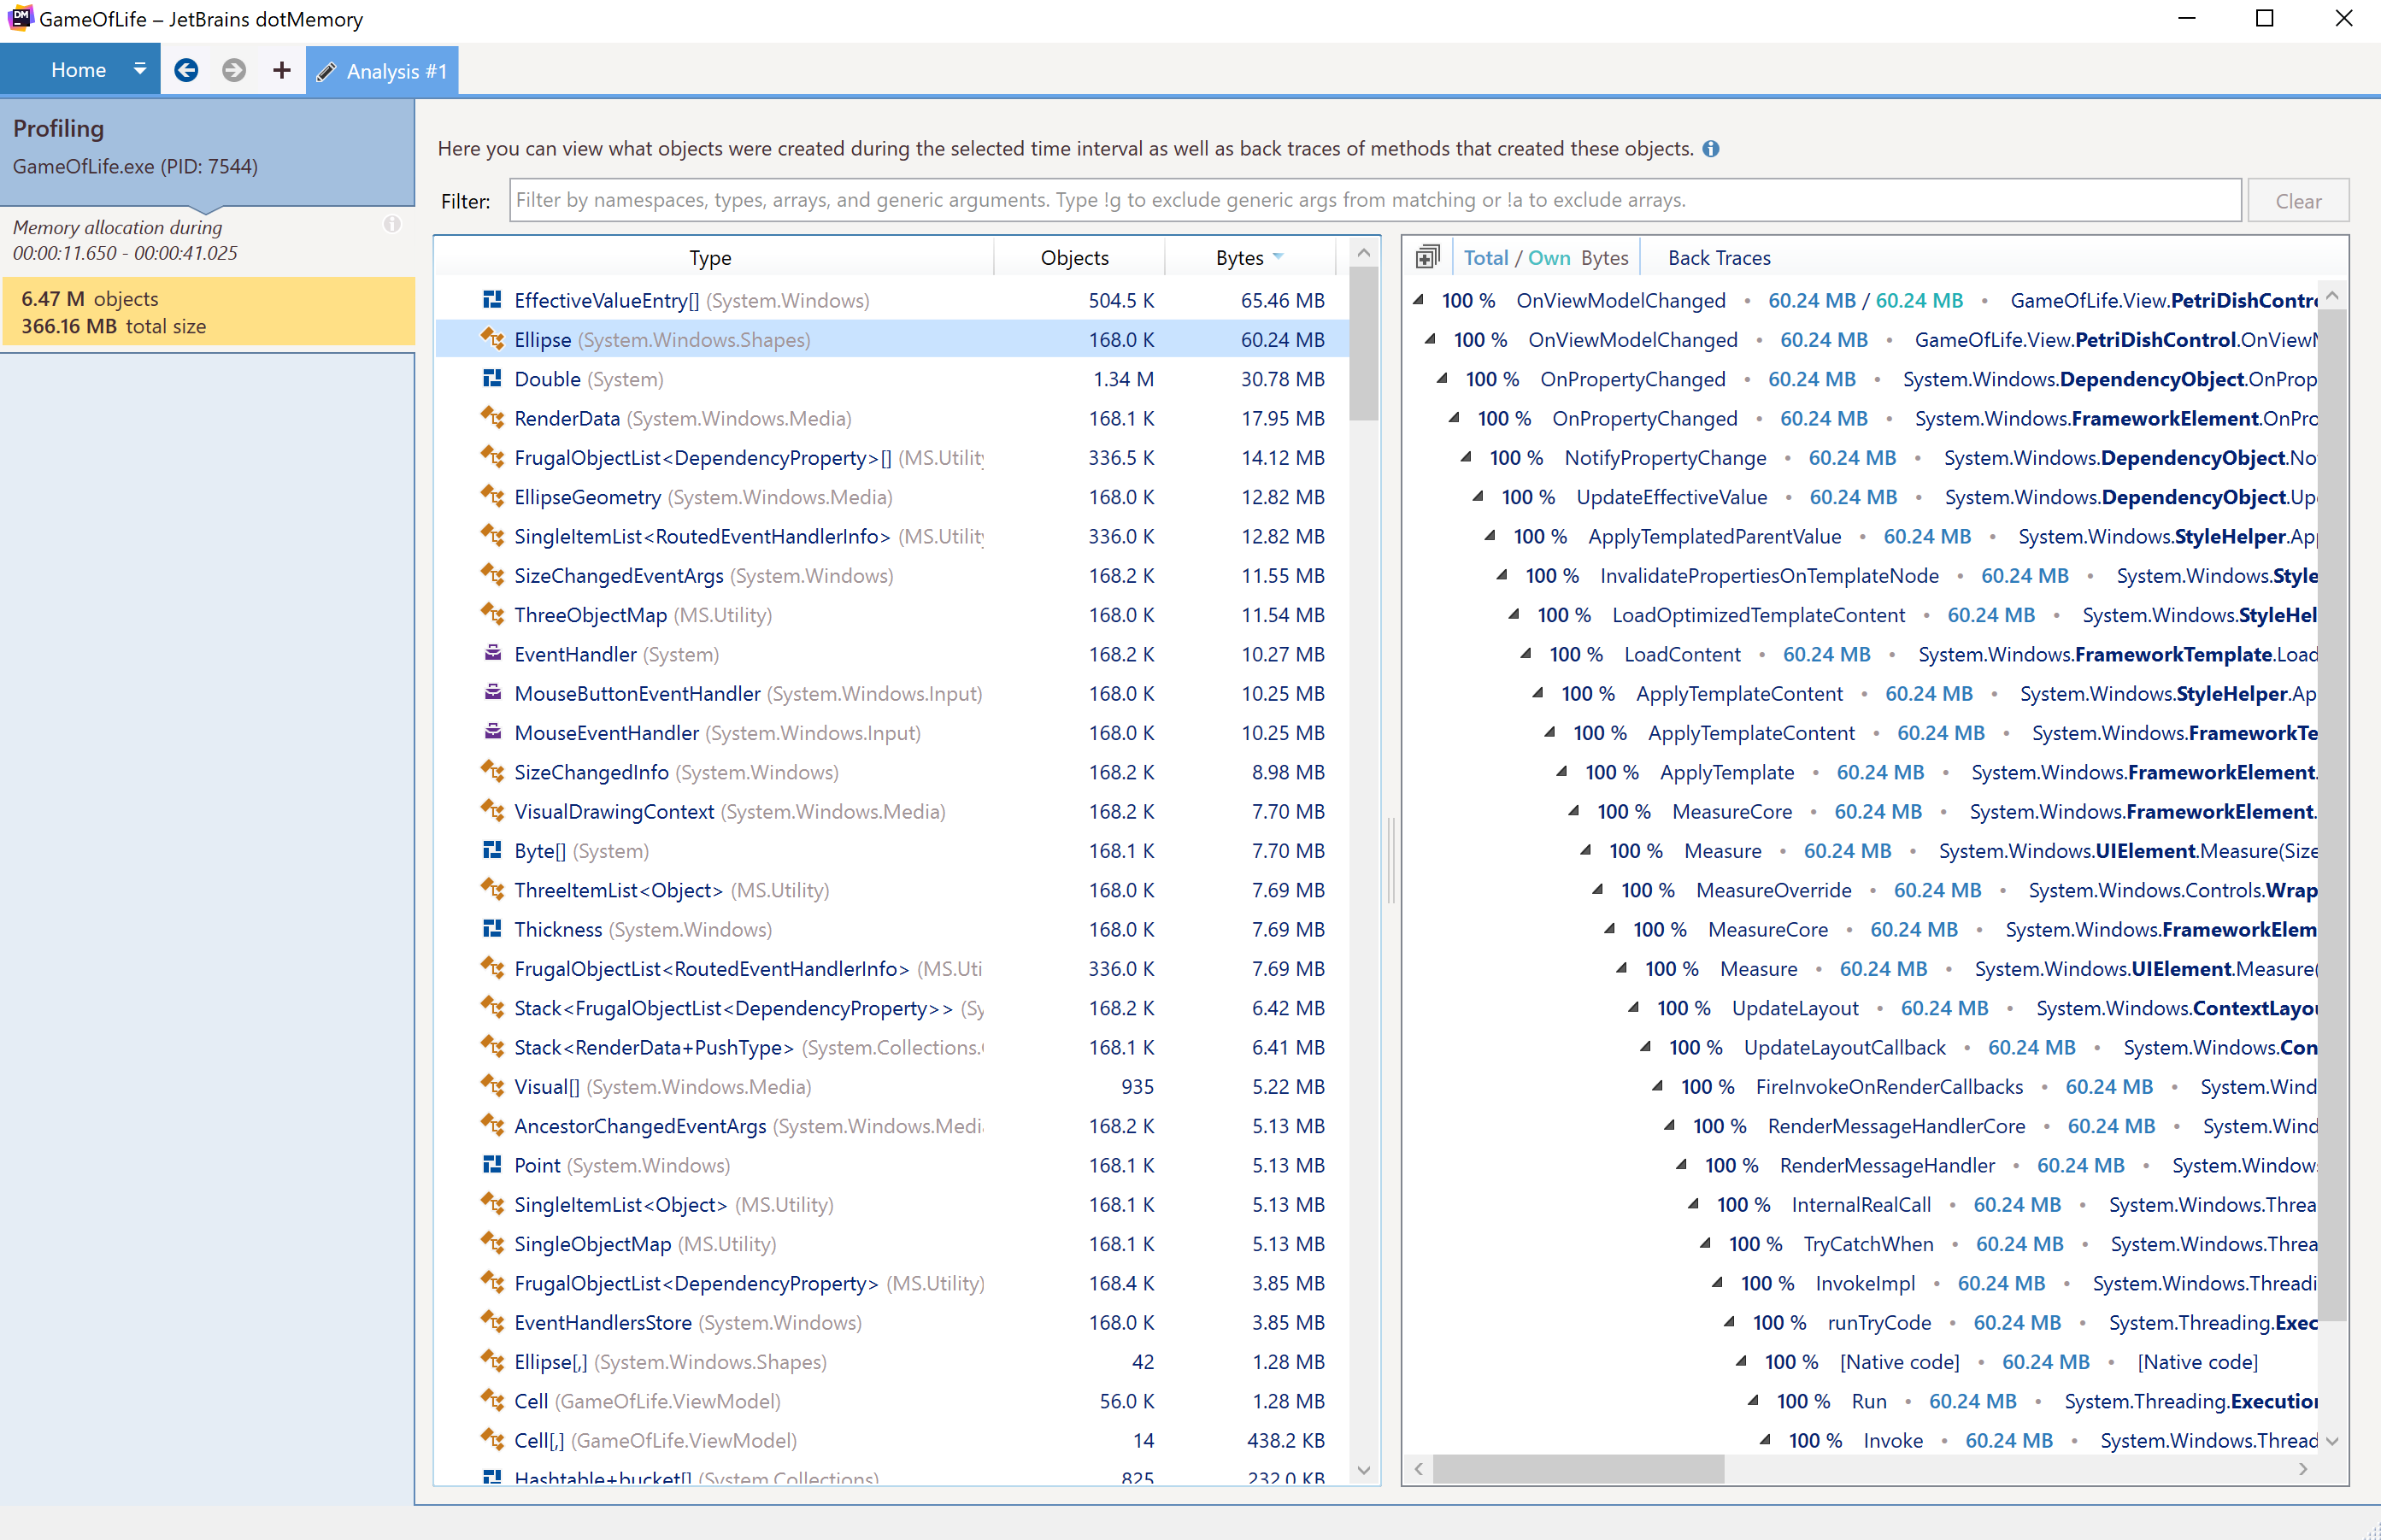
We’ll also notice the Allocated text is a hyperlink. Clicking the text will show us where object allocations occur in the form of a backtrace. This feature can quickly help us find the problems in our codebase and reduce the investigation time.
Real-time Inspections
Several common issues repeatedly appear across all .NET applications: Pinned objects in Gen0, High Garbage Collection pressure, and Fast Large Object Heap (LOH) growth rate. dotMemory can detect these issues in real-time during an analysis session without the need to take snapshots.
Take this sample console application, which will cause a LOH growth rate that will result in an OutOfMemoryException.
using System;
using System.Linq;
using System.Text;
using System.Threading.Tasks;

var count = 1;
while (true)
{
    Allocations.DoubleIt();
    Console.WriteLine("count : {count++}");
    await Task.Delay(TimeSpan.FromSeconds(1));
}

public class Allocations
{
    private static readonly StringBuilder Builder = new("A");
    public static string DoubleIt()
    {
        var doubleIt = Builder.Length * 2; // double the length
        Builder.Append(Enumerable.Repeat('a', doubleIt).ToArray());
        return Builder.ToString();
    }
}
Running the console application with a dotMemory profiling session will detect the LOH issue. We can click the issue, and dotMemory will highlight the interval where the problem was detected.
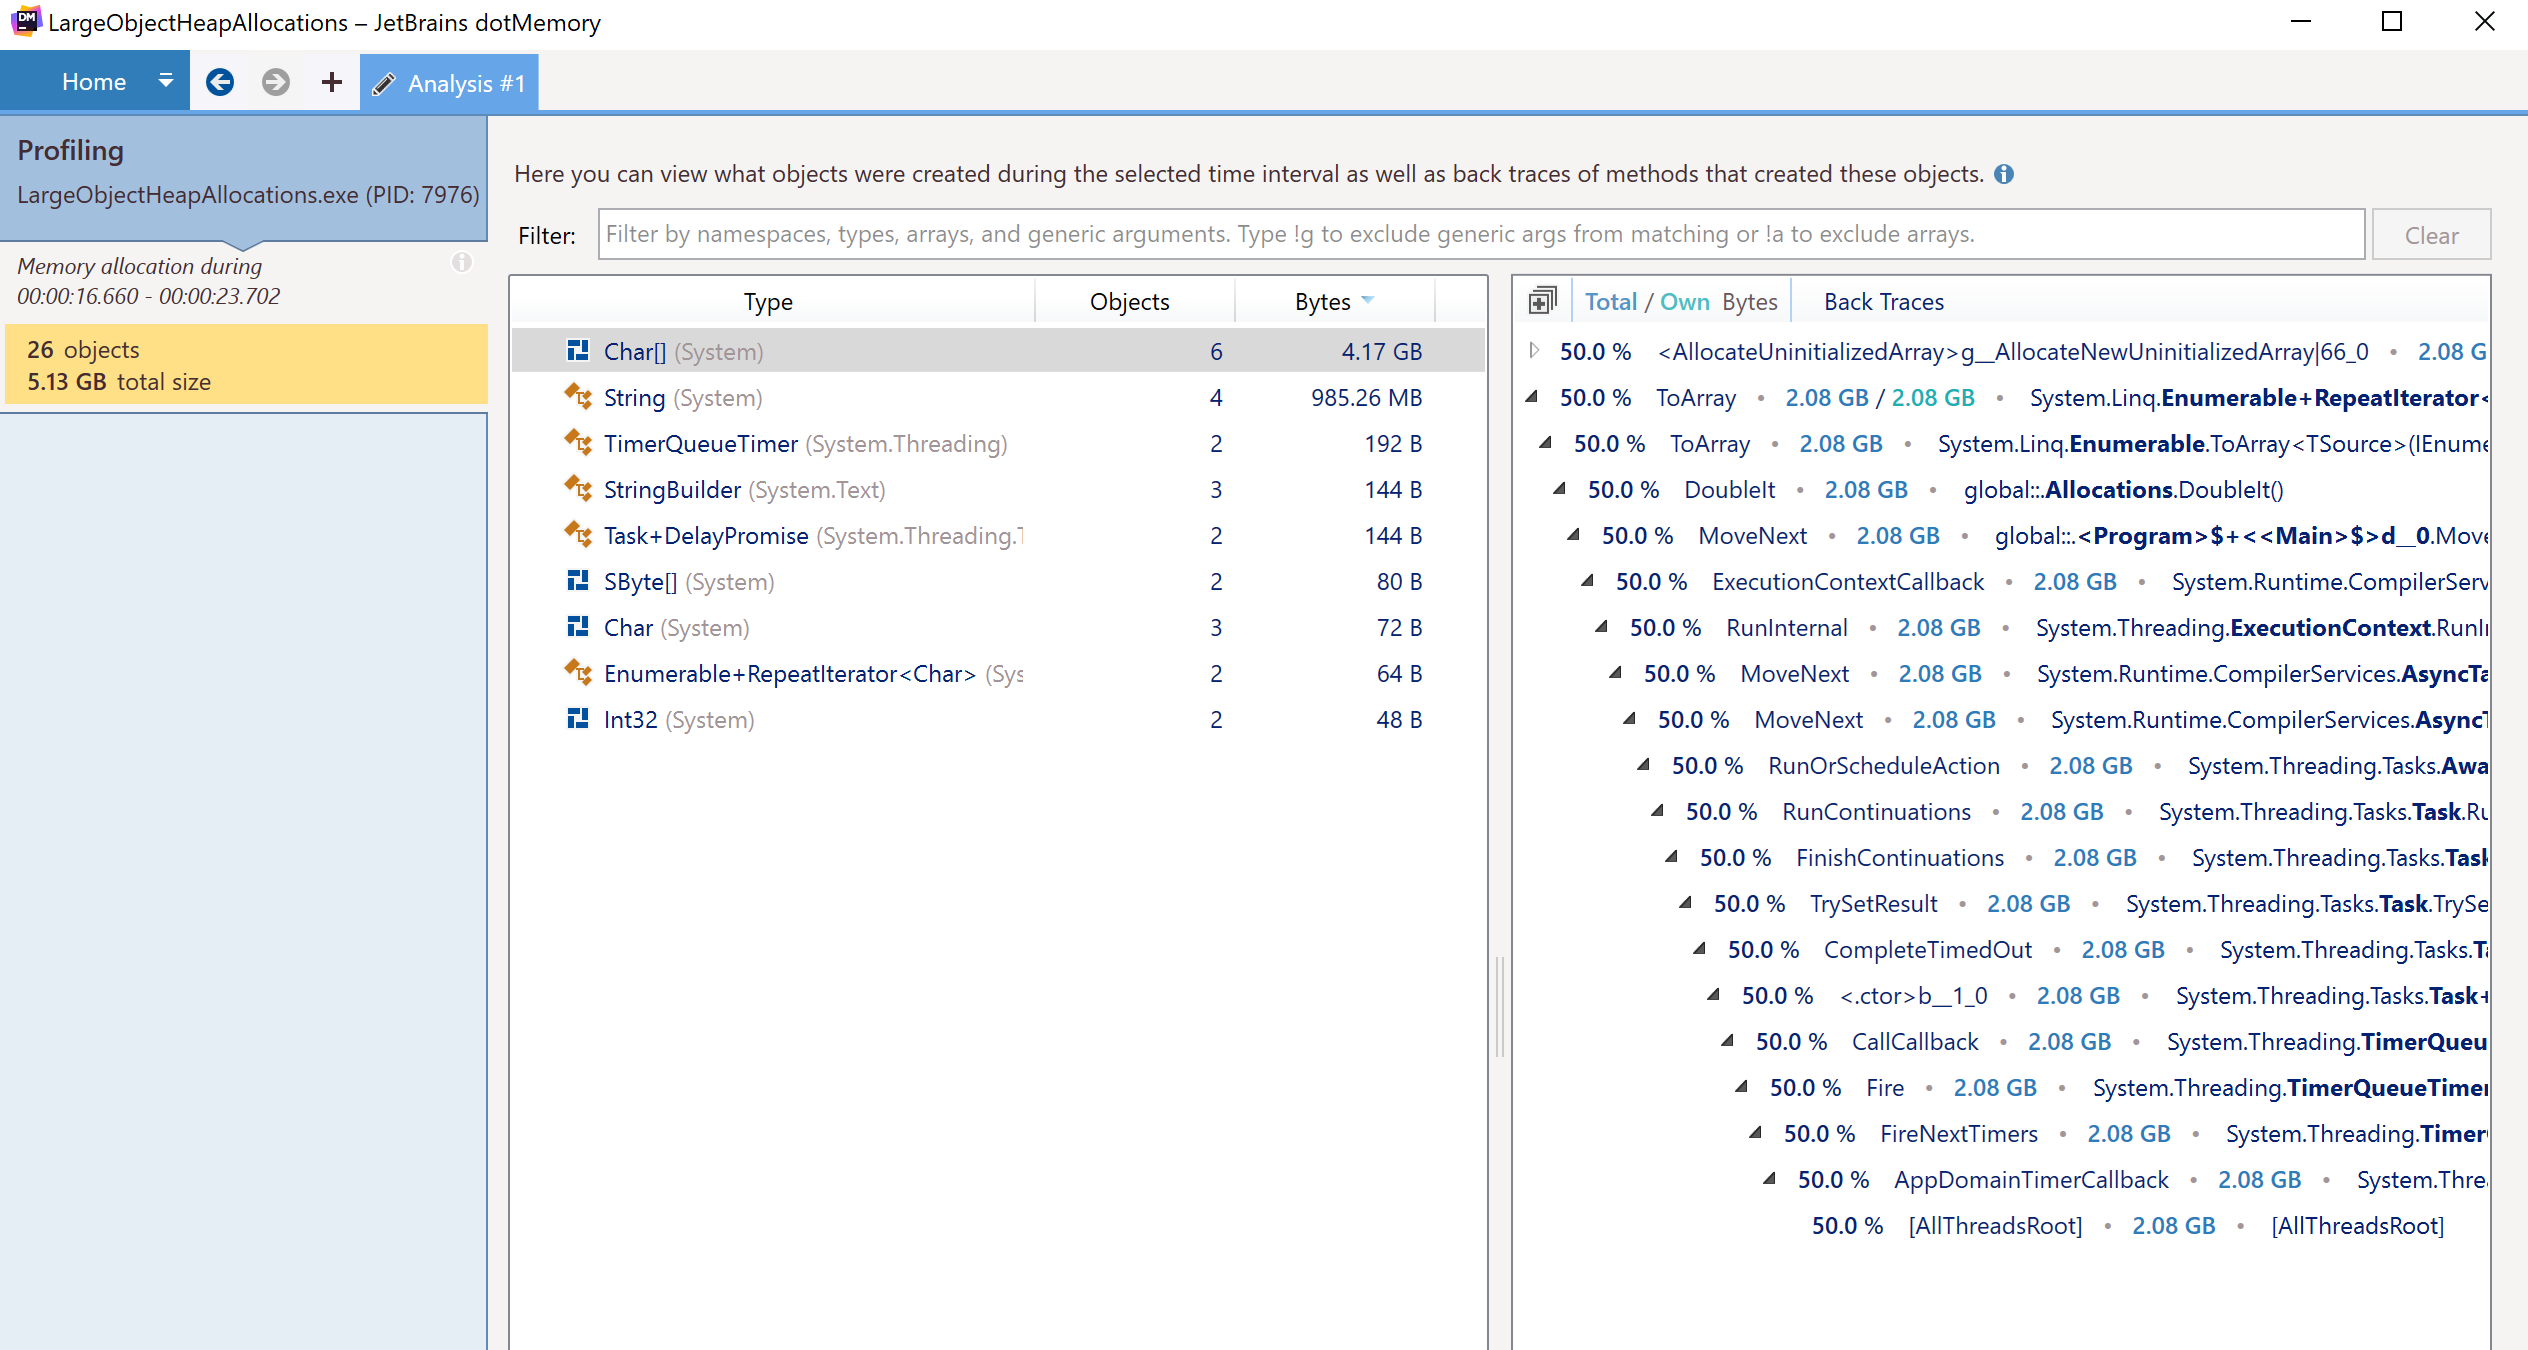
Finally, we can click the Allocated hyperlink and see our issue’s back trace, helping us determine what code was the major contributor to our performance issues.
Conclusion
dotMemory’s improved memory allocation analysis helps developers focus on visible problem areas in a profiling session and quickly determine the issue. The straightforward timeline presentation gets better with the ability to choose intervals and navigate to a stack trace. Combined with powerful .NET tools like ReSharper and Rider, it’s a potent combination to find bugs, fix problematic code, and deploy more performant applications.
Check out the dotMemory 2021.1 to try the improved memory allocation analysis and other great features, and check out the official JetBrains documentation on analyzing memory allocations.
P.S.: We also just opened the ReSharper (and dotMemory) 2021.2 EAP (Early Access Program). More profiler updates are available there, check it out.