.NET Tools
Essential productivity kit for .NET and game developers
Improved Allocation Details and Powerful Type Filters in dotMemory 2021.2 EAP

With the release of dotMemory 2021.2 around the corner, we thought we’d give you, our loyal JetBrains customers, a sneak peek at some new and exciting features. These newest improvements will make you become a memory maestro in no time!
We re-worked the allocation analysis views. Allocations grouped by methods and by call tree add more powerful filter options, and show top allocated types and back traces. These views can be accessed easily with a floating button on the profiling timeline. Other filters now let you filter value types, types, methods, and namespaces. Let’s have a look!
DOWNLOAD DOTMEMORY 2021.2 EAP (part of the ReSharper tools)
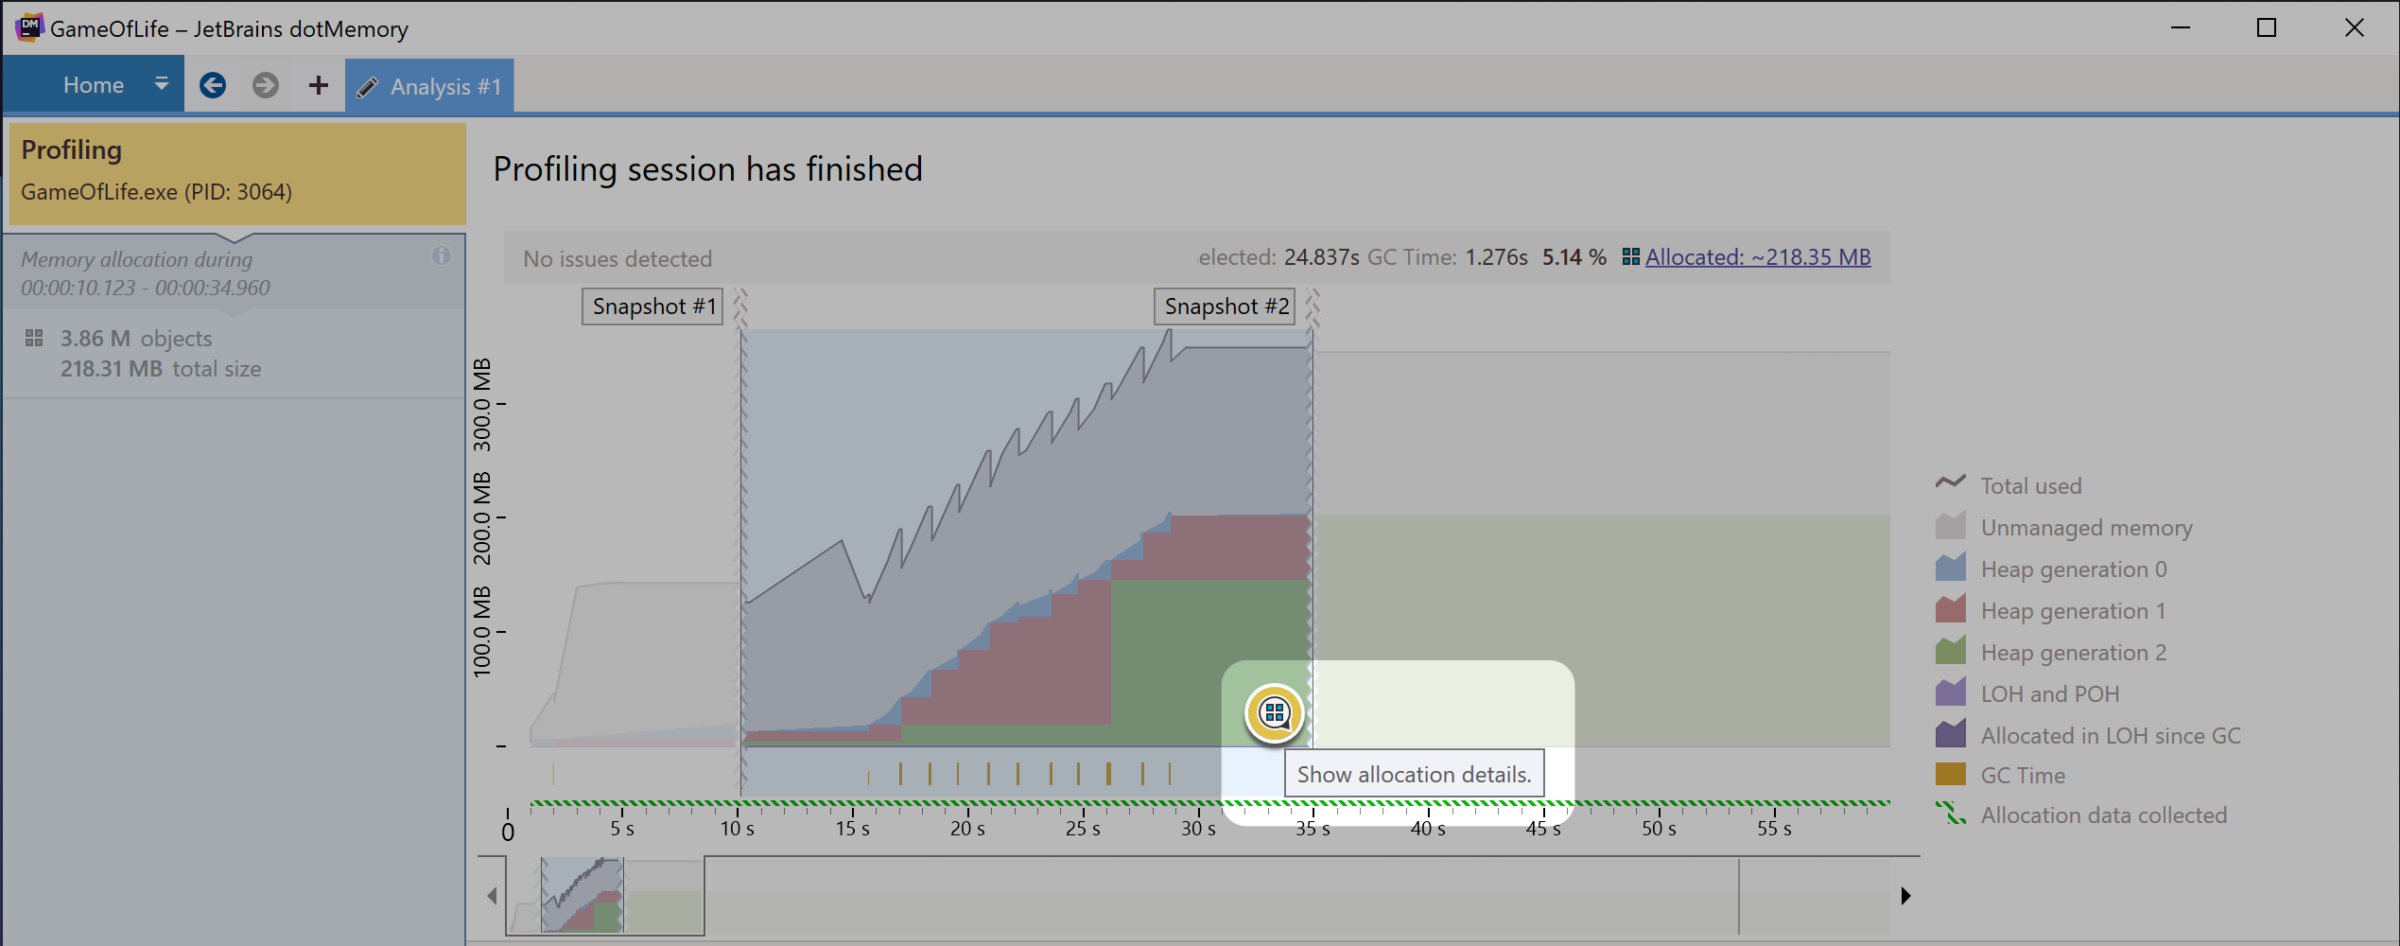
Allocation details view
Starting with the main analysis screen, we’ve improved the usability by adding a floating action button directly onto the timeline. A selection of any timeframe will show a noticeable action button. When you click it, it takes you directly into the allocations details view.
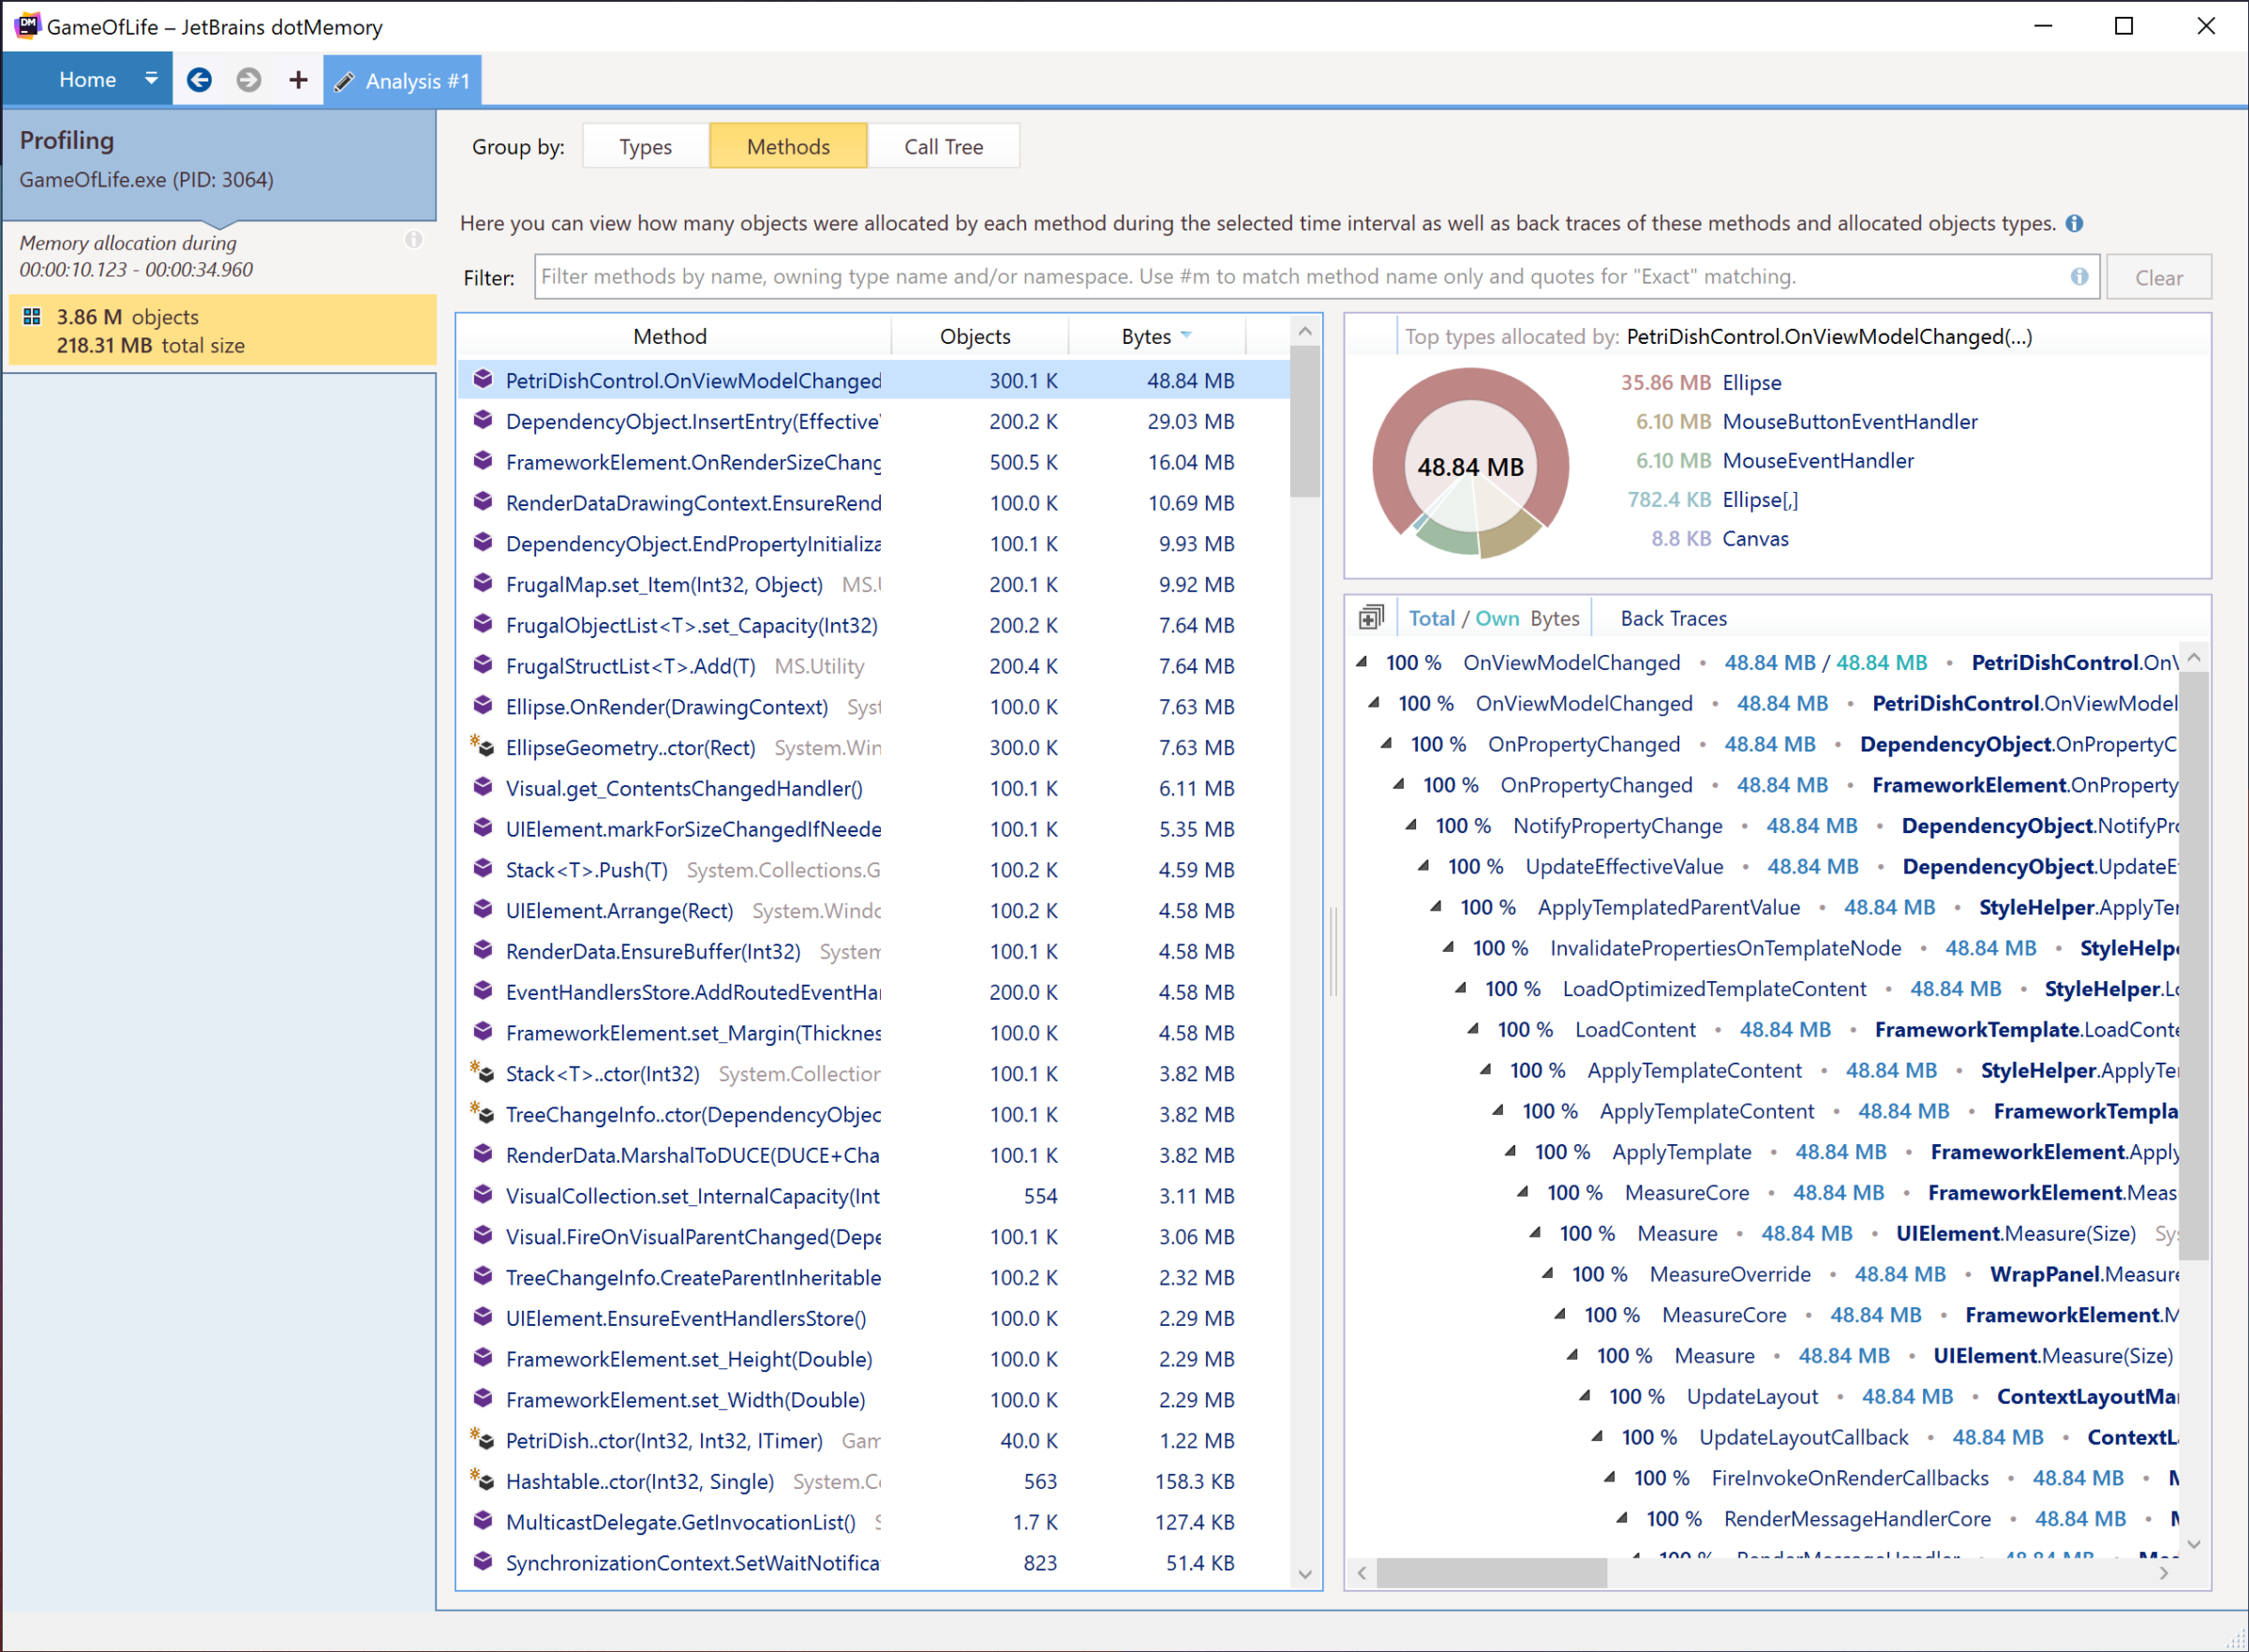
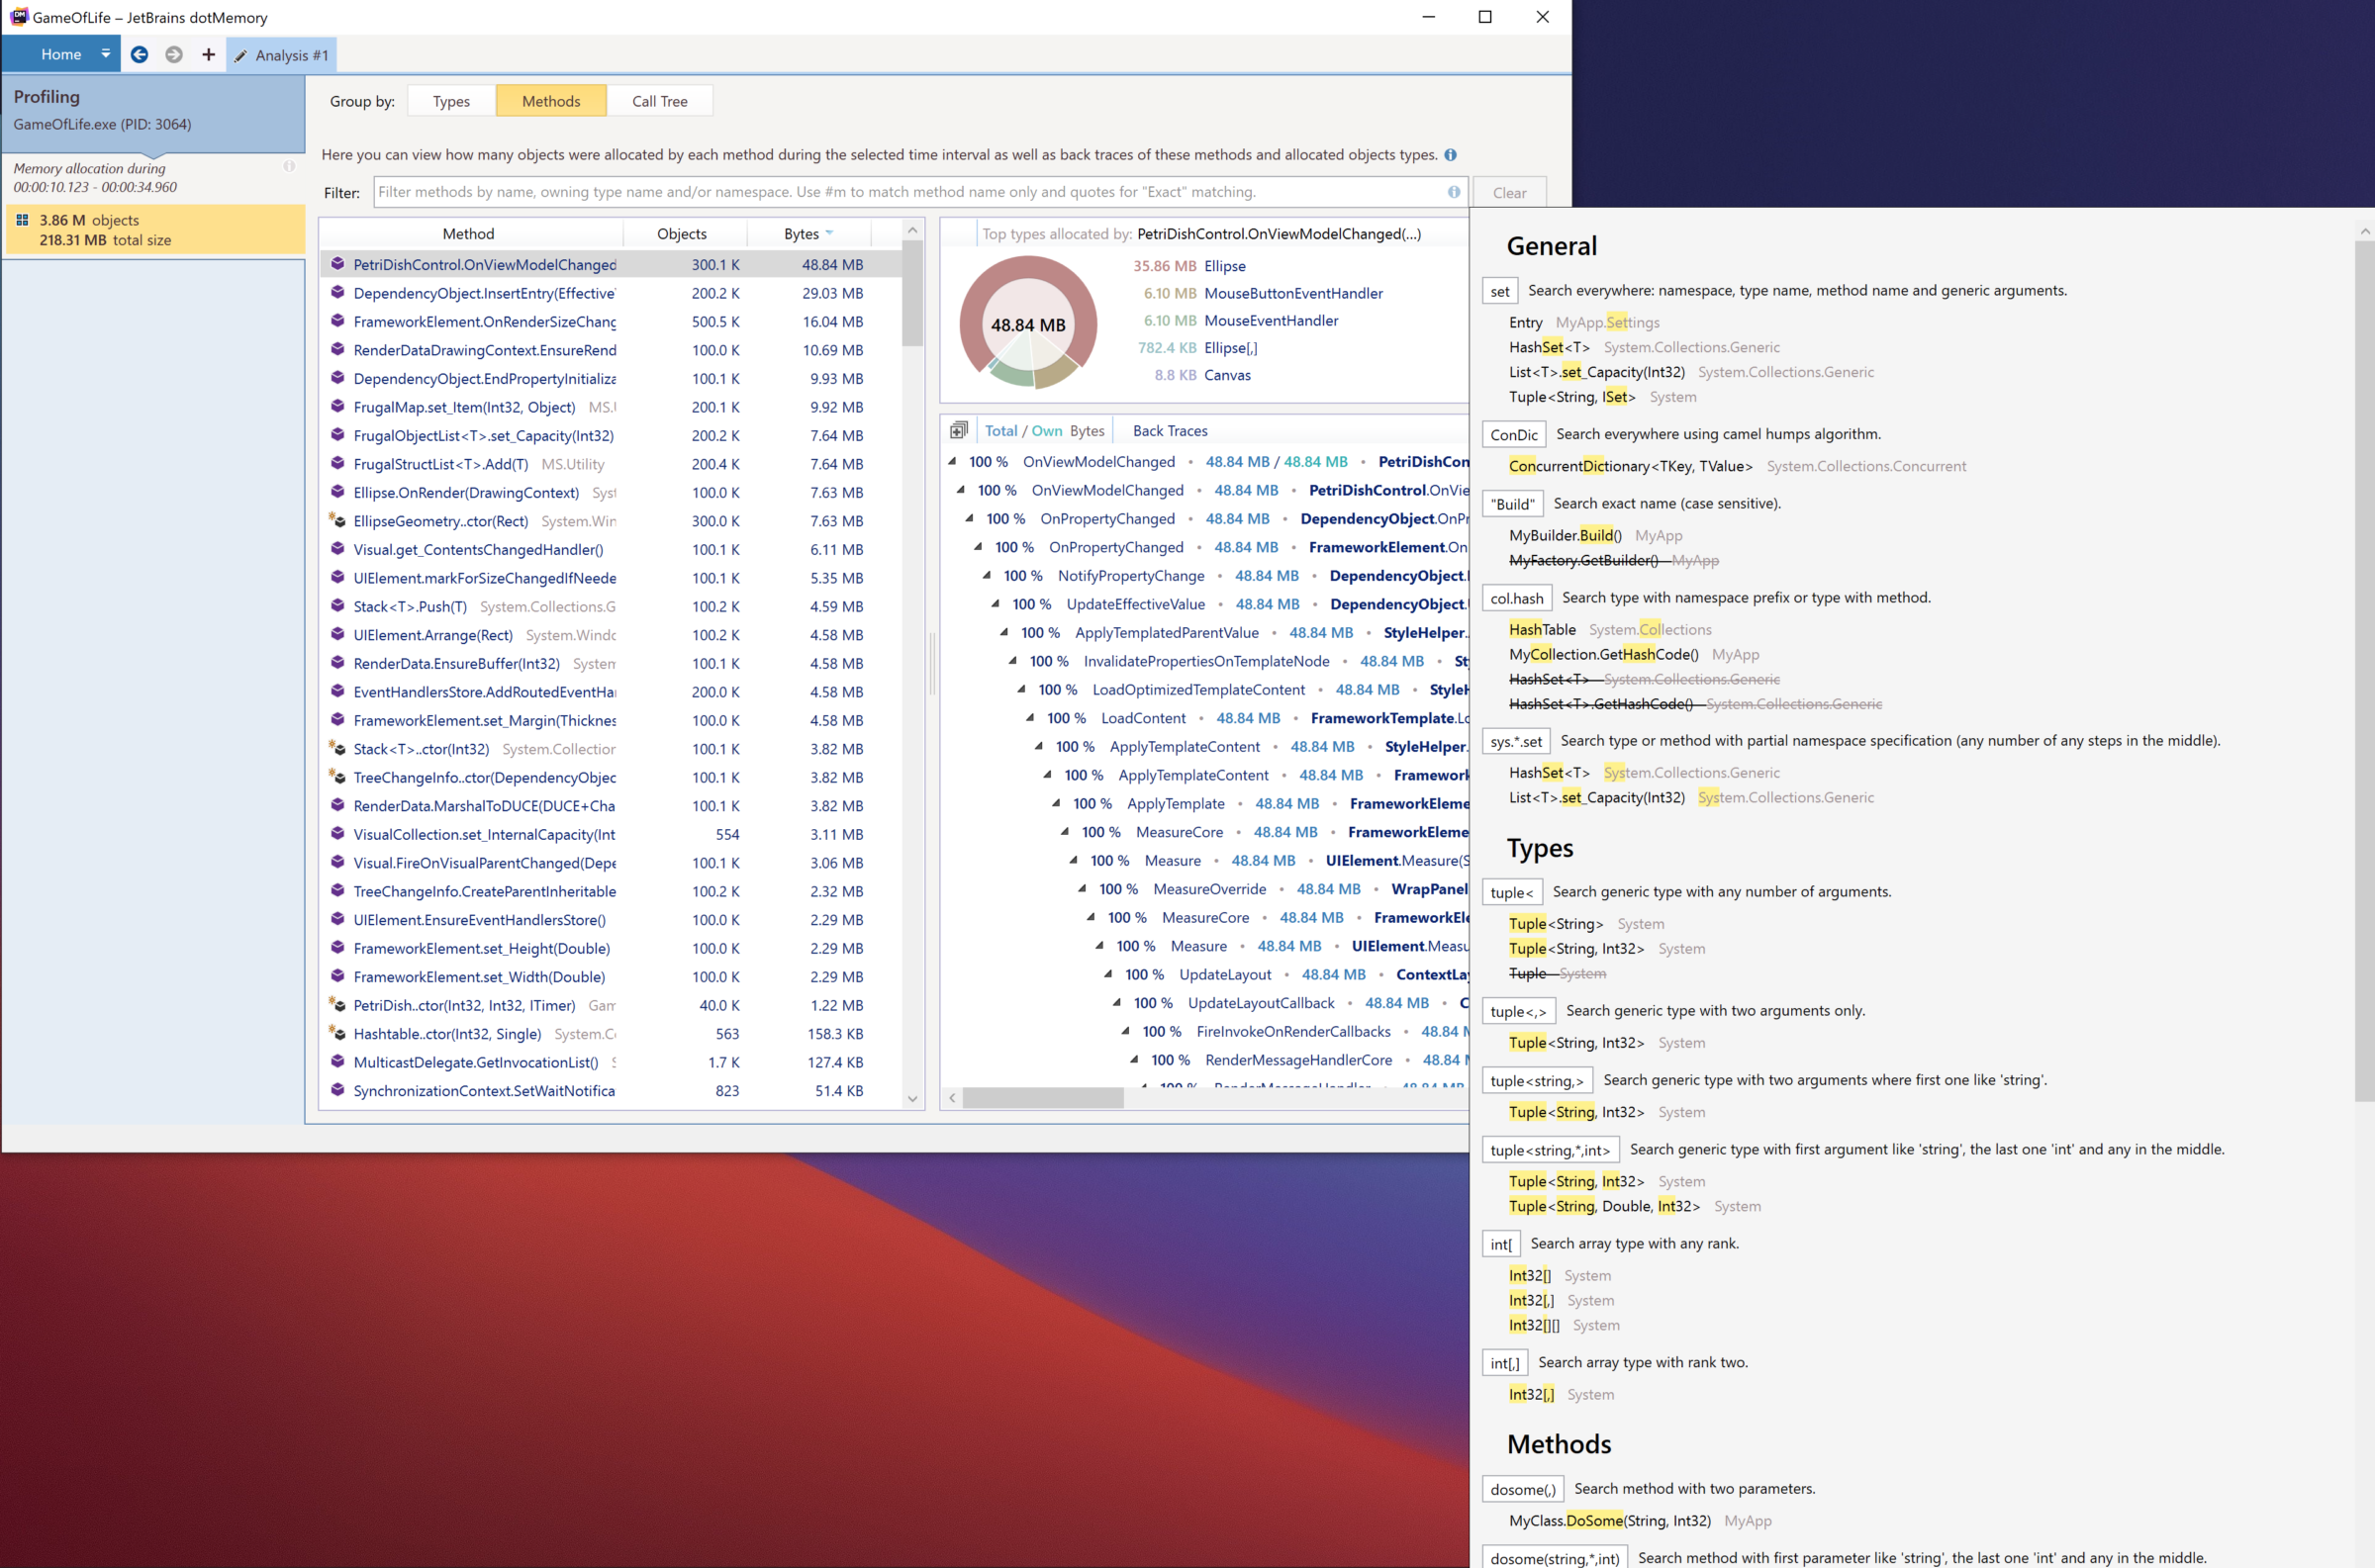
Once in the allocation details view, you’ll notice some improvements in the “Group By” view. The most notable feature of this view is allocations are grouped by methods, showing the most costly methods in terms of object allocations. On the right of the view, you’ll notice a “Top types allocated” graph, with a breakdown of the largest allocated types.
Below the graph, you’ll see the Back Traces that show you the code paths that generated those types. The Grouped By Methods view can help you quickly narrow down areas of interest for your investigation.
The redesign of this view should be familiar to dotTrace users, giving you more familiar UI elements as you use both dotTrace and dotMemory to profile your applications.
We can think of each view as a different perspective on the same data, each with unique advantages for users during an investigation.
- The “Types” view clusters all allocated objects by their type and shows stack traces for each method where objects were allocated as backtraces.
- The “Methods” view clusters the same objects by a method where they were allocated and additionally shows all stack traces as backtraces for each method with information about top types allocated in the method.
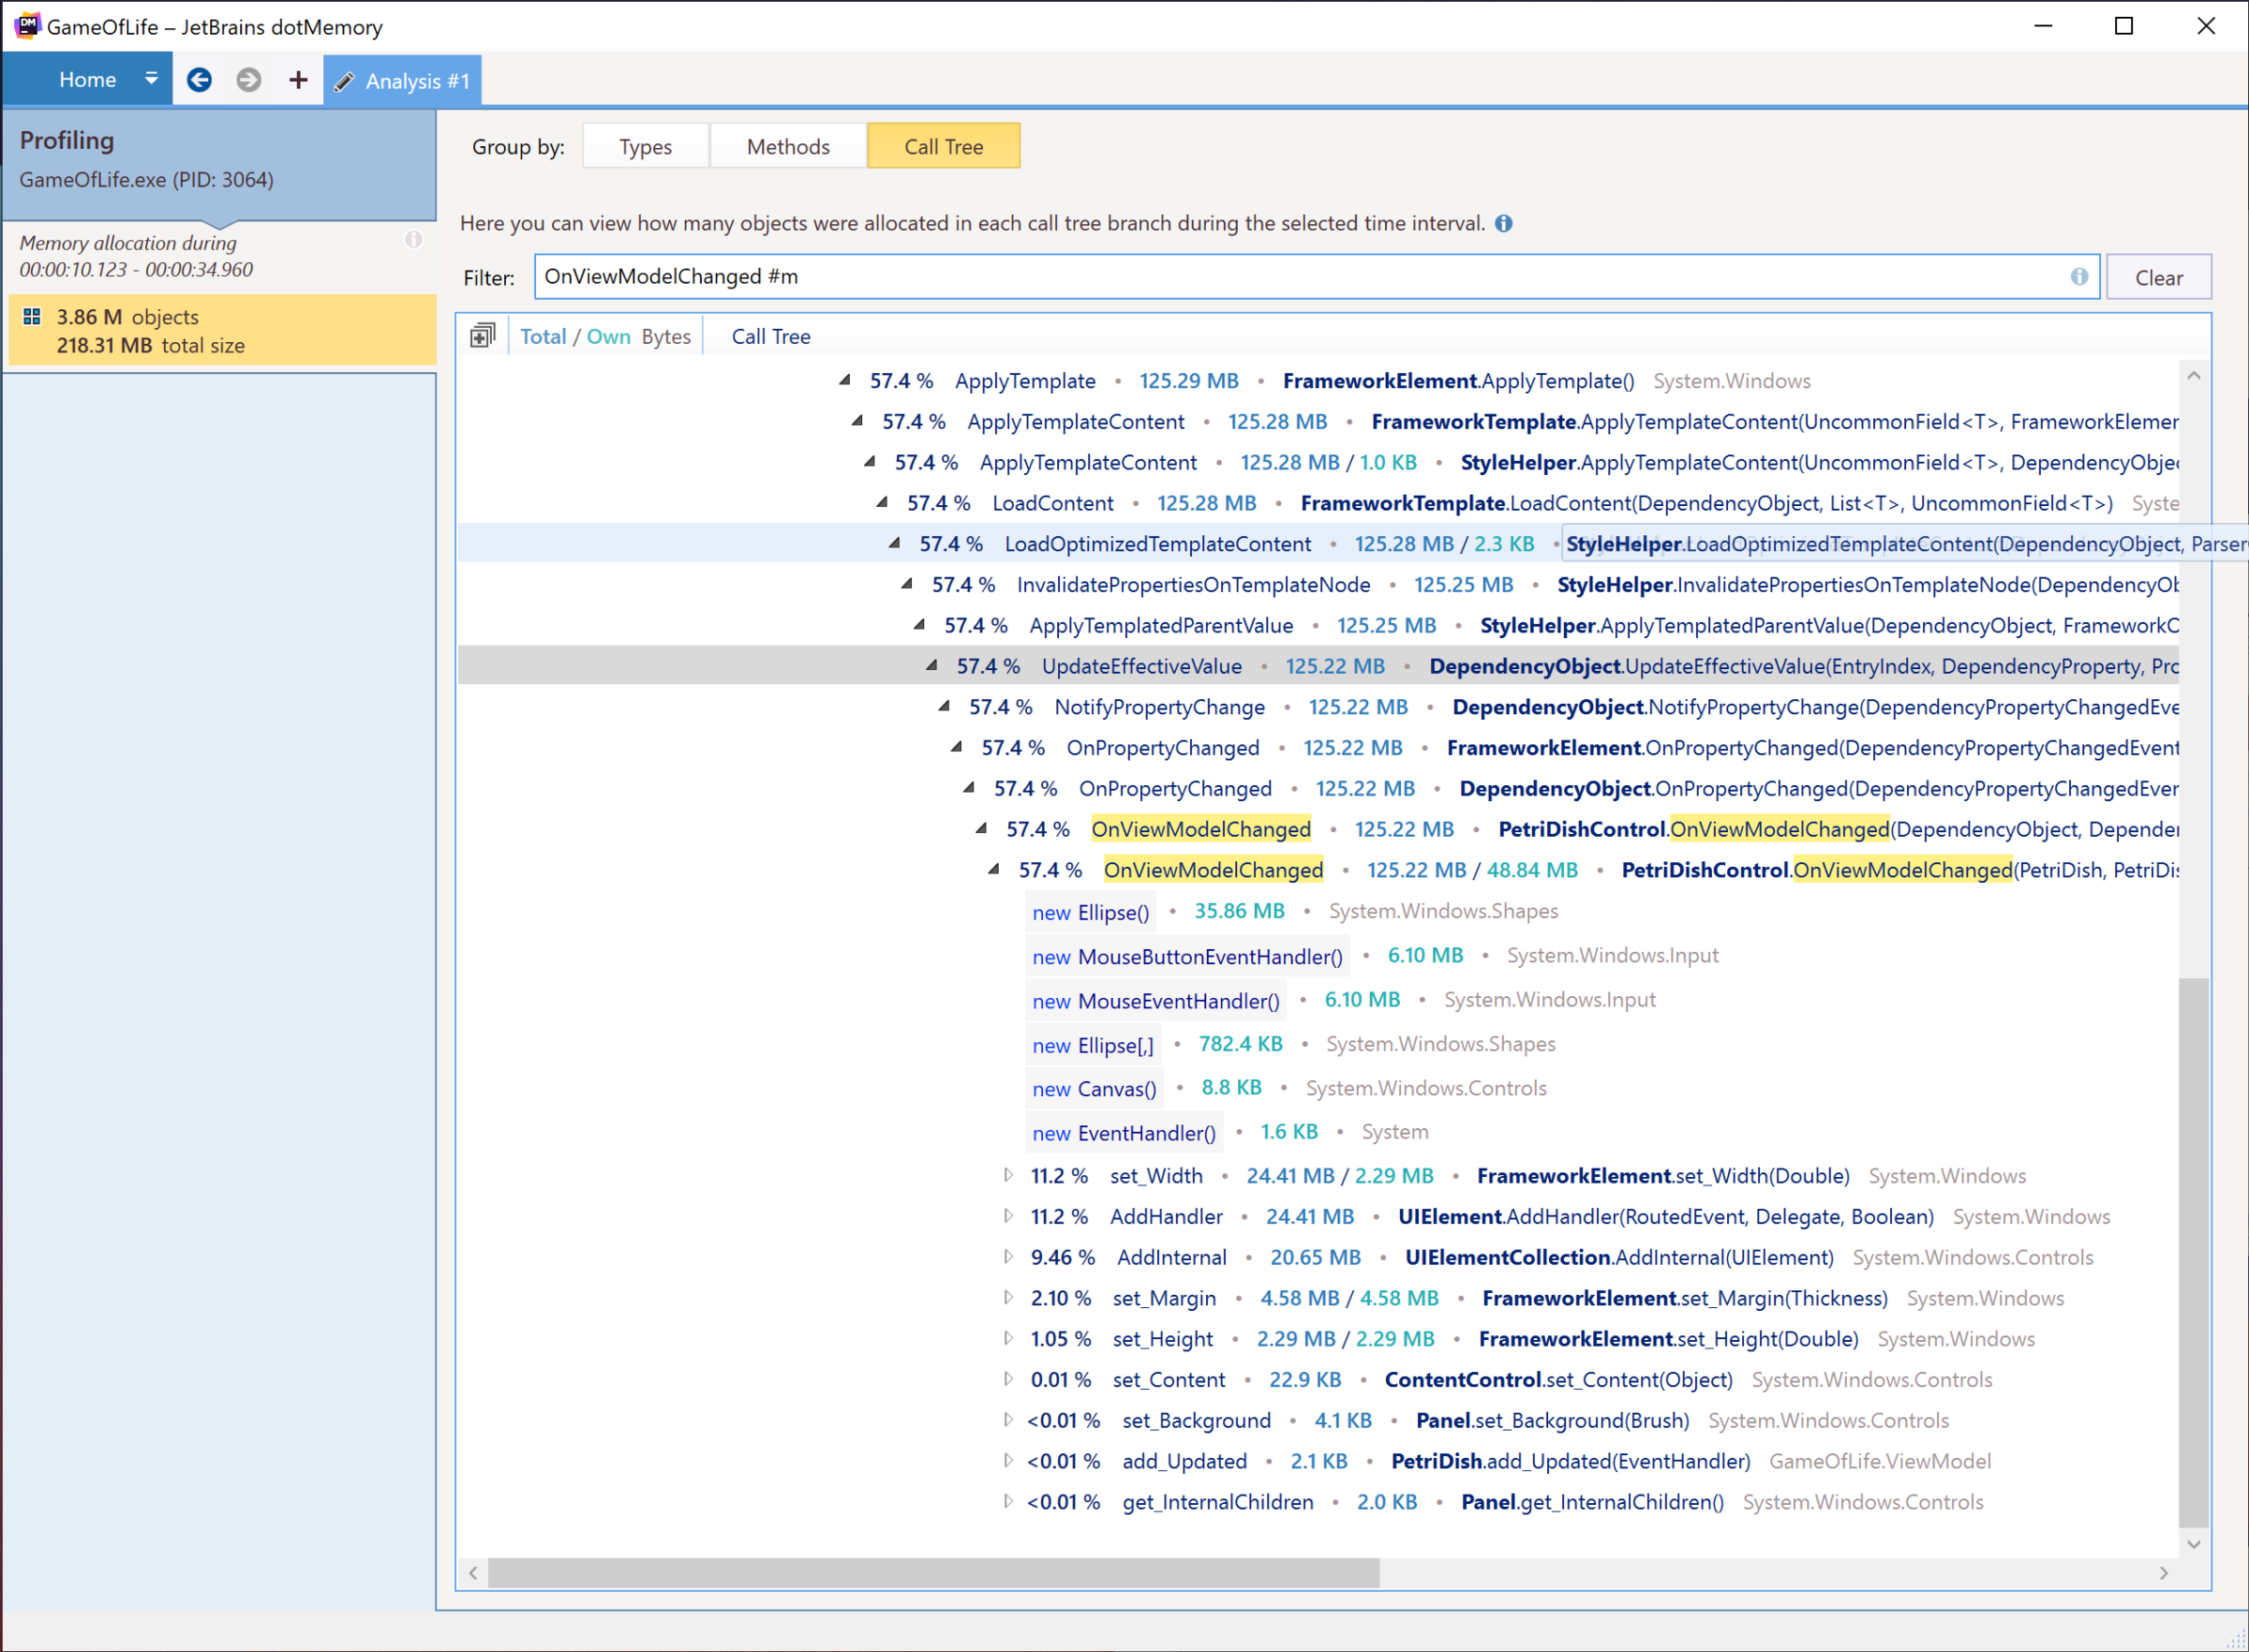
- The “Call Tree” view clusters the same objects by a stack trace. A stack trace is an attribute of an object where they were allocated and shows all these stack traces merged into a call tree.
Each view has particular strengths, and users should think about the multi-dimensionality of an investigation and utilize each of these views to get to the root of their issues.
Here is a screenshot where we’ve determined 57% of our allocations are occurring within a OnViewModelChanged method. We are also using the new filtering improvements to only search for methods in our call tree.
Filtering improvements
Speaking of filtering improvements, you can now use # keywords to limit the view results.
#structwill match value types only#cwill match types only#mwill match methods only#nswill match namespaces
These are a few of the newest options when filtering list views in dotMemory, and you can use them in combination with each other for a more powerful search experience.
Not sure how to search for that class, method, or namespace? Well, you can use the inline help menu that shows search features, and how you can use them.
Object Export Improvements
The ability to export information can help us use any tooling to further our investigation and identify the root of an issue more quickly. In the latest EAP, dotMemory improves object export functionality in multiple helpful ways:
- Export Objects with a given traverse depth. We can now limit the depth of objects we export, limiting our exports to helpful data.
- Export selected objects (one or several types) to a single file. We can initiate an export from the “Types list of Object set” and the “Unreachable objects” view.
- More options to Export single objects from “Instances view of Object set”. We can also “Export all objects” from the “Object Set” view and the “Outgoing references” view for any object instance.
In general, if you’re looking at an instance object instance in any view, you’ll likely find it easier to export the information to share with other team members.
What else is there?
There are more notable improvements in dotMemory 2021.2 EAP!
When you copy a stack trace in dotMemory and switch back to ReSharper or Rider, the IDE will expand the stack trace in the Stack Trace Explorer. It helps you quickly navigate and find the code under investigation. Just one more way JetBrains products provide a fully integrated experience for developers!
If you are using the command-line tools, you now have the ability to enable/disable allocation tracking on-demand via service messages. This enhancement enables you to have more control during sessions where the GUI is unavailable. Service message examples include:
##dotMemory["collect-allocations-on"]
##dotMemory["collect-allocations-off"]
Users can write service message commands either to the standard input or feed the utility a file with commands using the --service-input option. Developers can access a detailed description of all service commands using dotMemory help service-messages.
A new quality of life improvement comes in the form of garbage collection (GC) during data collection. When you enable or disable allocation data collection, dotMemory will force a garbage collection. Forcing GC will help avoid cases when allocations are already enabled but no traffic data is available because GC has not occurred yet.
All the features described in this post are available in dotMemory 2021.2 EAP (part of the ReSharper tools). Please download it and give it a try. And if you have any feedback, please let us know.