.NET Tools
Essential productivity kit for .NET and game developers
Case Study – How Profilers Point Out Heisenbugs

Some memory issues are non-critical, but rather annoying. They occur once every couple of months and then disappear again. Of course, these annoying bugs only show up once an application is operating under production conditions. However, such problems can often be solved using a profiler. Shyam Sundar shares one such story in this interview.

Hey Shyam! Could you briefly introduce yourself and tell us about the activities you are mainly involved in at work?
I’m Shyam, and I live in Culver City, California. Currently, I work for Amazon, but until recently, I worked for a company called BitTitan. I helped develop their flagship product called MigrationWiz. It’s a SaaS product that helps people migrate their data from one cloud provider to another. My team specifically worked on Google workspace migrations to help people move to or from the Google workspace tenants. So it is the business of migrating terabytes of data every day.
Could you tell us the most memorable story of how you encountered performance or memory issues in your application? How did you find the problem and what steps were taken to troubleshoot it?
The most memorable story is about one major issue that was going on in production. This had been going on for almost six months or so. It was more of an intermittent issue that we used to get at some of the service workers. We noticed the issue because running migrations would suddenly stop and would get reassigned to another worker. Looking at the logs, we found an out-of-memory exception, and since the machine would abruptly shut down given the way we implemented our logic, it was hard to find out any more about what went wrong.
We tried using several tools, but our investigations always led to different parts of our codebase with no clear indication of the issue. Being out of options, our only solution at the time was to restart the entire virtual machine, service worker, and all.
Once we were introduced to dotMemory, I wanted to try to see if I could finally get to the root cause of the problem. We tried to compare snapshots at particular intervals of the entire migration process, i.e. during the start of the migration, initialization phase, and migration phase. We then found out that we would be performing a significant amount of XML transformations during the export phase. We quickly realized that one of the transformations was always causing the out-of-memory issue. Finally, we made some progress. We discovered that the exception was being caused by the XmlSerializer class. The fix for this problem was simple enough: to dispose of the instance once we had parsed the XML file and cached it in an internal data structure. It was a pretty annoying issue that happened once every few months, and most people wouldn’t really care about it. But for me as an engineer, it was the annoyance of not knowing, and I wanted to solve this issue.
What about testing? Why wasn’t the problem detected during testing?
We didn’t find this issue during testing, mainly because of the really large data set that we were seeing from some of the customers. In “typical” use cases that we had tested for, this scenario would not occur.
Why did you decide to adopt dotMemory at your company? What are the key benefits you get from using it?
Our environment primarily consists of virtual machines within Azure’s infrastructure. We do this to share resources efficiently across multiple migrations. That means we see a lot more of these memory issues cropping up because we do tend to run multiple migrations on a single VM. And this essentially means that all these practices are competing for memory. That’s when you see all these interesting issues happen.
One day, we started seeing too many memory issues. We were trying to find a better tool that could help us to figure these issues out before we suddenly faced them in production. That’s when I stumbled across dotMemory. Basically, I just downloaded the trial version, and after trying it out, I found it pretty helpful.
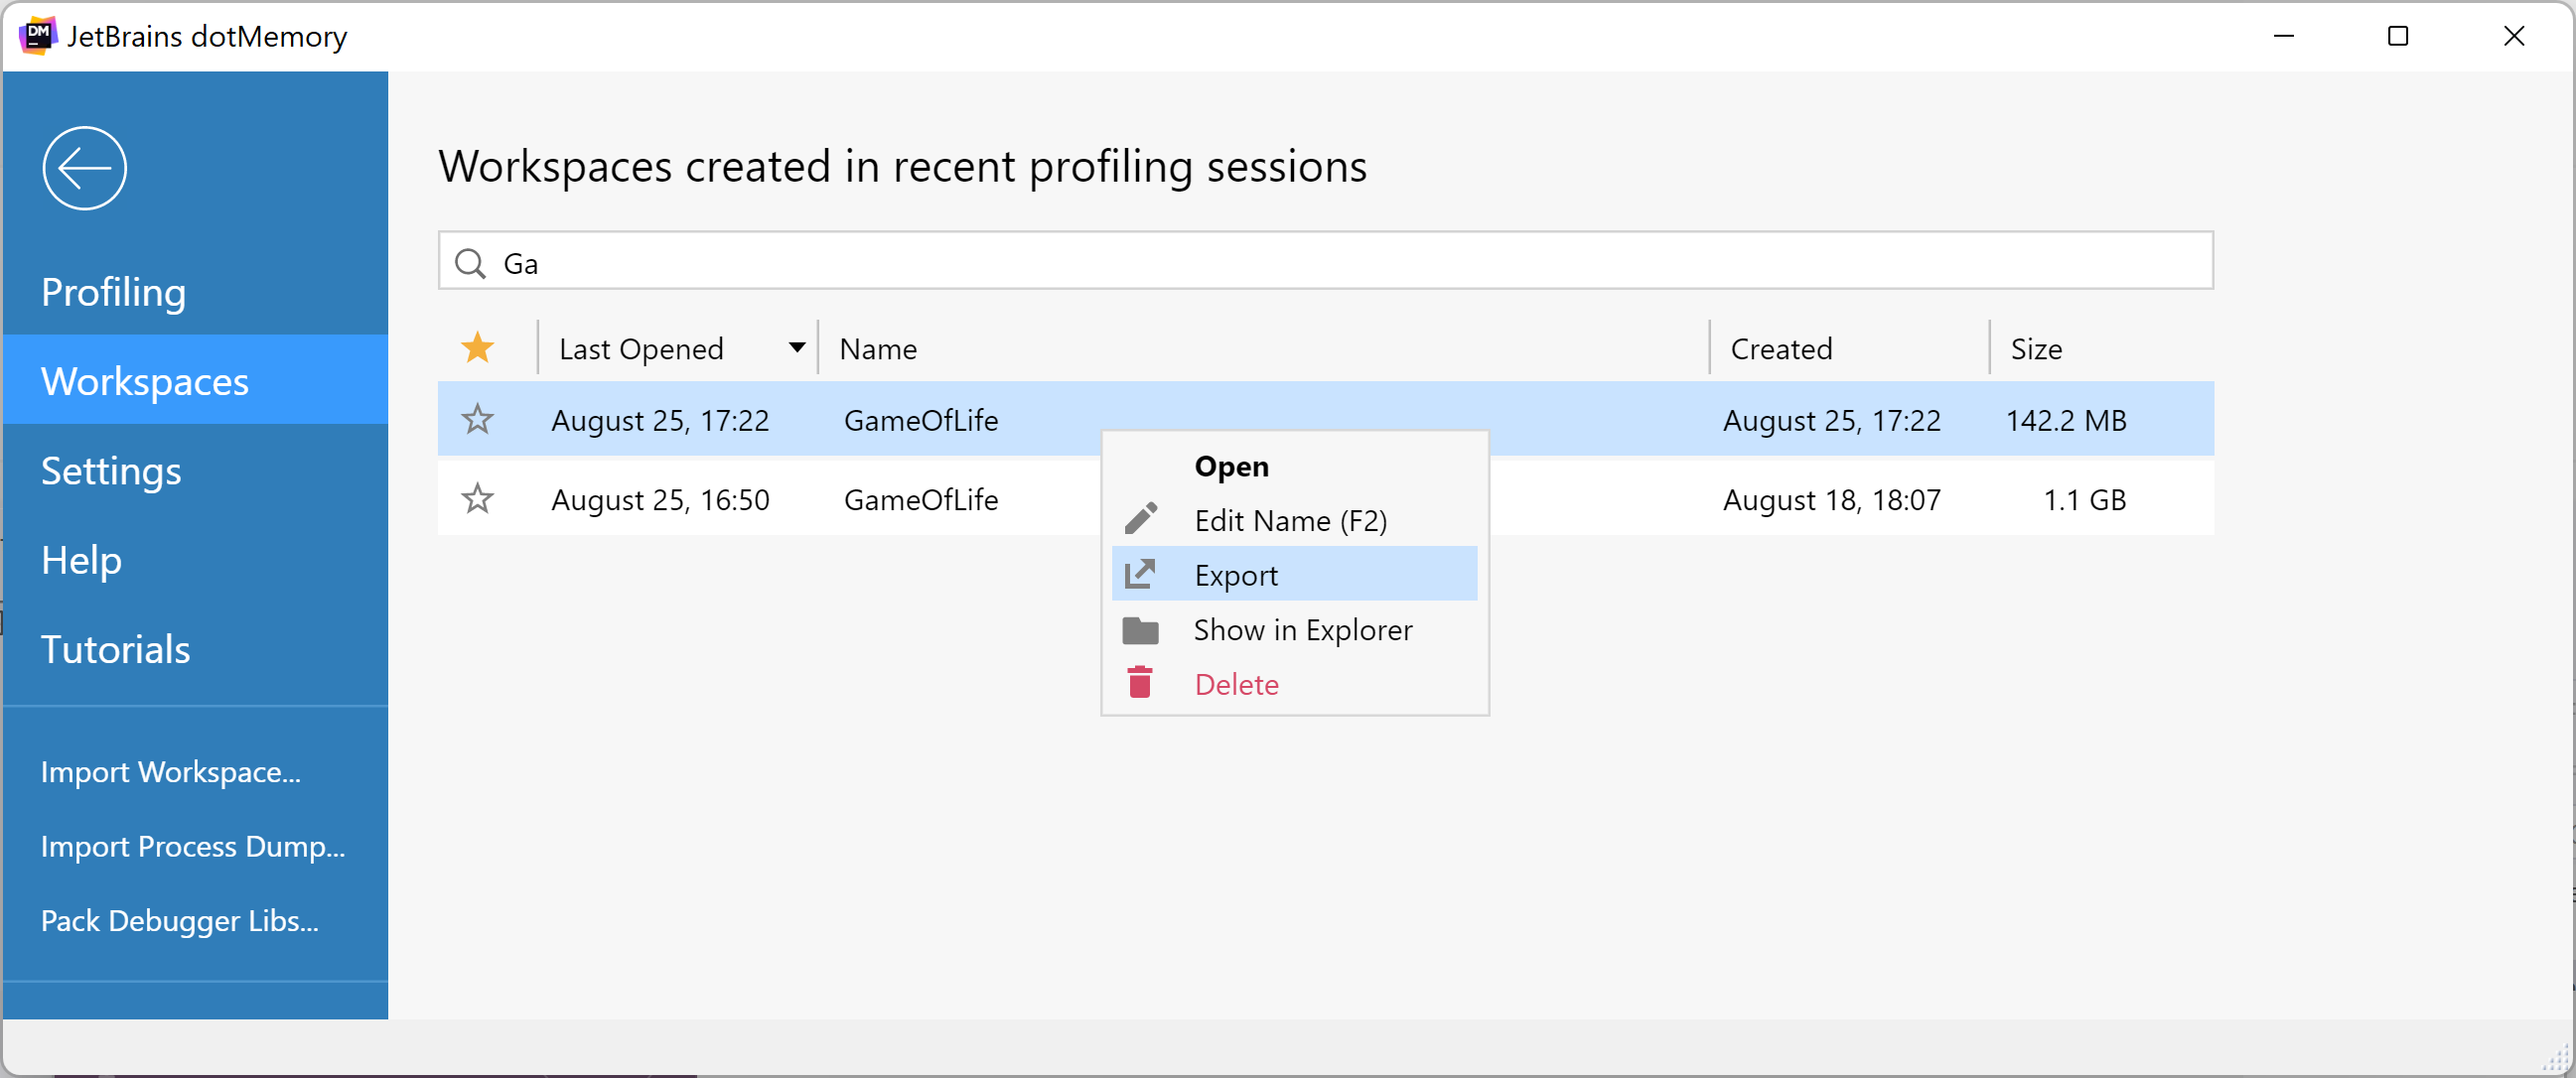
I think the main reason why I went with dotMemory was basically the ease of use and the way it was built into Visual Studio. I can just click on debug, and it pops up. Everything is set up for me, including the workspace. By the way, dotMemory allows me to simply save the entire workspace and then come back to it later. Moreover, I can share it with my other colleagues, so they know what I am trying to do. It’s brilliant.
Is profiling an integral part of your development process? If so, how did you embed it into your working processes?
My focus now is to ask team members to start writing unit tests using dotMemory Unit as well. Every time we come up with a new piece of code or a new feature, we always want to ensure that memory utilization is correct. In my opinion, it’s a good habit for developers to write unit tests. I do see that it’s going to be useful in the future because we can catch memory leaks early while the new code is fresh in our minds. I would say having these unit tests to hand has already ensured we’ve been more careful about how much memory our application uses. Since we run multiple migrations on the same machine, developers are more prudent in ensuring each migration only uses an upper-bound of memory. For example, when reading larger files, we’ve ensured that they’re read in smaller chunks of streams so that we don’t load the entire object in memory at the same time.
Does the profiler help you identify other problems you didn’t even know about?
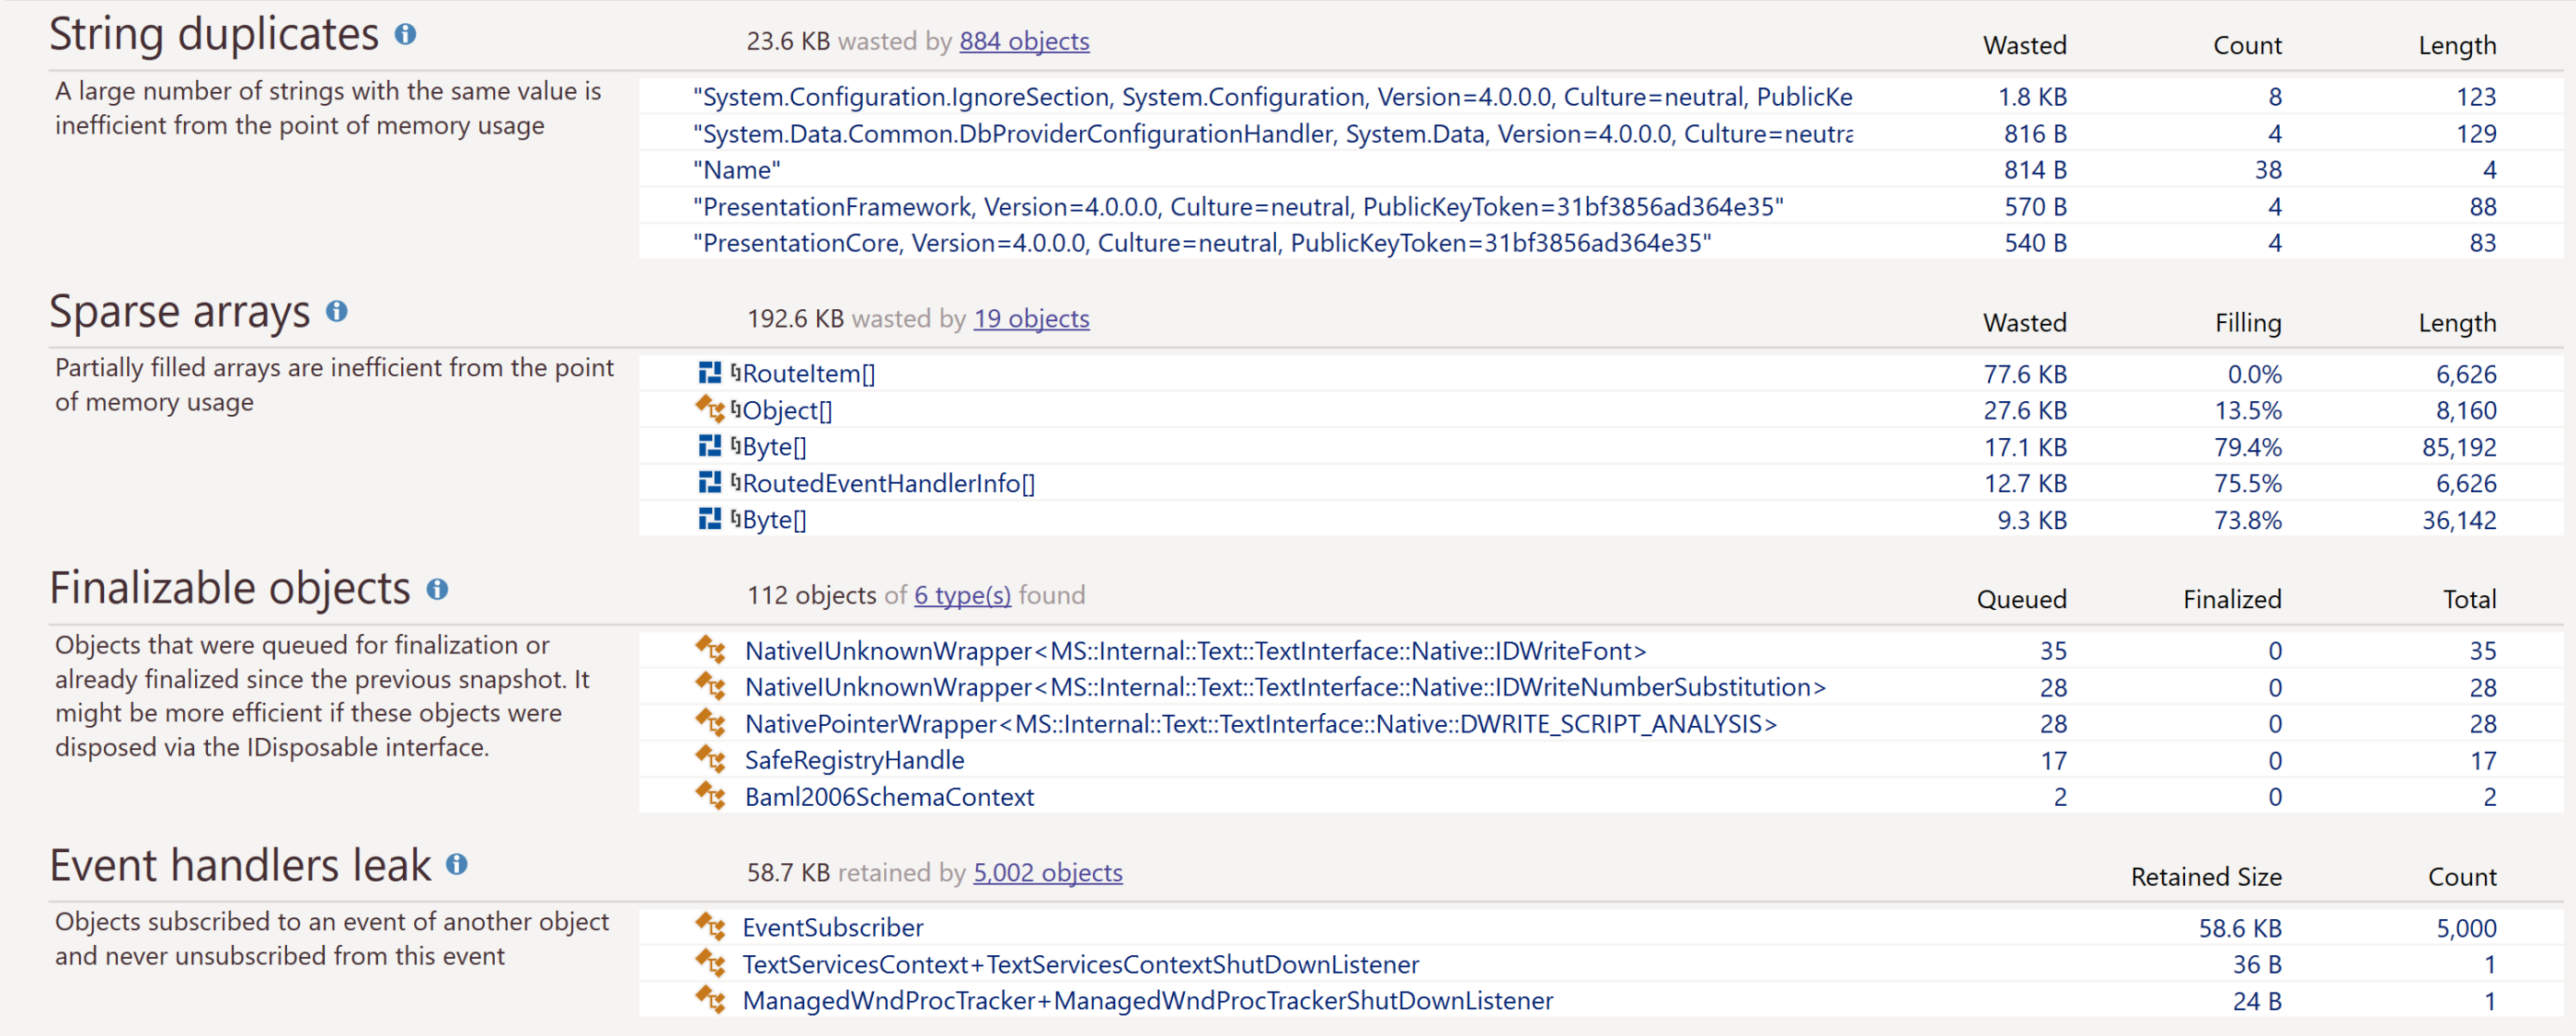
Yes! Over the past year, we have used dotMemory frequently for many production issues that we’ve been seeing, and it has helped solve many of these issues. And what’s more – every time I’m running dotMemory, I can also catch other minor mistakes that we have made. It shows me on the UI if there are any other undisposed objects, event handlers that haven’t been disposed of properly or that are holding on to objects that they shouldn’t. And now it’s easy for us to perform the code review process as well. Every time someone puts out a pull request for code review, I just pull it down and take a look at it using dotMemory as well. I simply run the program and make sure that there are no straightforward issues that we should not be missing.
In your opinion, how often should developers use profiling tools if they want to build high-quality software?
In my opinion, developers should technically integrate dotMemory and other profiling tools inside their development process. It should be a continuous process that you do every sprint to help you find issues proactively, rather than suffering through the stress of production issues and retroactively wishing you’d done more due diligence.
As for us, then we also have some automations that we have set up in our CI/CD pipeline as well. And we try to ensure that all these unit tests and integration tests run every single commit that the developer is doing. This really helps us make sure there are no leaks before the software goes into the next phase of our release cycle.
How was your experience getting started with a profiler? How straightforward was the process of profiling your applications?
Compared to other tools, dotMemory was a walk in the park. I literally didn’t have to do anything at all. I watched a playlist on YouTube, which walked me through all of dotMemory’s features. The videos were pretty short ones, like two or three minutes each, and that gave me a very quick overview of how dotMemory works. All you have to do is launch dotMemory, and it automatically starts running the profiling process for you. It’s pretty similar to the Visual Studio native tools in that sense. However, I definitely think using dotMemory is much better, mostly in terms of the experience that I get, the ease of setting up, and even connecting to a remote machine on the cloud.
Would you like to share some non-obvious tips and tricks with others?
Try to mix and match different tools as well depending on what kind of situation and debugging issues you have. Remember, there is no one solution for everything!
We’d like to thank Shyam for taking part in this Q&A session.
Do you also optimize applications with dotMemory? We invite you to share your experiences with us. If you’re interested, please let us know by leaving a comment below or contacting us directly.