
.NET Tools
Essential productivity kit for .NET and game developers
Debugging for .NET in VS Code and Cursor: The #1 Requested Feature Is Here

For over a year, the most consistent question from our users and community has been clear:
When will the ReSharper extension support debugging?
We heard you. And with the 2026.2 release, the first version of the debugger is now live. Built on the same core debugging engine that powers JetBrains Rider, this implementation is optimized for VS Code-compatible environments, including VS Code, Cursor, Google Antigravity IDE, Devin Desktop, and Kiro.
Why it matters
Debugging isn’t just a feature – it’s the backbone of your development workflow, whether you’re writing code manually or iterating with AI.
For VS Code users: everything you need for professional C# development
With the addition of debugging, ReSharper now completes the picture for professional .NET development in VS Code. It unifies inspections, Solution Explorer, refactorings, navigation, unit testing, and now debugging for C#, Razor, Blazor, and XAML, all backed by the engine that .NET developers know from Rider. If you’re currently using Microsoft’s C# extensions, ReSharper is the JetBrains alternative that brings the full stack together into a single extension.
For Cursor, Antigravity IDE, Devin Desktop, and Kiro: the most complete .NET tooling on your editor
If you’re a .NET developer working in Cursor or another VS Code-compatible editor, this release matters more than the headline suggests.
Microsoft’s C# Dev Kit and the official C# extensions are licensed for use only in genuine Visual Studio Code – they don’t run on Cursor or other compatible editors. Until now, that left .NET developers on those editors without a first-party debugger or a full-featured C# extension from a trusted vendor.
As of 2026.2, ReSharper is the most complete .NET option available on Cursor, Antigravity, Devin, and Kiro – and that includes debugging. If you’ve been using a code editor tailored to AI-assisted workflows while keeping a separate IDE open for serious .NET work, that round-trip isn’t necessary for the basics anymore. You can review, refactor, navigate, and now debug from a single editor.
What you get
The initial implementation of the debugger brings the following capabilities:
- Breakpoint management: Set, enable, disable, and configure breakpoints directly in the editor gutter, including conditional, hit count, and dependent breakpoints, as well as logpoints.
- Real-time variable and expression inspection: View real-time values, watch expressions, and call stacks through the VS Code Debug View.
- Full step navigation: Control execution flow with
Step Over,Step Into, andStep Out, fully aligned with VS Code’s debug adapter protocol. - Launch-and-attach support: Start new .NET/.NET Framework/Mono debugging sessions or attach to running processes directly from the code editor. Hint: Legacy .NET Framework launches can fail (e.g. WPF). Workaround: run the app first, and then attach the debugger to the process.
- Debugging unit tests: Set breakpoints in your unit tests and run them under the debugger directly from the editor.
Configuration and migration support
The extension automatically creates debugger configurations for your runnable projects and reads settings from launchSettings.json.
You can directly reuse existing launch.json files from other debugging solutions (including Microsoft C# Dev Kit and NetCoreDbg), so no manual JSON editing is required.
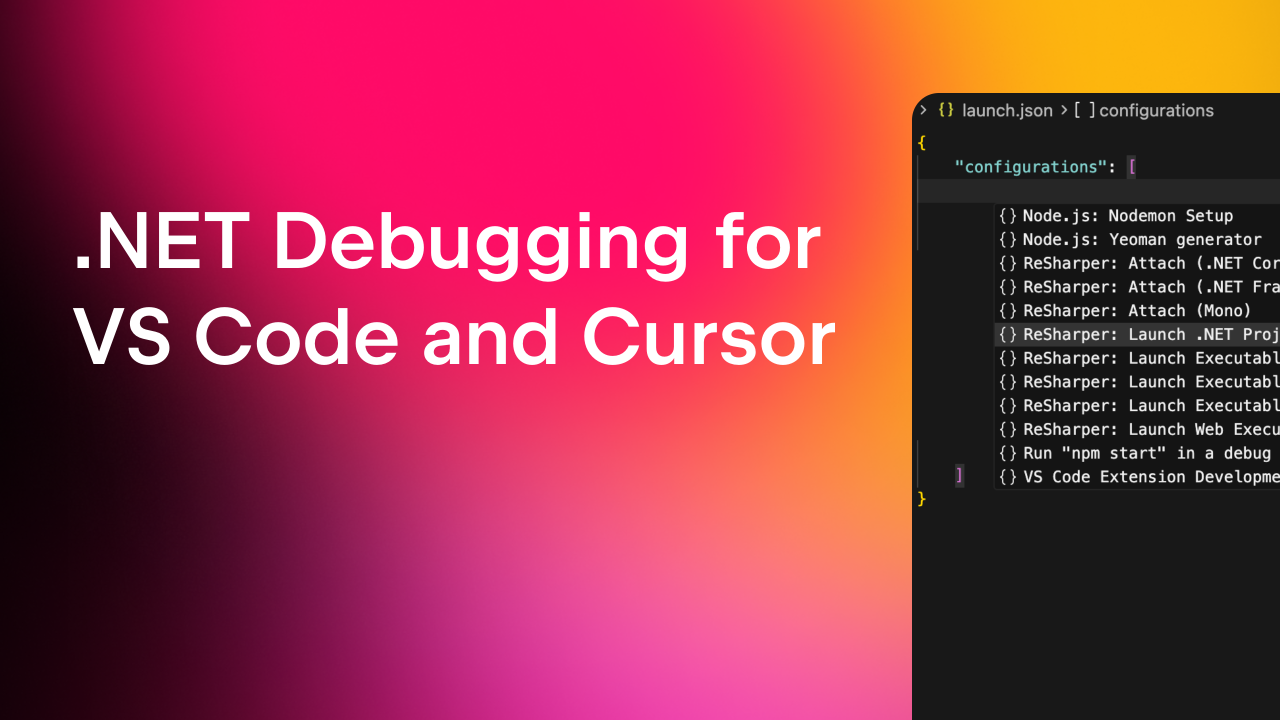
If you prefer to set up run/debug configurations manually, you can do so by editing launch.json. ReSharper provides snippets with predefined configuration templates: attach to a process, launch executables for .NET, .NET Framework, Mono, and web applications, or launch a .NET project. Once you unfold a template, ReSharper offers code completion to help you fill in the essential parameters, such as the path to a binary or the project you want to launch.
Compatibility note: other C# debugging extensions
VS Code allows only one extension to be registered as the debug engine for a given language. If another extension that provides C# debugging capabilities – for example, Microsoft’s C# Dev Kit – is installed alongside ReSharper, the ReSharper debugger cannot take over debugging sessions. To use the ReSharper debugger, disable or uninstall any other C# debugging extensions, and then reload your code editor.
New to ReSharper?
If this is your first time hearing about ReSharper for VS Code-compatible editors, the original announcement post covers the basics.
Share your thoughts!
This is just the beginning. We brought the core functionality and would love to hear your feedback and requests on where to move next. Help us shape the debugger’s future by sharing your feedback in the comments or our issue tracker. If you encounter any issues, please report them directly to the tracker, as well.
If you find this update valuable, we would greatly appreciate it if you could take a moment to leave a review on the marketplace. Your feedback helps other members of the .NET community make informed decisions and ensures that we continue to improve based on user needs.
- Visual Studio Code Marketplace
- Open VSX Registry (for Cursor, Google Antigravity IDE, Devin Desktop, Kiro, and other compatible editors)
Thank you for your support!