IntelliJ IDEA
IntelliJ IDEA – the Leading IDE for Professional Development in Java and Kotlin
IntelliJ IDEA 2017.1 EAP Extends Debugger with Async Stacktraces
Following the reactive programming trend, our code is getting more asynchronous. Earlier Java 8 introduced CompletableFuture (adopted from Guava’s ListenableFuture). Akka, Ratpack, Reactor, RxJava, Vert.x and other libraries implement Reactive Streams, Scala offers Future, Kotlin is adding Coroutines, and finally, Java 9 is about to bring us the Flow. Well, reactive programming helps us build efficient applications, but boy are they difficult to write and debug.
Consider this sample (courtesy of github.com/nurkiewicz):
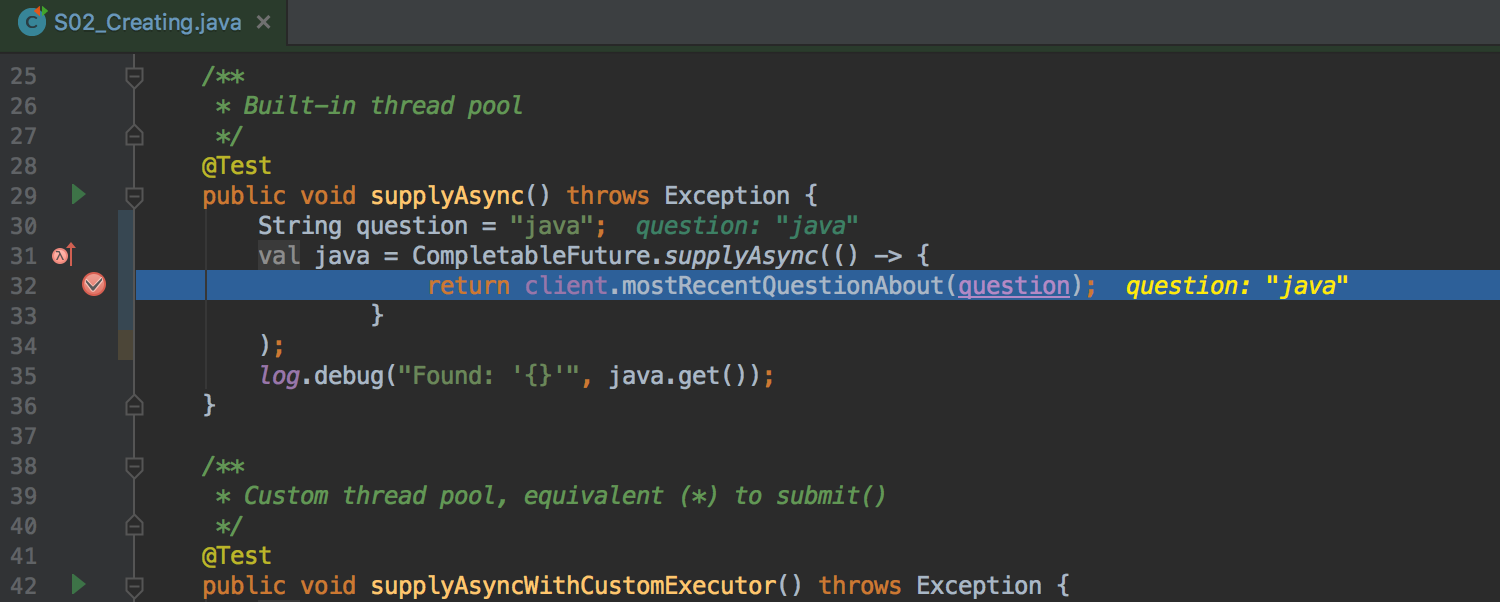
If we put a breakpoint here, the stack trace will look somewhat like this:
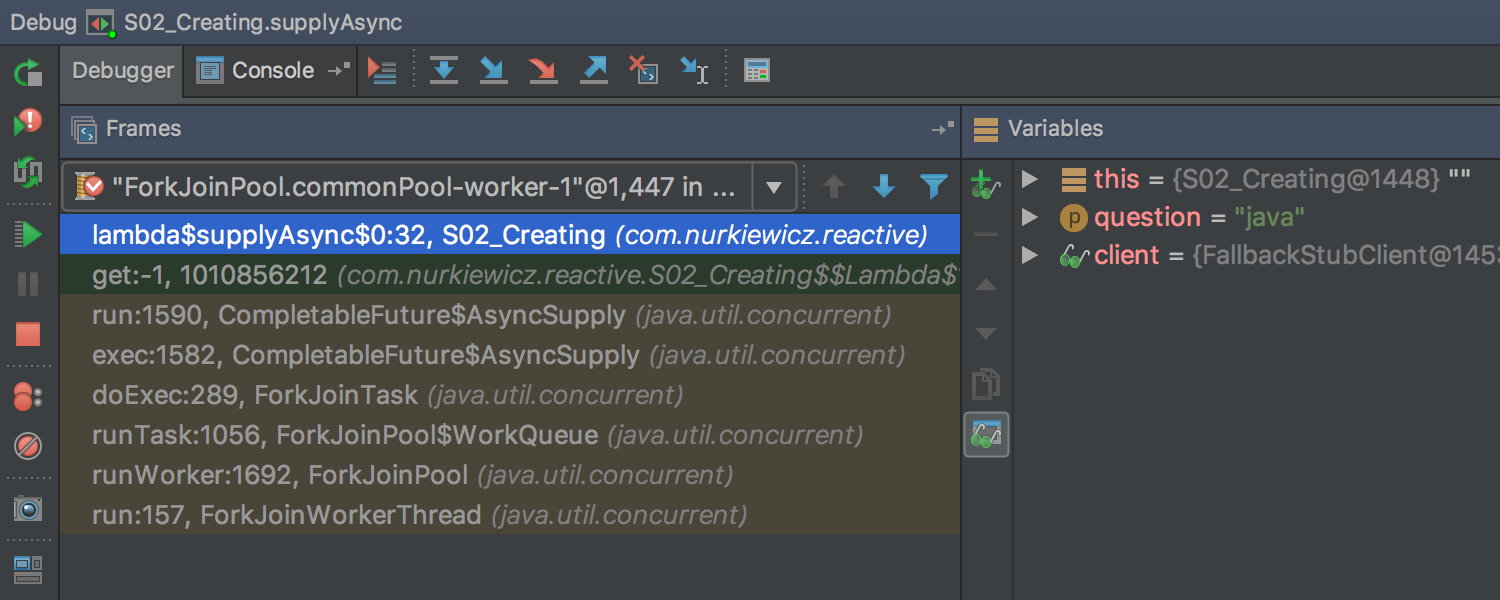
Instead of the place where we invoke CompletableFuture.supplyAsync (S2_Creating.supplyAsync), we’re looking at ForkJoinPool.runWorker (executor service that runs code asynchronously) and all of its internals. This makes it harder to understand the data flow and also makes it almost impossible to navigate to relevant frames.
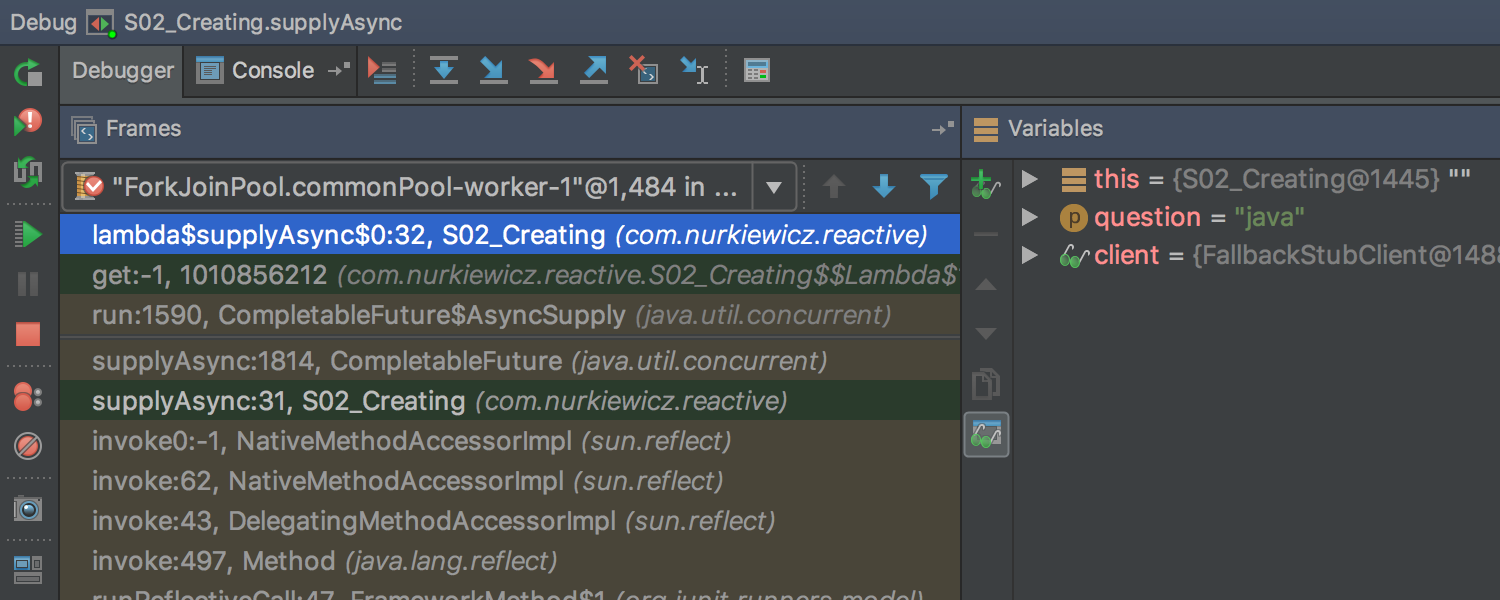
IntellIJ IDEA 2017.1 helps us here with its a new Debugger feature called Capture, which alters the stacktrace by substituting its parts related to the asynchronous code execution (receiver) with the corresponding parts of the stacktrace captured from where the asynchronous code is passed (sender).
For this feature to work, IntelliJ IDEA needs to know exact signatures of methods used for sending and receiving data (asynchronous code), along with expression that represents the data being sent.
IntelliJ IDEA 2017.1 EAP offers the following settings to configure this (Settings > Build, Execution, Deployment > Debugger > Capture):

Right now you have to manually configure this, but later we may provide a predefined configuration for the most popular libraries. Please let us know which libraries you would like to have on this list.
Once all the requirements have been met, IntelliJ IDEA will display the adapted stacktraces:
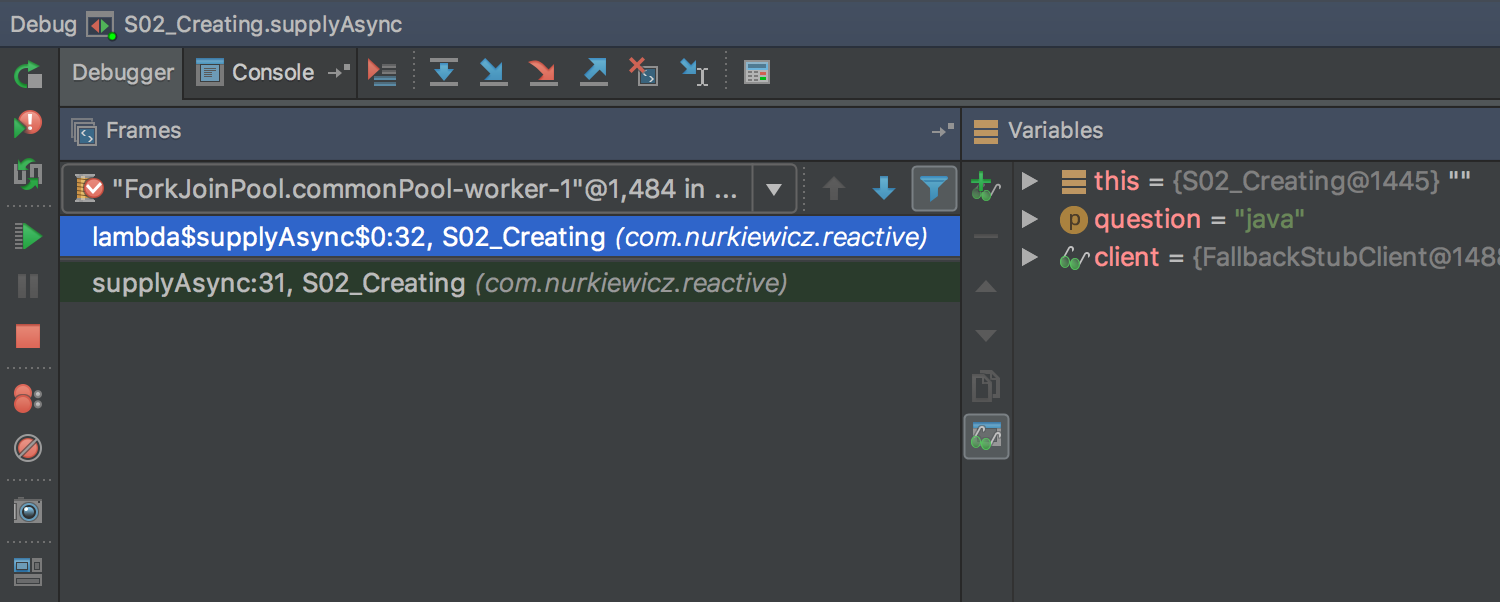
For better clarity you can filter out the library frames:
The substituted parts of stack trace display local variables (without object fields, though):
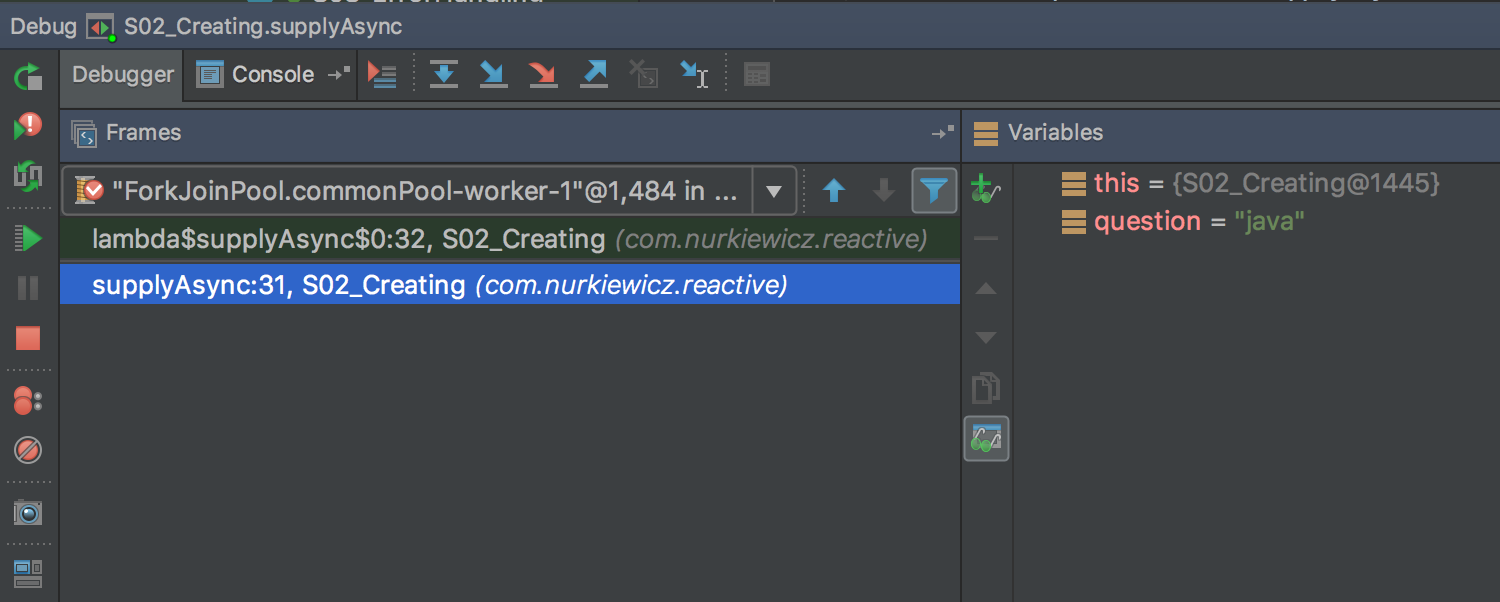
It’s important to know that this feature may affect performance because it collects additional data during execution.
This feature is already available in the newly-released IntelliJ IDEA 2017.1 EAP build.
The way the feature works as well as the way it’s configured are in active development. We appreciate any feedback that may help us improve this feature. Share your ideas as well as bug reports here in the comments or directly in the issue tracker.
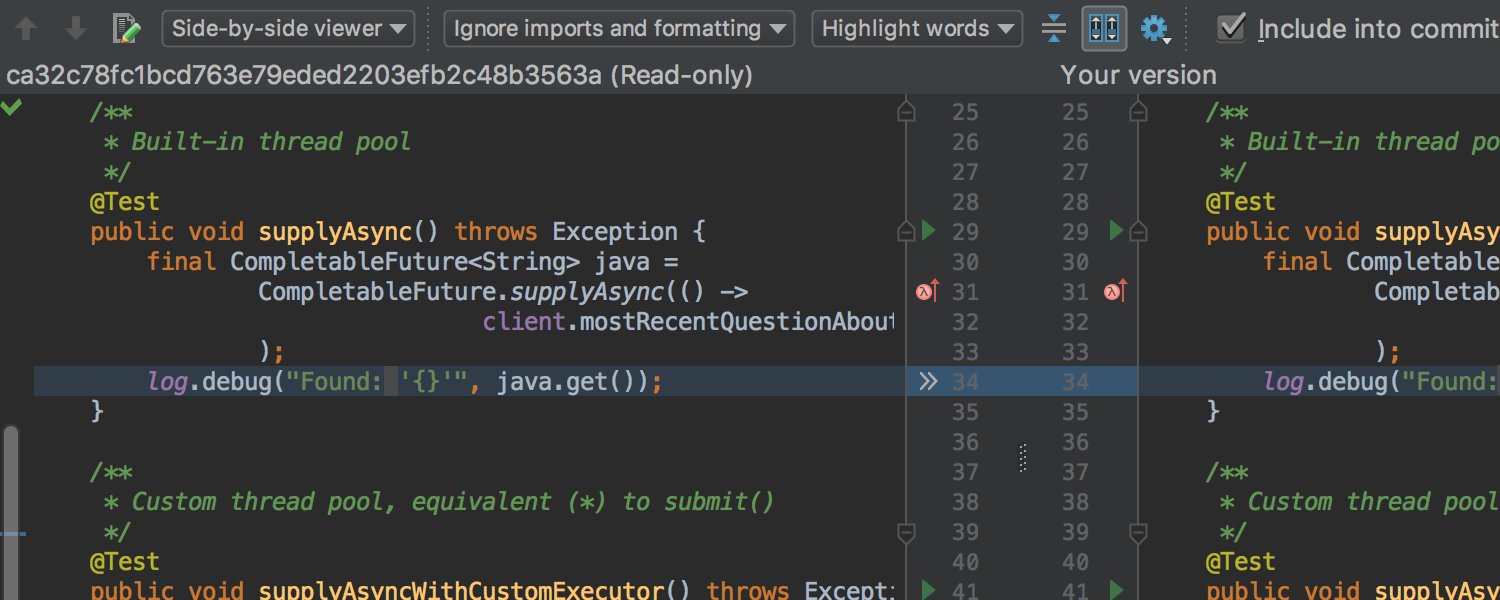
In other news, we’ve added a new option to the Diff dialog: Ignore imports and formatting and, as its name says, it ignores changes within import statements and whitespaces (at the same time it respects whitespaces within String literals):
Hope you’ll find this useful.
UPDATE: For more technical details about Async Stacktraces, read this comment.
UPDATE 2: Please submit your ideas of particular capture points to our GitHub repository via pull requests. The definitions from this repository will be bundled with the IDE.
Develop with Pleasure!


