IntelliJ IDEA
IntelliJ IDEA – the Leading IDE for Professional Development in Java and Kotlin
IntelliJ IDEA 2020.3 EAP3: Debugger Inline Watches, Reader Mode, and More

New week, new features! As promised, in this blog post we’ll cover in more detail the updates coming to IntelliJ IDEA 2020.3 that we’ve previously mentioned. We’ll also show off some of the new features that are already available in the EAP. In addition to learning about them here, we encourage you to join the Early Access Program and try them for yourself.
You can download the new EAP from our website, get it from the free Toolbox App, or update using snaps if you’re an Ubuntu user.
Let’s get started!
User Experience
Project view updates
We are always looking for ways to make the IntelliJ IDEA experience more intuitive and faster. So to help with this, we’ve added some new UX features to the Project view.
Now when you open a file from the Project view, the focus is automatically placed on the Editor to allow you to start working with your code right away.
If you want to make sure the file you are going to open is the one you need, you can preview it from the Project view by pressing the space bar.
Collapse All is now coupled with the Expand All button in the Project view. Select it from the Project view pane or press ⌘+plus sign on Mac or Ctrl+Numpad+plus sign on Windows or Linux.
If you want to work with several files open in the editor simultaneously, you can now do so with one simple shortcut. Select the file in the Project view and press Shift+Enter to have the IDE split the Editor window and open the file in the right-hand part of it.
Reader Mode
In our third EAP, we implemented Reader Mode for read-only files and files from External Libraries. This makes it easier to read comments because they look like formatted text. On top of this, we’ve added a nicer display for font ligatures, code vision hints with the number of usages, and more. You can configure the new mode in Preferences | Settings / Editor / Reader Mode.
Profiler (IntelliJ IDEA Ultimate only)
Easy access to .jfr and .hprof
You can now open .jfr and .hprof files super-quickly by dragging and dropping the files into the Editor, by double-clicking on them in the Project view, or with File / Open.
Ensure that Hprof memory snapshot and Java Flight Recorder snapshot are chosen in the list in Preferences | Settings / Editor / File Types.
CPU Timeline
When you stop profiling your file, do not worry when you see the new CPU Timeline tab. Starting with this EAP, we are beginning to work on a comprehensive visual display of threads. The feature is now in its initial stages, but you can already begin using it.
Debugger
Interactive hints and inline watches
In IntelliJ IDEA EAP3, we’ve begun looking into what we can do with debugger inline values and customizable watches.
In the previous release, you could see non-interactive hints next to the variables. Though this is a useful feature, sometimes the hints don’t provide particularly helpful information, like when hashcode is shown for complex objects in Java, for example.
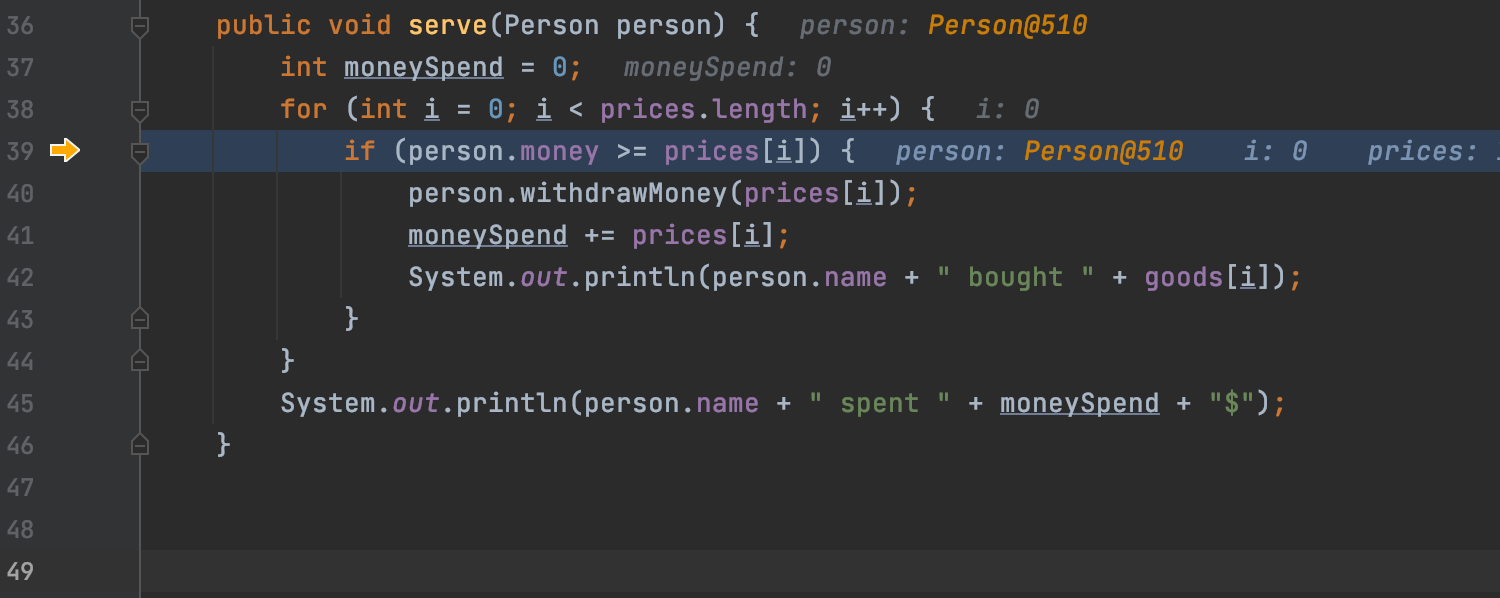
Being able to examine variables is crucial for understanding why the program behaves the way it does. So now when the application is running in debug mode, you get clickable inline hints that you can expand to see all the fields that belong to the variable. Moreover, you can change the variable values inside the drop-down list.
By clicking Create Value Renderer inside this new popup, you open the Java Data Type Renderers dialog, which allows you to configure how the IDE will display values of a particular type, including inline values, in all debugger views.
Another update touches upon watches. In previous versions, your custom watches were kept in the Variables tab of the Debug tool window. When you stepped through the code and moved to a different context, the watches turned into errors.
Though you can still use the previously existing watches, in v2020.3, we’ve solved the issues mentioned above by adding inline watches. You can naturally tie your watch expression to the place in the code where it is relevant. To create inline watches, do one of the following:
- Click Add as Inline Watch in the hint popup.
- Choose Add Inline Watch in the editor’s context menu.
- Select any variable, right-click on it, and choose Add Inline Watch.
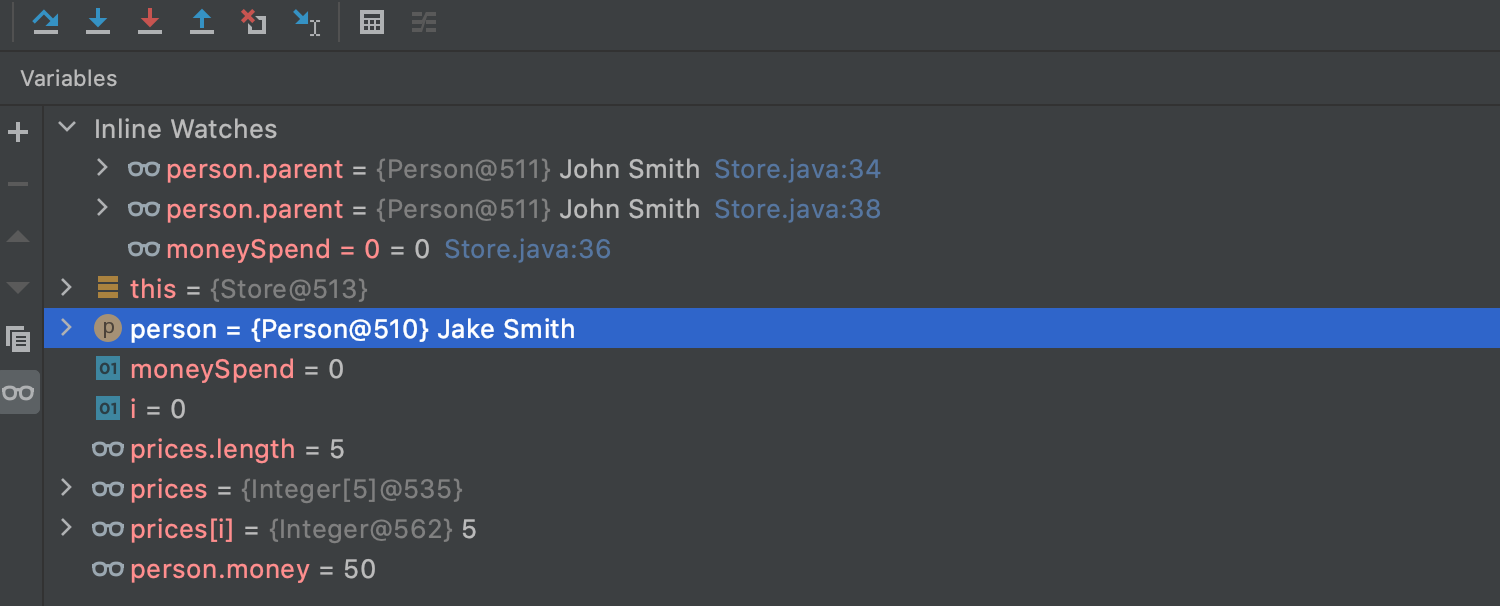
All your created watches are associated with a particular context and kept inside a new Inline Watches node in the Variables tab. You can click on any inline watch and quickly navigate to it.
We hope you enjoy the new simplified routine for examining variables! As always, we would appreciate your feedback.
Basic memory profiling in Java Debugger
The newly added Memory agent allows you to perform some basic profiling features during debugging. Before you start testing it, make sure the Attach memory agent checkbox is selected in Preferences | Settings / Build, Execution, Deployment / Debugger.
When you are ready, set your breakpoints and run the debugger. You can access the new profiling features from the context menu of the Debug tool window. At the moment, the following actions are available:
- Show referring objects finds the shortest path from an object to the GC roots.
- Calculate retained size calculates the retained size of an object and shows you its retained set.
VCS
Git search
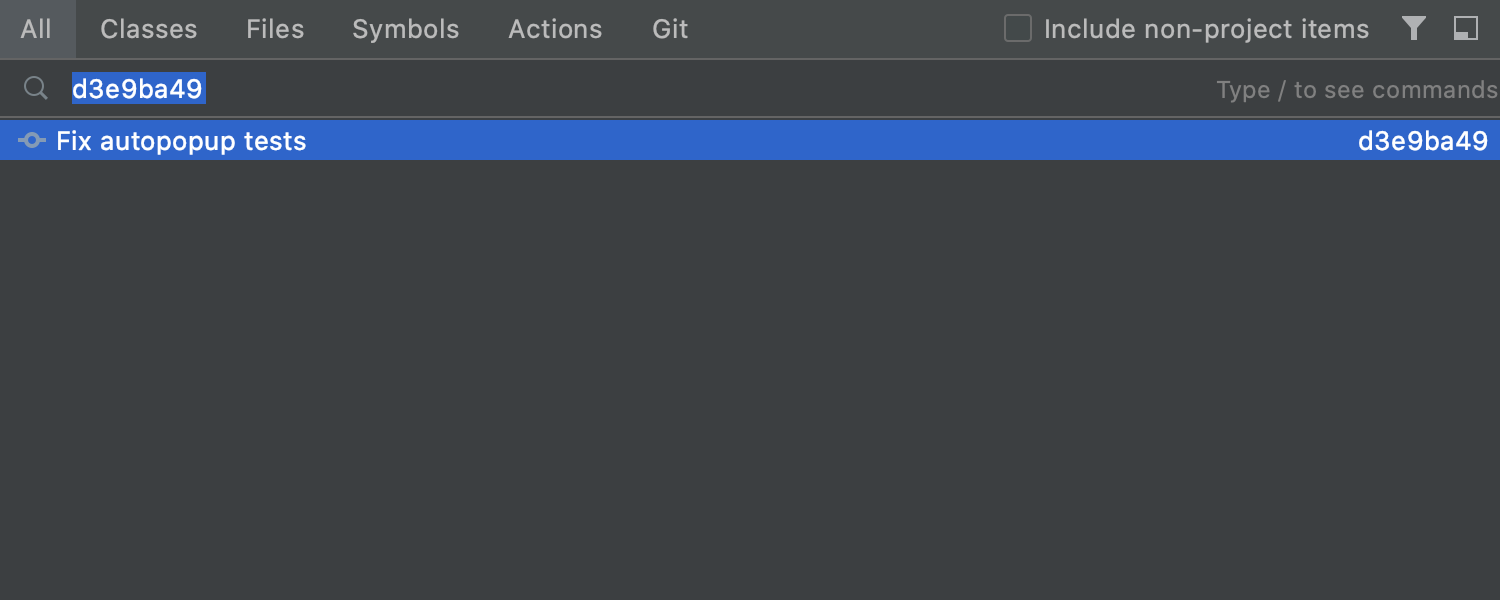
We added the Git tab to the Search Everywhere dialog. In it you can find commit hashes and messages, tags, and branches.
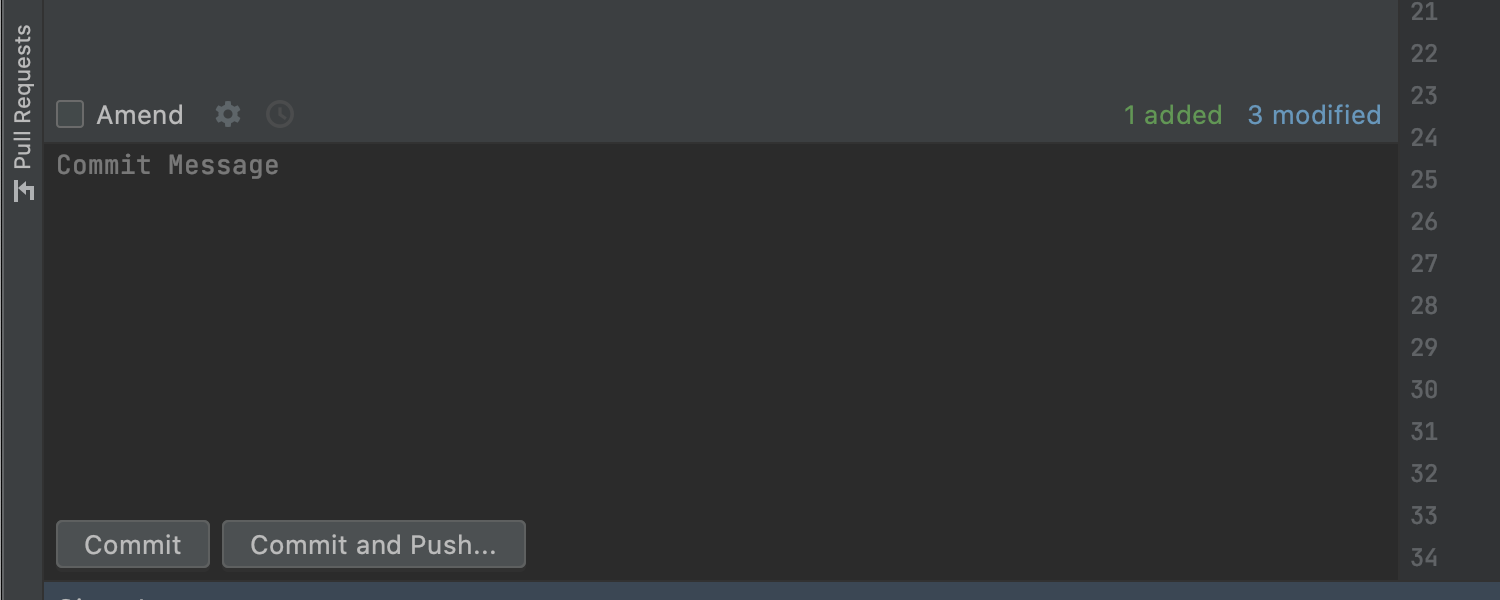
Commit and Push button
Now the two most popular buttons – Commit and Commit and Push… – are explicitly shown on the Commit screen. This is an easier way to navigate to the option you need. To push the changes to the remote repository immediately after the commit, you don’t have to open a drop-down list to reach the Commit and Push button.
Java
Shebang (#!) support
IntelliJ IDEA now automatically identifies new files that use a Shebang mechanism. You can also open already existing files with Shebang mechanisms without encountering any errors. We have corrected highlighting and code insight.
For more information, read our blog post.
Other
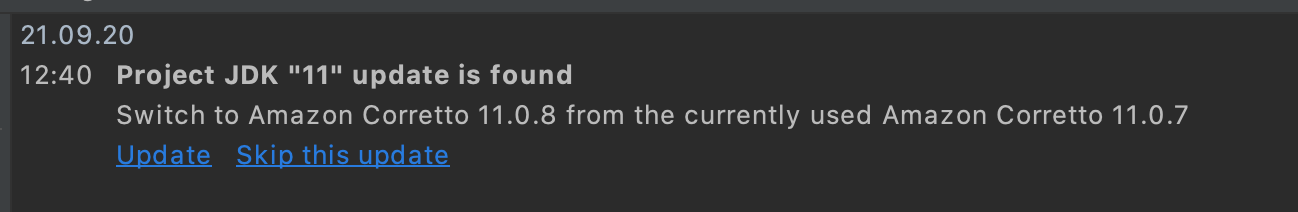
Update JDK from inside the IDE
Being able to download and use a JDK right from inside IntelliJ IDEA is very convenient. But when updates for the JDK are released, you can easily forget to keep up with them. This may be because in the past you’ve had to delete the older version and install a newer one manually. Starting from EAP3, you don’t have to use any workarounds when migrating to the latest JDK. It is now a straightforward process: IntelliJ IDEA sends a pop-up notification whenever an update is available, and you can choose whether you want to install it or skip it.
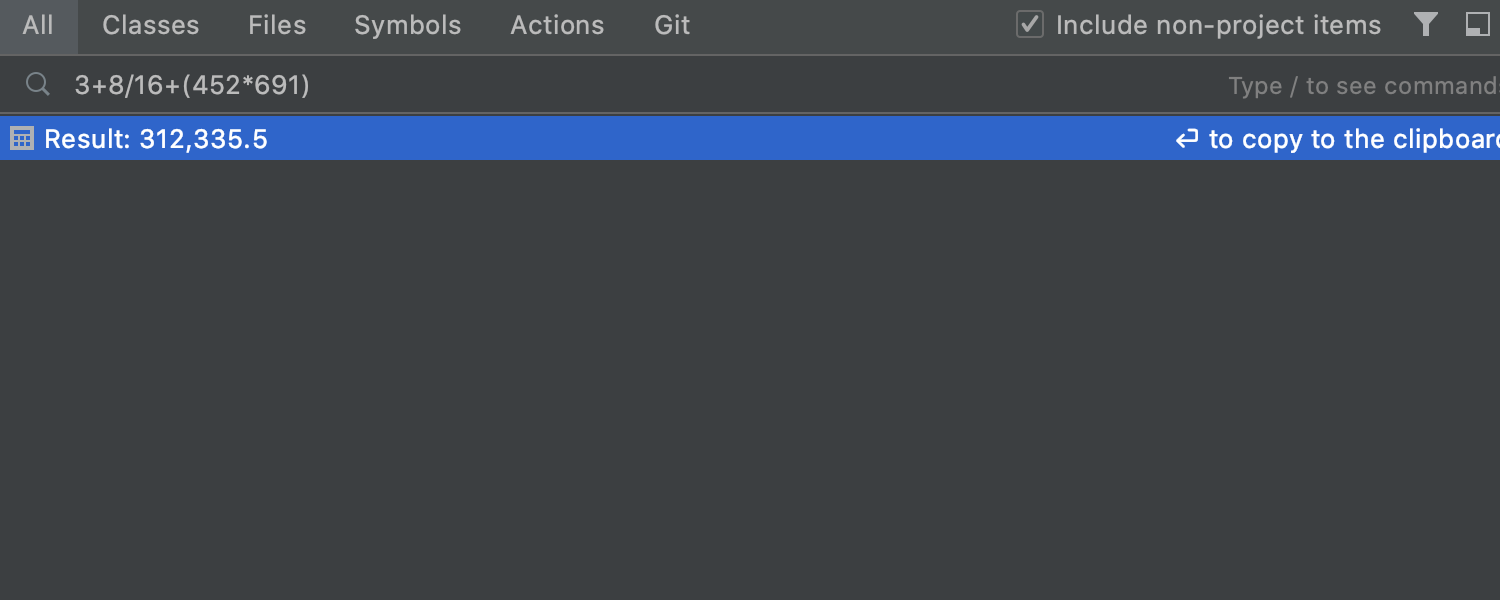
Simple calculations in the Search Everywhere dialog
Sometimes you may need to calculate simple mathematical expressions without interrupting your work to open extra apps. Now you can enter simple formulas in the search bar of the Search Everywhere dialog and you will see the calculated result right away. Try it out!
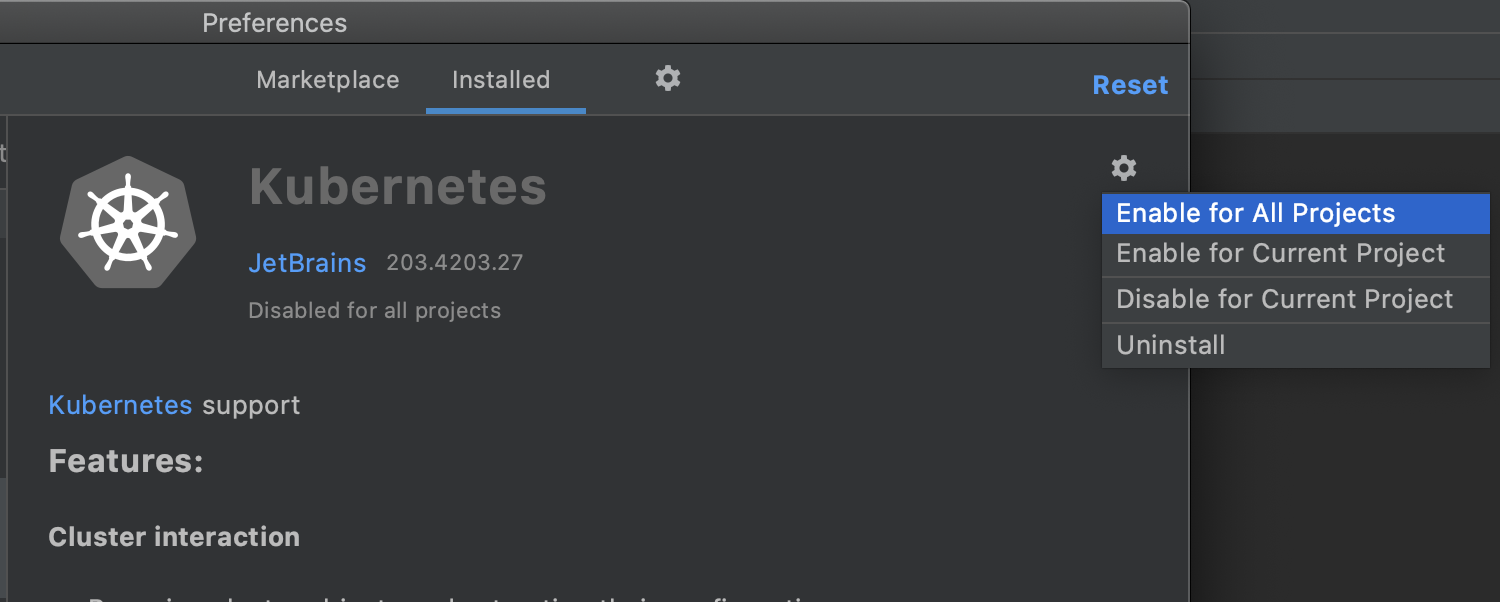
Plugins enabled per project
We have taken plugin customization one step further in IntelliJ IDEA 2020.3. In Settings | Preferences / Plugins the drop-down list next to the plugin name has been replaced with a new gear icon that has all the activation options. You can enable the plugin just for the current project or for all of them by selecting Enable for Current Project or Enable for All Projects.
With this update, your projects will be autonomous and configured to your needs.
That is all for today. Thanks for following our updates. You can take a look at all the other changes this update brings in the release notes.
Stay tuned for more useful features and contribute your feedback in the comments below, on Twitter, or via our issue tracker.
Happy developing!