IntelliJ IDEA
IntelliJ IDEA – the Leading IDE for Professional Development in Java and Kotlin
Cultivating Good printf Debugging Habits

One of the most common debugging techniques, printf debugging is particularly popular because most people learn it intuitively when debugging their first programs.
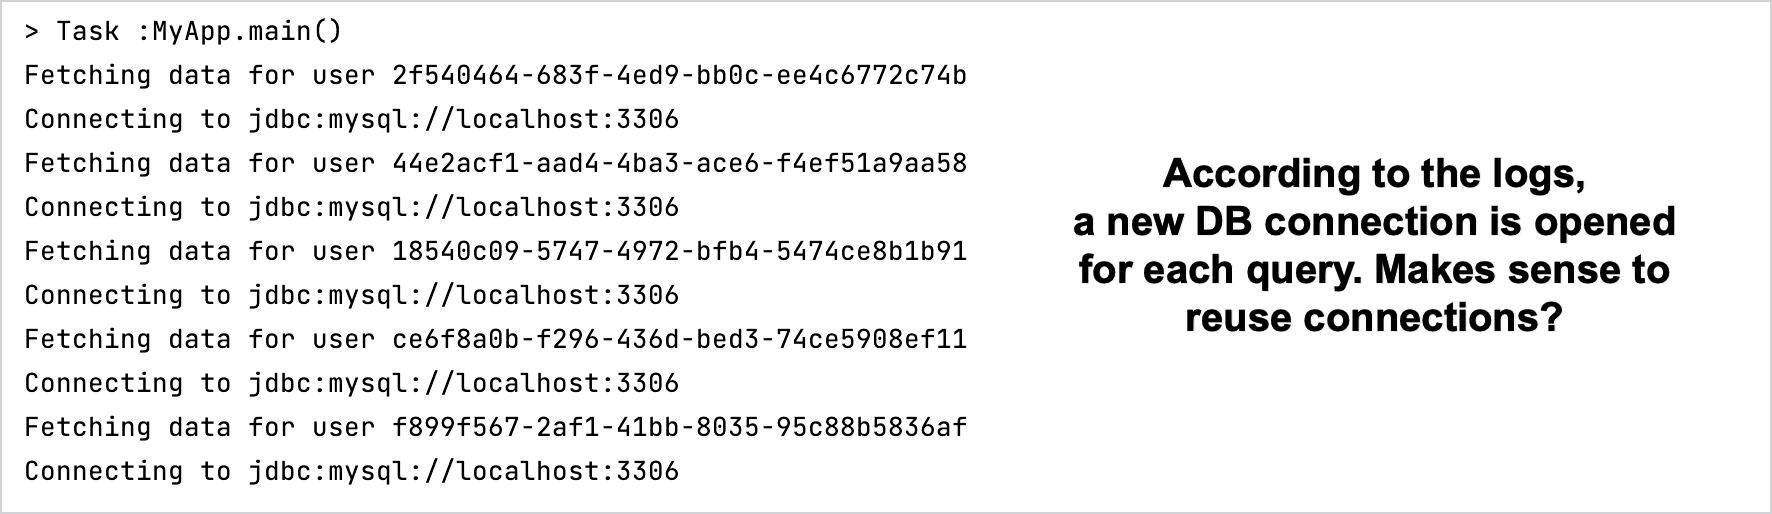
This type of debugging is also very accessible because you don’t need any special tools for it. You just insert print statements into your source code and see how it operates at runtime. This practice can reveal suboptimal routines, inconsistent state problems, synchronization issues, and more:
If you are a fan of this approach, then this post is for you. We will be looking at some of the features IntelliJ IDEA provides that can improve your printf debugging experience.

Let’s start with one of the most basic features: live templates.
Live templates
IntelliJ IDEA provides live templates for the most common logging patterns. For example, if you need to log parameter names to System.out, just type soutp and press Tab. IntelliJ IDEA will generate the corresponding print statement and insert it at the caret.
Similarly, if you need to log an arbitrary value, use soutv:
And last but not least, if you want to track method entries, you can use soutm.
Logging breakpoints
One of the downsides of debugging with print statements is that they introduce the overhead of manual management. You cannot turn them on and off, and you definitely don’t want to accidentally commit and run them in production.
Instead, if you need to log something for debugging purposes, we definitely recommend using logging breakpoints, since they do not require as much management.
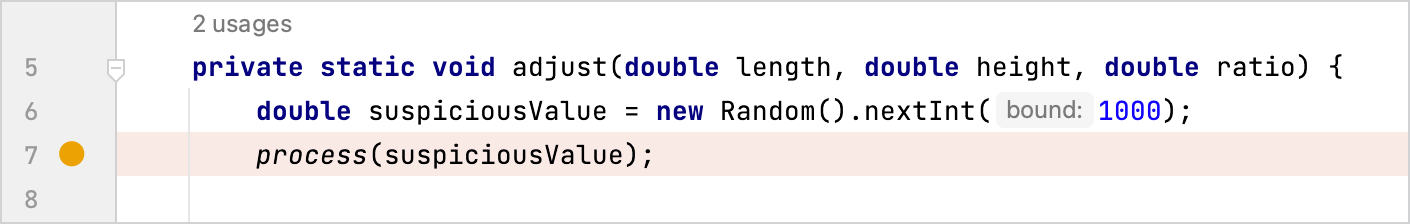
To set a logging breakpoint, select the expression that you want to log, press and hold Shift, then click the gutter. The difference between this and a regular line breakpoint can be seen in the Breakpoints dialog. To access it, right-click a breakpoint, then click More:
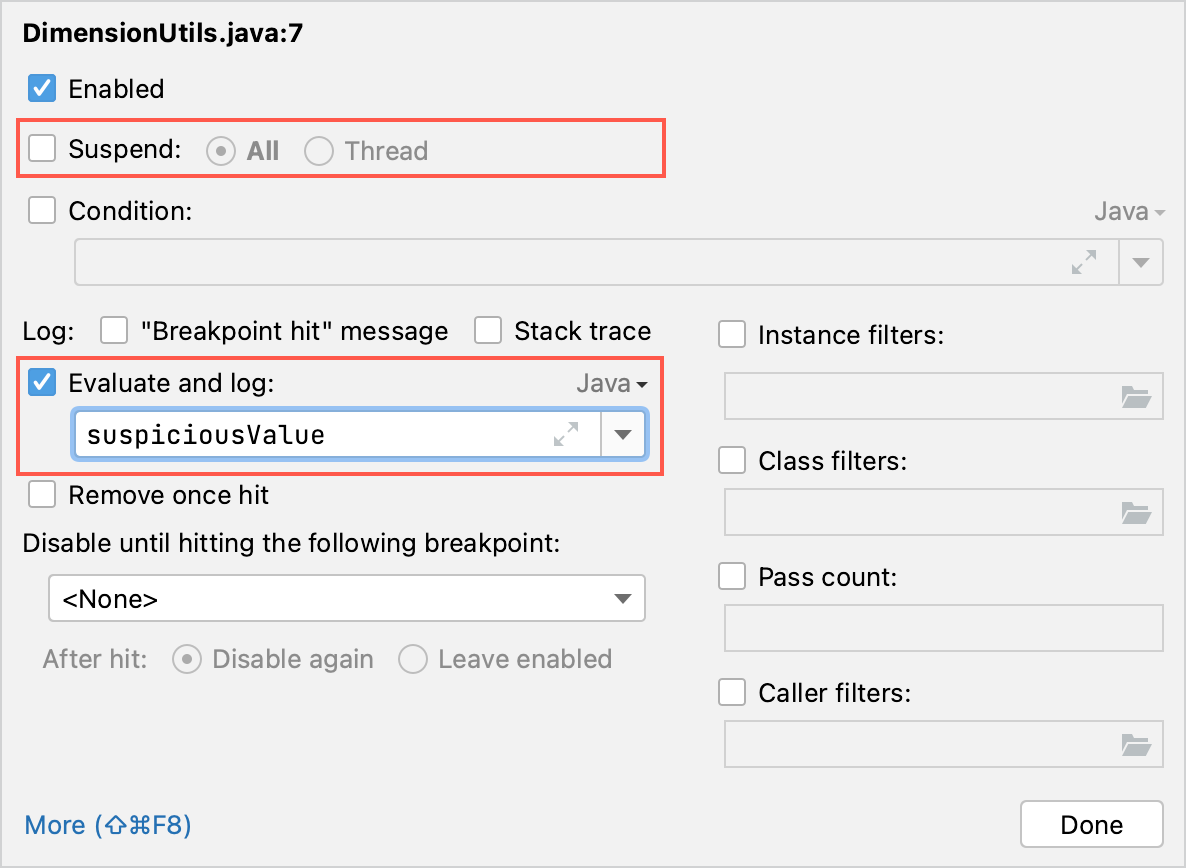
First, a logging breakpoint doesn’t suspend the program’s execution, and second, it logs the result of an expression to the console. You can also use the options above the Evaluate and log checkbox to log a message or the current stack trace.
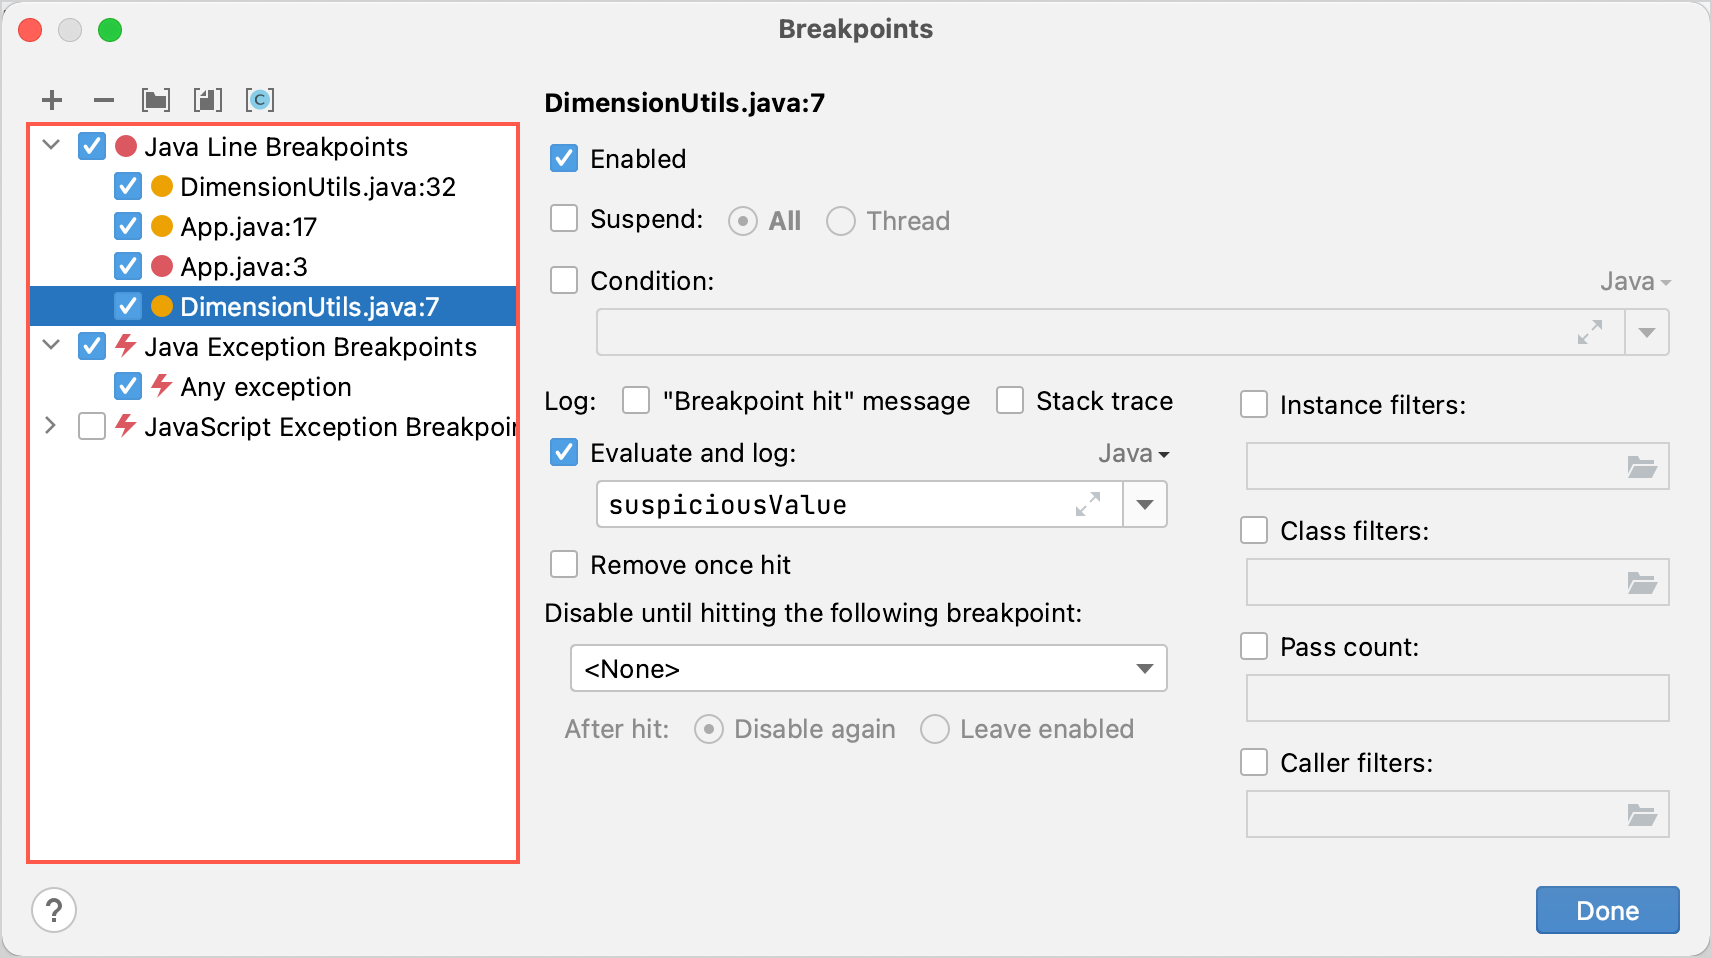
When logging breakpoints become numerous, you can easily keep track and manage them in the Breakpoints dialog:
You can even create customized groups for them:
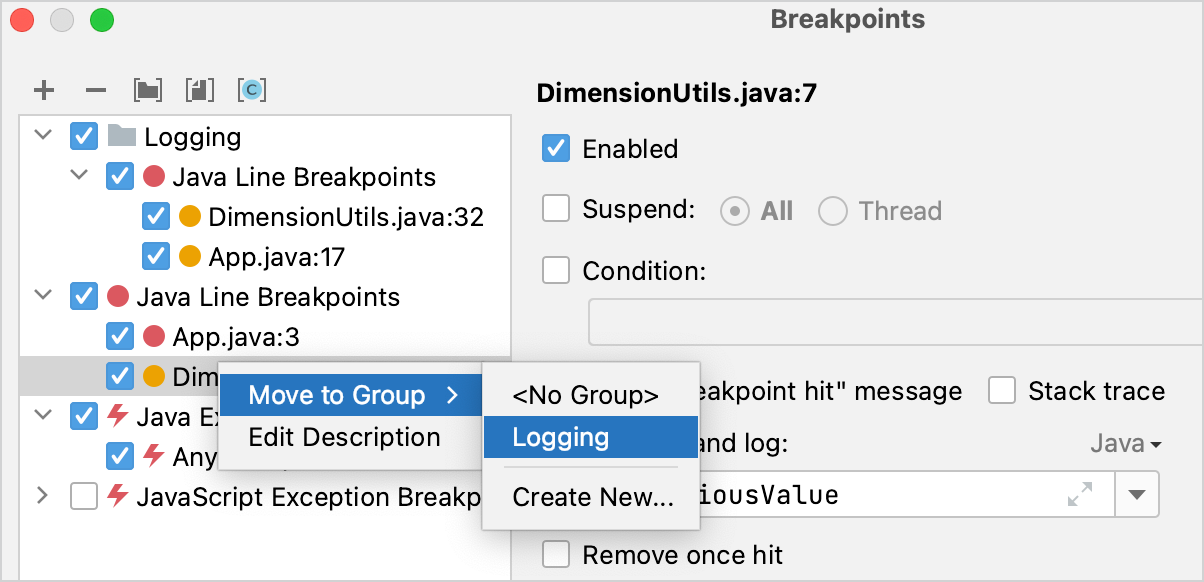
This will help you manage your breakpoints in a centralized manner. For example, you can create a group related to a particular bug and save it for later. When the problem goes away, you just turn it off. This way, should the problem appear again, you don’t have to recreate everything from scratch. You just turn the group on again.
Logging frequent events
For events that happen a lot during the runtime of a program, logging every single event may be superfluous. Not only does this flood the console with messages, but a lot of interaction with IO can significantly slow down the program’s operation.

For such events, it may be useful to use the Pass count feature. You can access it in the Breakpoints dialog.
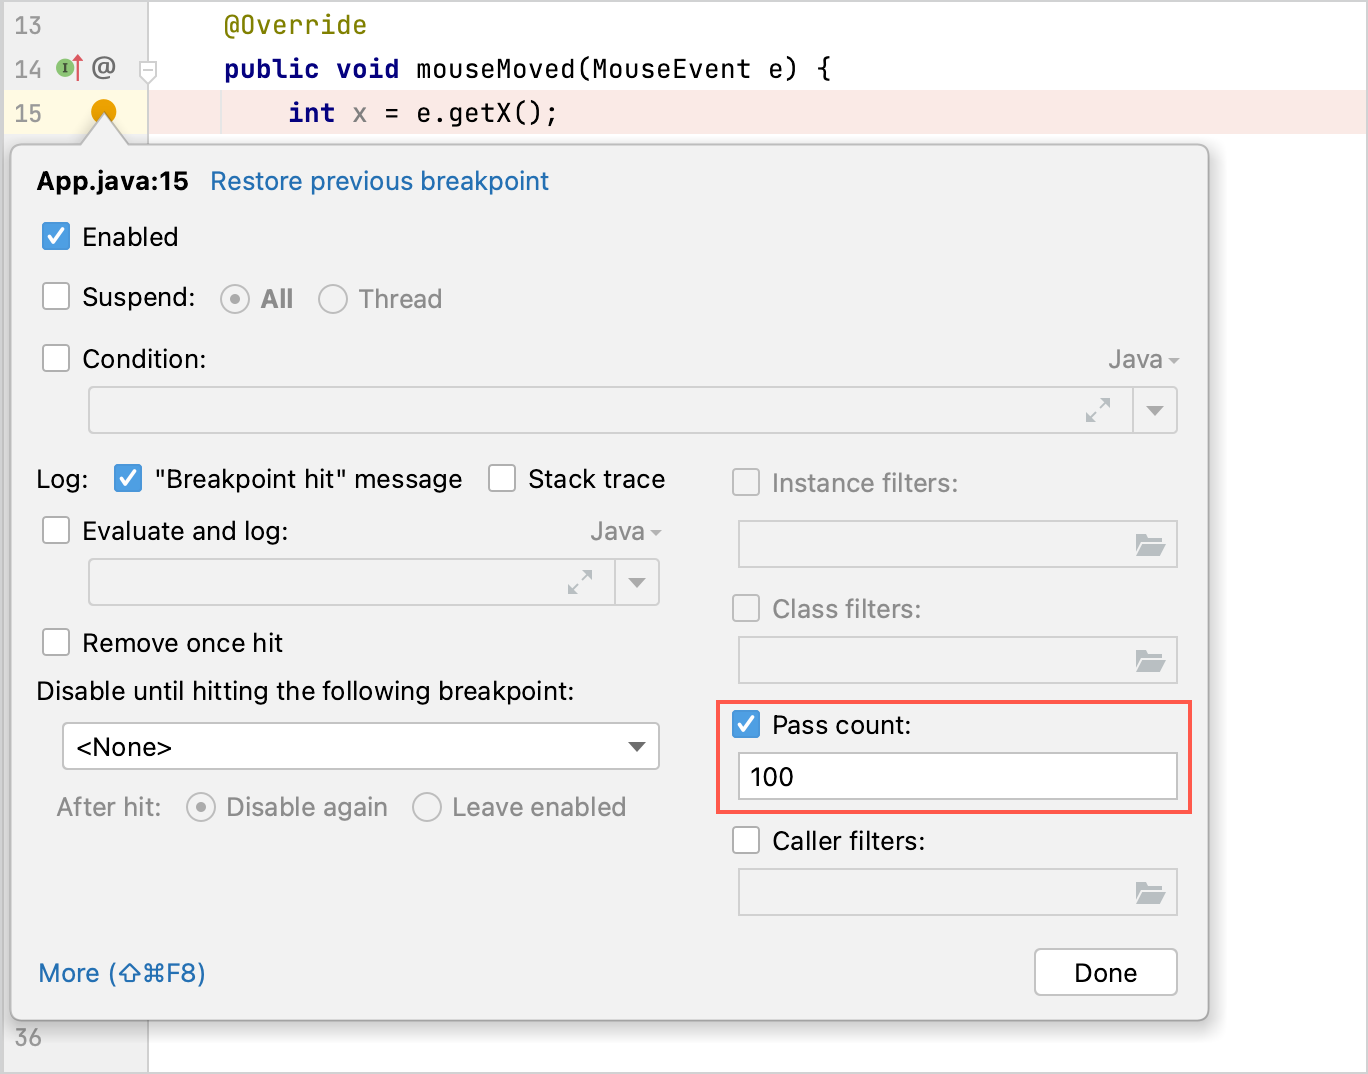
After you have set Pass count to a specific value, the corresponding breakpoint will only fire each n-th hit, ensuring that logging does not become a nuisance.
Summary
Regardless of whether you are inserting print statements or setting logging breakpoints for debugging, IntelliJ IDEA has features to streamline your experience. With this post, we wanted to make sure you are aware of these little tricks that make the entire process more enjoyable.
If you are interested in runtime analysis with IntelliJ IDEA, we recommend checking out our previous posts dedicated to debugging and profiling:
- Unfreeze Your Apps
- Get Started With Profiling in IntelliJ IDEA
- Profiling Tutorial: Fixing the Parrot Party
If you would like us to discuss a particular feature or use case in a future How2Pro blog post, let us know in the comments, and we’ll make sure to cover it.
Happy developing!