Tutorial: Debugging in AppCode

In this tutorial, we will cover both basic and advanced features of the AppCode debugger. You will learn how to halt a program execution using different types of breakpoints, examine the paused program state, step through the code, alter the program behavior without exiting the debugger session, and so on.
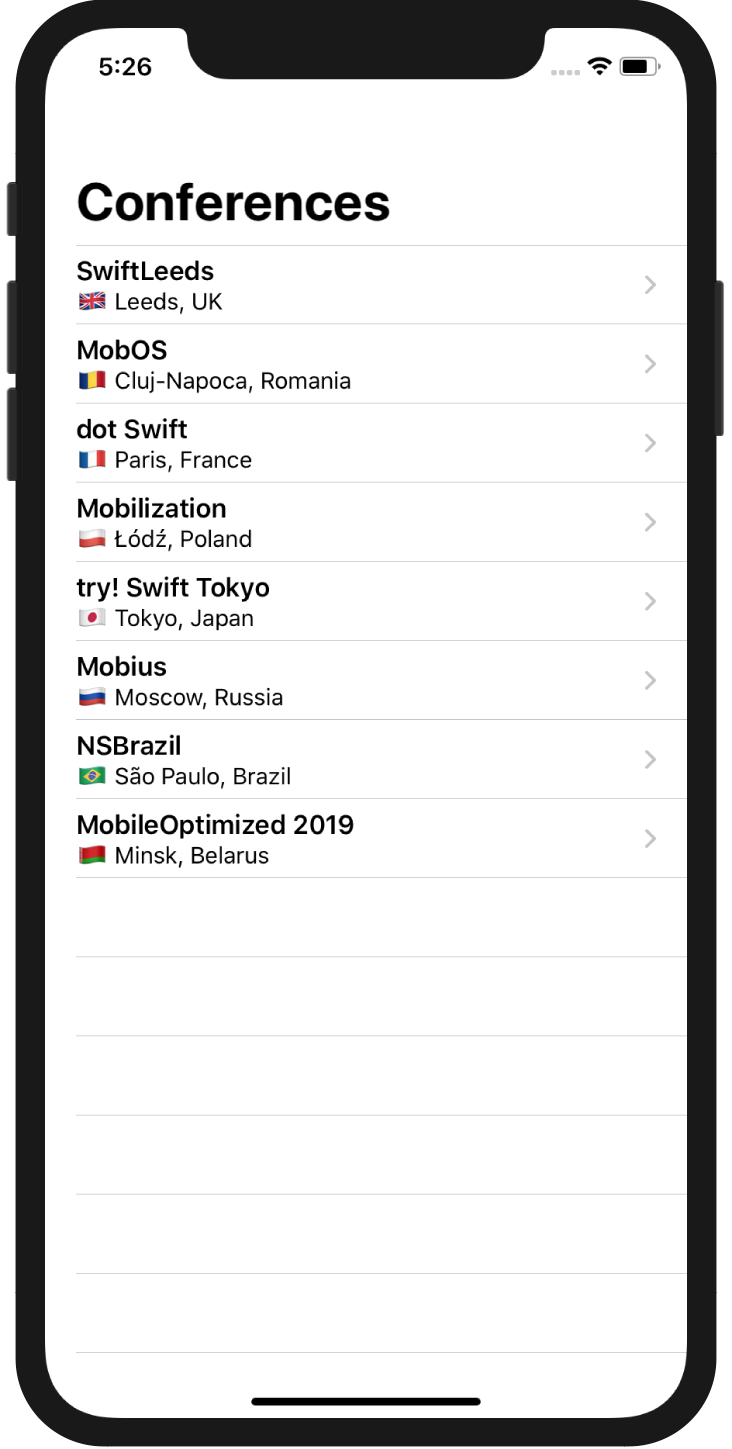
As an example, we will take a simple SwiftUI application that loads a list of conferences from a local JSON file. You can look at how it was developed in the Create a SwiftUI application tutorial.
At the moment, this application contains some bugs that we are going to find and fix using the AppCode debugger. Download the project and run it by pressing ⌃R or clicking the ![]() button on the main toolbar.
button on the main toolbar.
Inject code at runtime
Problem
Right on the first start, the application crashes with the following error in the console of the Run tool window:
Fatal error: Cannot parse conferencesData.json: Array<Conference>:
typeMismatch(Swift.Double, Swift.DecodingError.Context(codingPath: [_JSONKey(stringValue: "Index 0", intValue: 0),
CodingKeys(stringValue: "start", intValue: nil)], debugDescription: "Expected to decode Double but found a string/data instead.",
underlyingError: nil)): file /path/to/the/project/ac_tutorial_debugging/iOSConferences/Model/Data.swift, line 27
This means that somewhere in our code, the fatalError() function was called, which stopped the program execution and printed this error message. From the error message, we can understand:
-
where exactly the fatal error was thrown (
Data.swift, line 27) - why it was thrown (“Expected to decode Double but found a string/data instead”)
Solution
Let’s set a line breakpoint, step through the suspended program to examine its state, and inject the code that will fix the bug at runtime. Open the file specified in the error message and go to line 27. To do this, you can press ⇧⌘O and in the dialog that opens type filename:27.
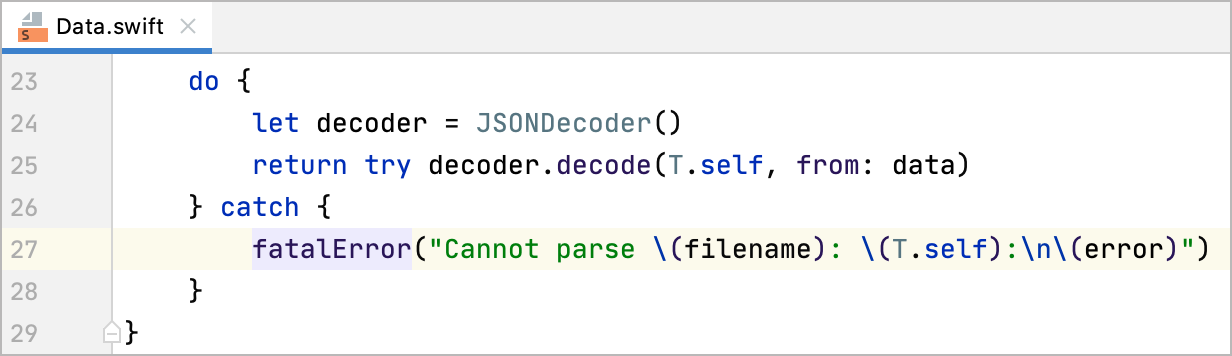
Thanks to the do...catch block used in this code fragment, we can see that the error occurred on decoding the JSON file.
Set a line breakpoint at line 24: click the gutter area left to the code line or press ⌘F8.
Start the debugging session by pressing ⌃D. The program execution stops at the line where the breakpoint is set, and now we can examine the current program state in the Debug tool window that opens:
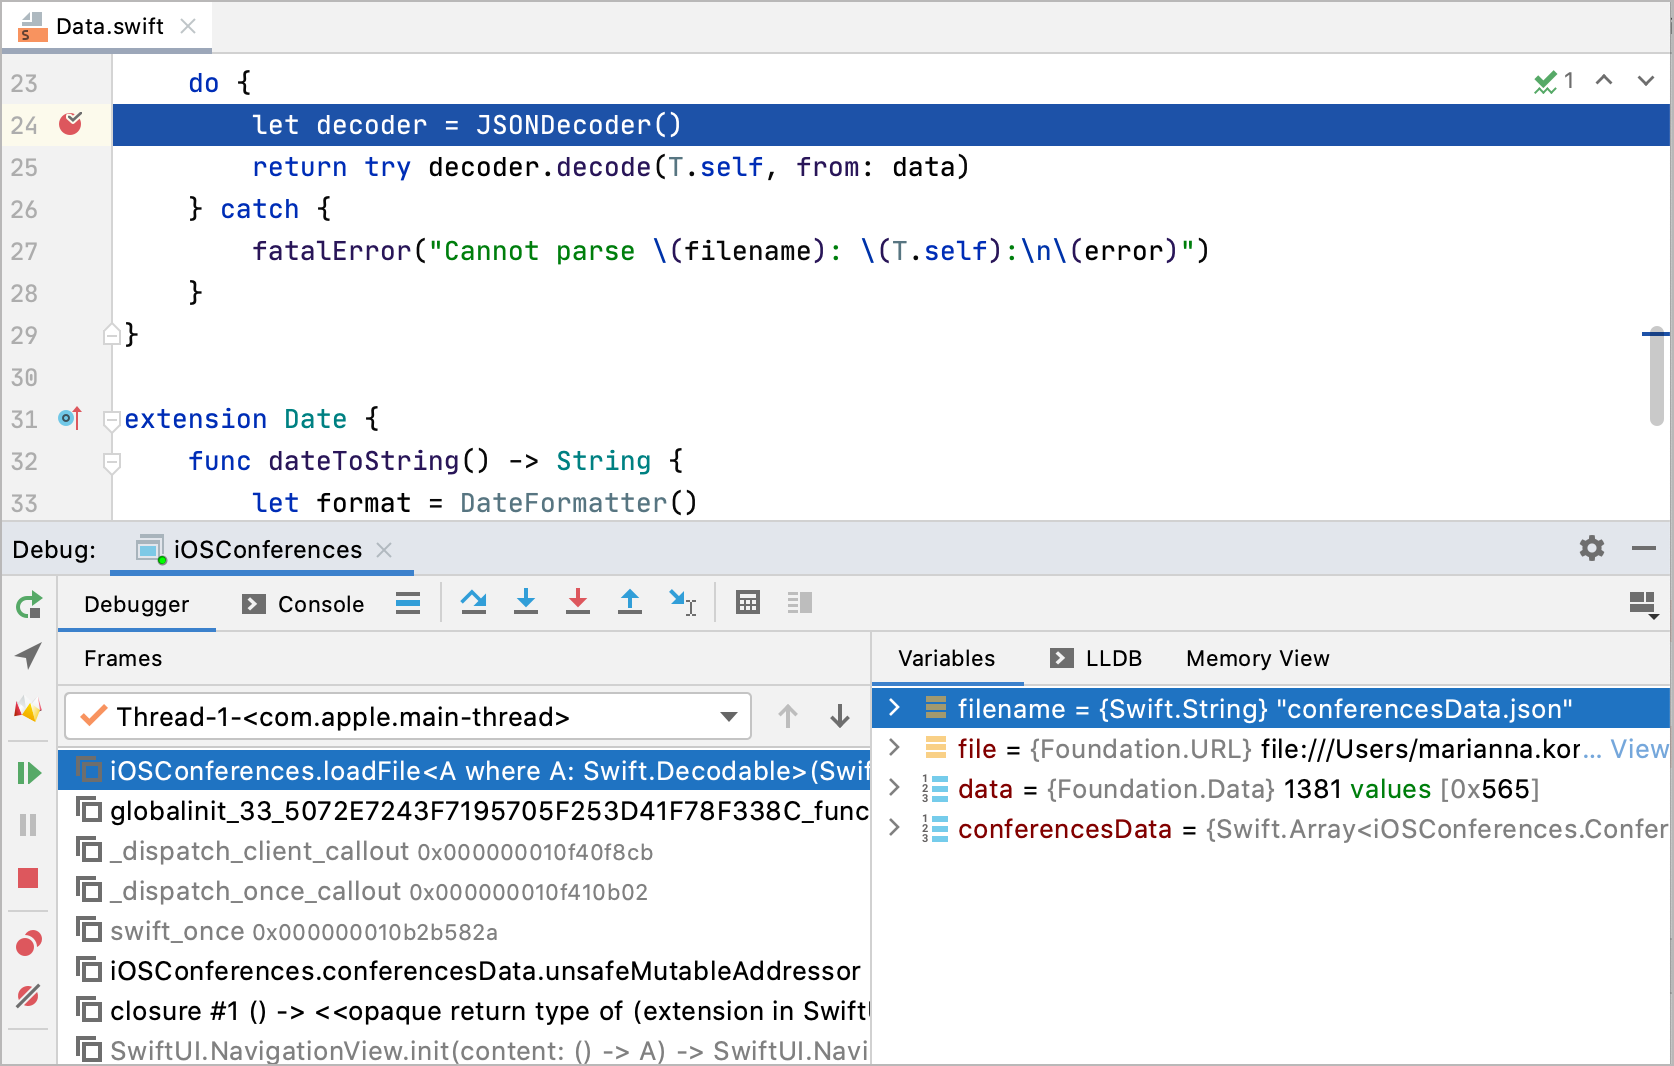
The Frames tab displays a stack of method/function calls, and the Variables tab — a list of variables available in the current context. At this point, we see that the conference data (the conferenceData variable) is successfully loaded from the local JSON file. The error that we’ve got (Expected to decode Double but found a string/data instead) most likely relates to the JSONDecoder object which hasn’t been created yet.
Click ![]() button or press
button or press F8 to execute the next code line — let decoder = JSONDecoder(). Now look at the Variables tab: the decoder variable has appeared and you can see all the properties of the newly created JSONDecoder object when expanding this variable. If the value is truncated, click View to open it in a popup:
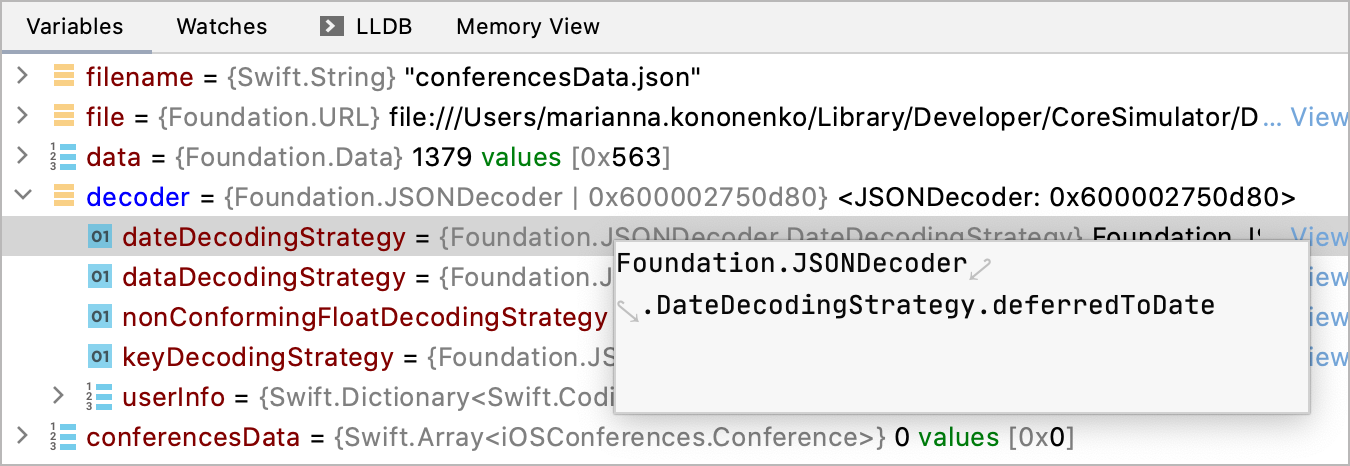
Now we know that our JSONDecoder uses the deferredToDate decoding strategy that can handle dates in double format only, whereas we have the string date values in our JSON.
⌘↓ (or select Jump to Source from the context menu) to navigate to its source code. For example, choose dateDecodingStrategy and press ⌘↓. It will bring you to the dateDecodingStrategy property declaration in the Foundation.swift file.
Let’s try to change this behavior using the formatted decoding strategy instead. To do this, set a breakpoint right before the decode() method is called, namely, at the following line:
return try decoder.decode(T.self, from: data)
Press ⇧⌘F8 to open the Breakpoints dialog:
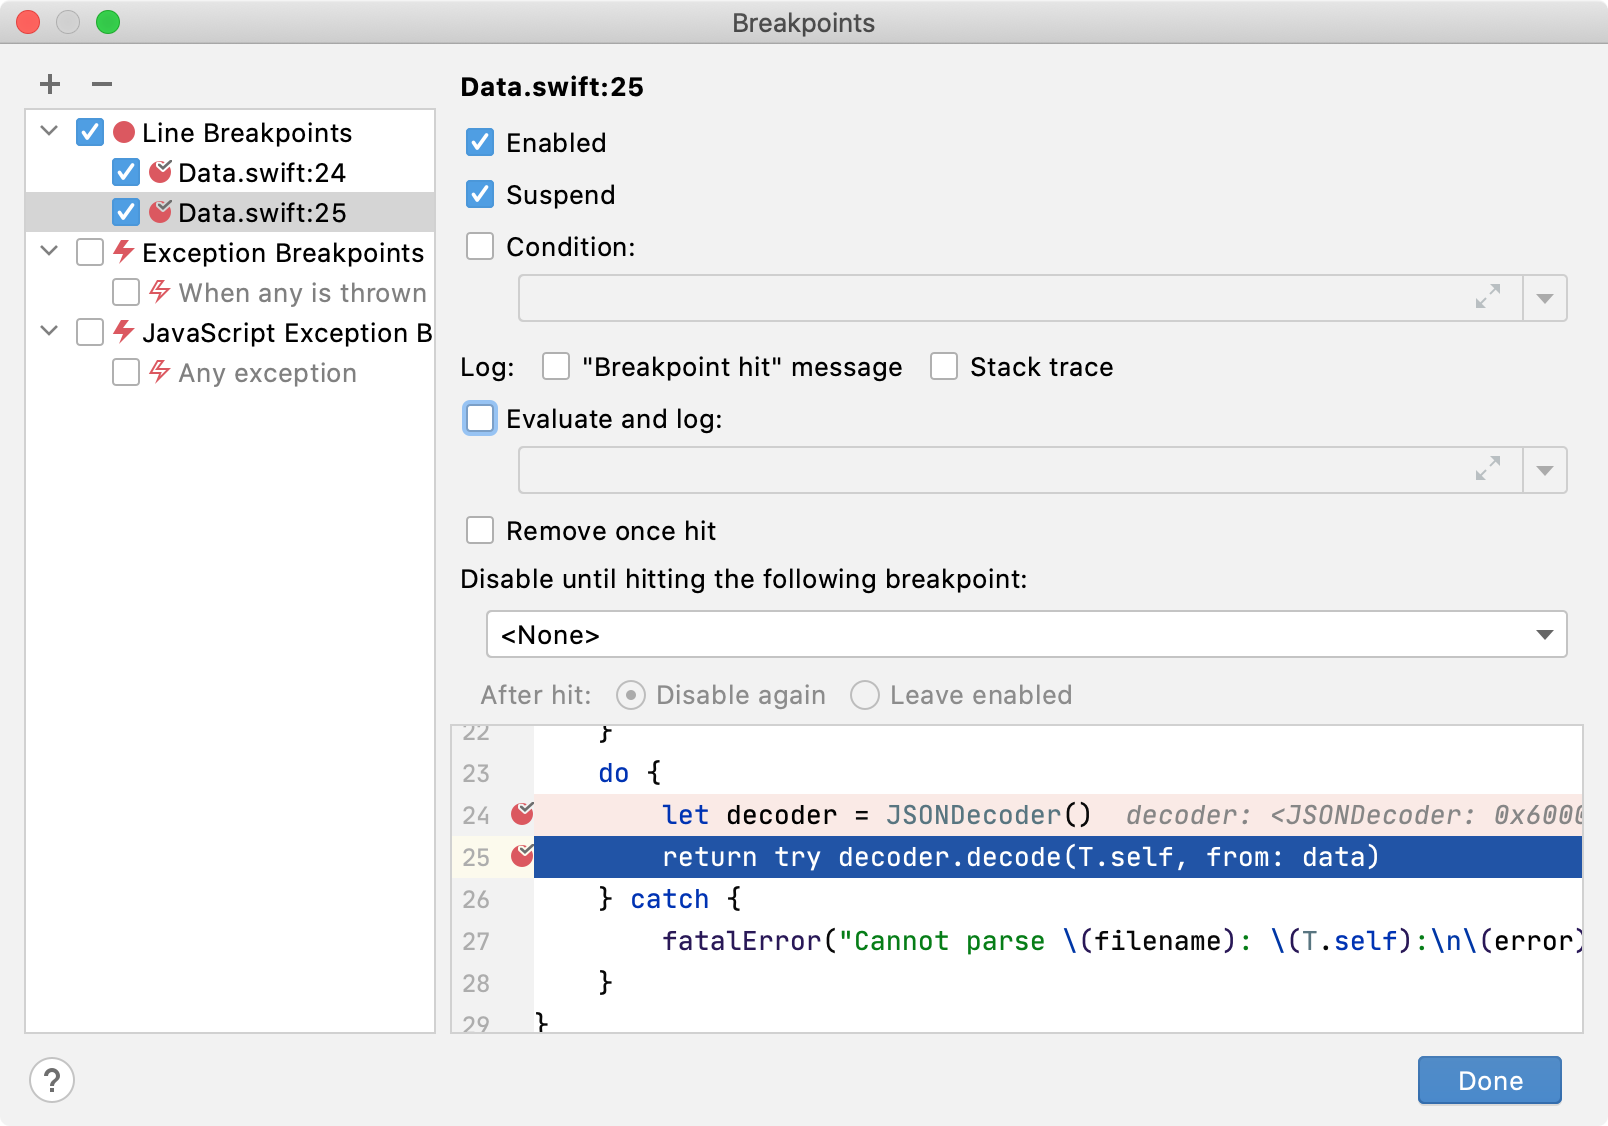
Delete the breakpoint at line 24 since we don’t need it any longer: you can either click it in the editor or delete it from the Breakpoints dialog by clicking the Remove button or pressing ⌦.
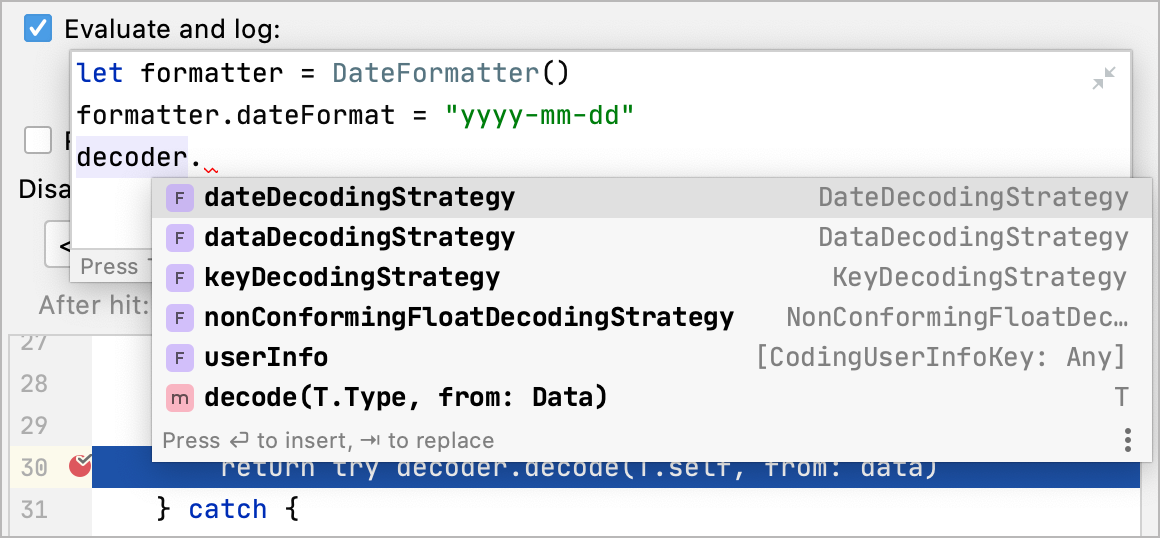
In the Breakpoints dialog, select a breakpoint at line 25 and check the Evaluate and log option. In this field, you can type the code that you want to execute when the breakpoint is hit. Click ![]() button to expand the text field and type the following code:
button to expand the text field and type the following code:
let formatter = DateFormatter()
formatter.dateFormat = "yyyy-mm-dd"
decoder.dateDecodingStrategy = .formatted(formatter)
For the symbols visible in the current context, auto-completion is available:
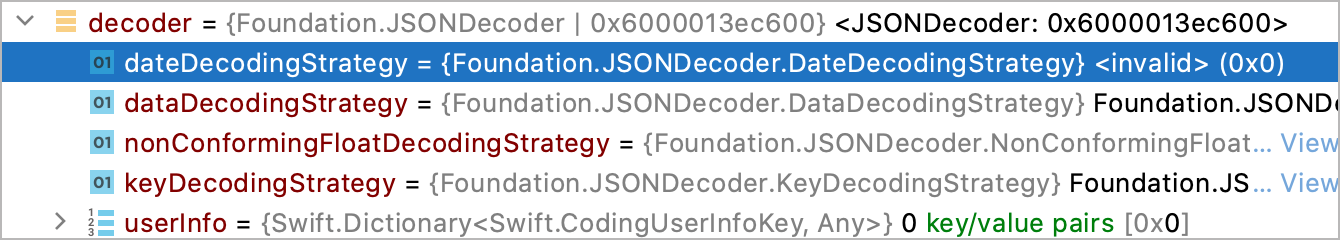
Press Done and rerun the program in debug mode by pressing ⌘R or clicking ![]() button on the Debug tool window. Now when the application is suspended, you see the
button on the Debug tool window. Now when the application is suspended, you see the decoder.dateDecodingStrategy property has a new value which cannot be displayed correctly on the Variables tab:
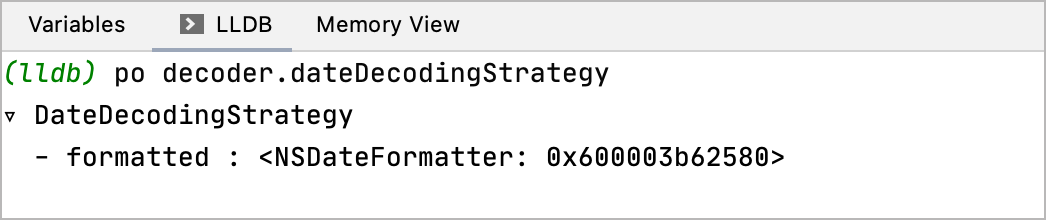
You can use the LLDB console to see such values. Go to the LLDB tab and type the following command: po decoder.dateDecodingStrategy.
Now our decoder uses the formatted date decoding strategy:
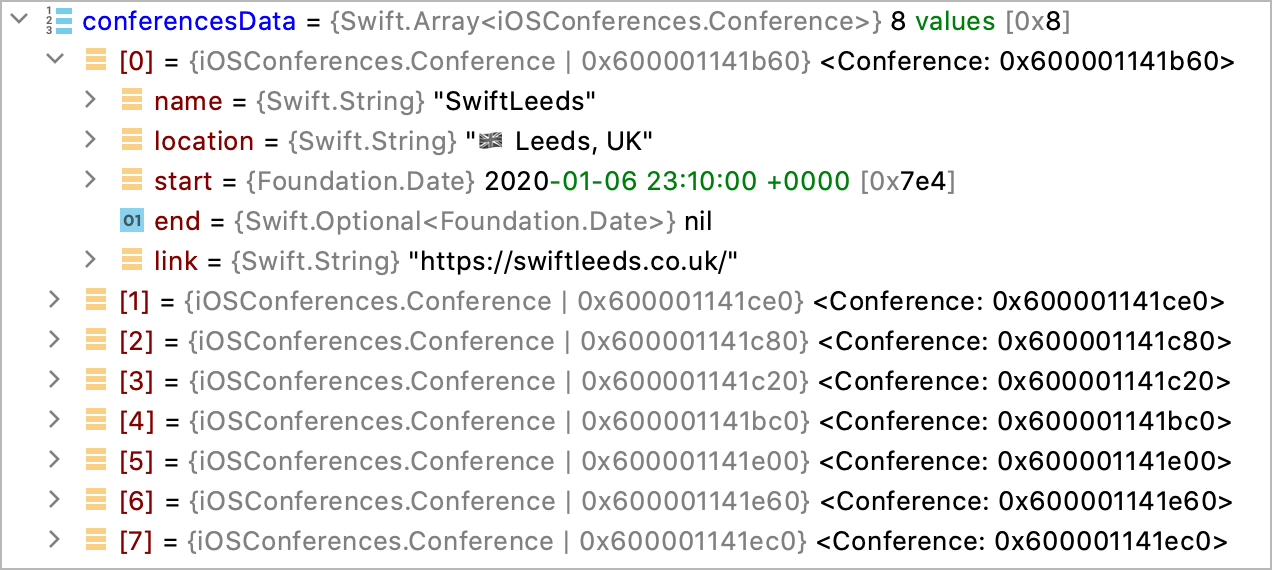
Press F8 to step over to the next code line and go back to the Variables tab. The conferencesData variable now stores the values from the parsed JSON file:
Resume the program by pressing ⌥⌘R and make sure that the list of conferences is now displayed on your device or simulator:
Since the code injected on the breakpoint hit has fixed the bug, you can add it in the editor:
do {
   let decoder = JSONDecoder()
   let formatter = DateFormatter() //line to add
   formatter.dateFormat = "yyyy-mm-dd" //line to add
   decoder.dateDecodingStrategy = .formatted(formatter) //line to add
   return try decoder.decode(T.self, from: data)
} catch {
   fatalError("Cannot parse \(filename): \(T.self):\n\(error)")
}
Delete the breakpoint at line 25 by clicking its icon.
Preferences | Build, Execution, Deployment | Debugger | Remove breakpoint | Drag to the editor area.Set variable values
Problem
Rerun the application ⌃R and select the dot Swift conference. The application will crash with the following error:
Fatal error: Unexpectedly found nil while unwrapping an Optional value:
file /path/to/the/project/iOSConferences/Model/Conference.swift, line 17
Solution
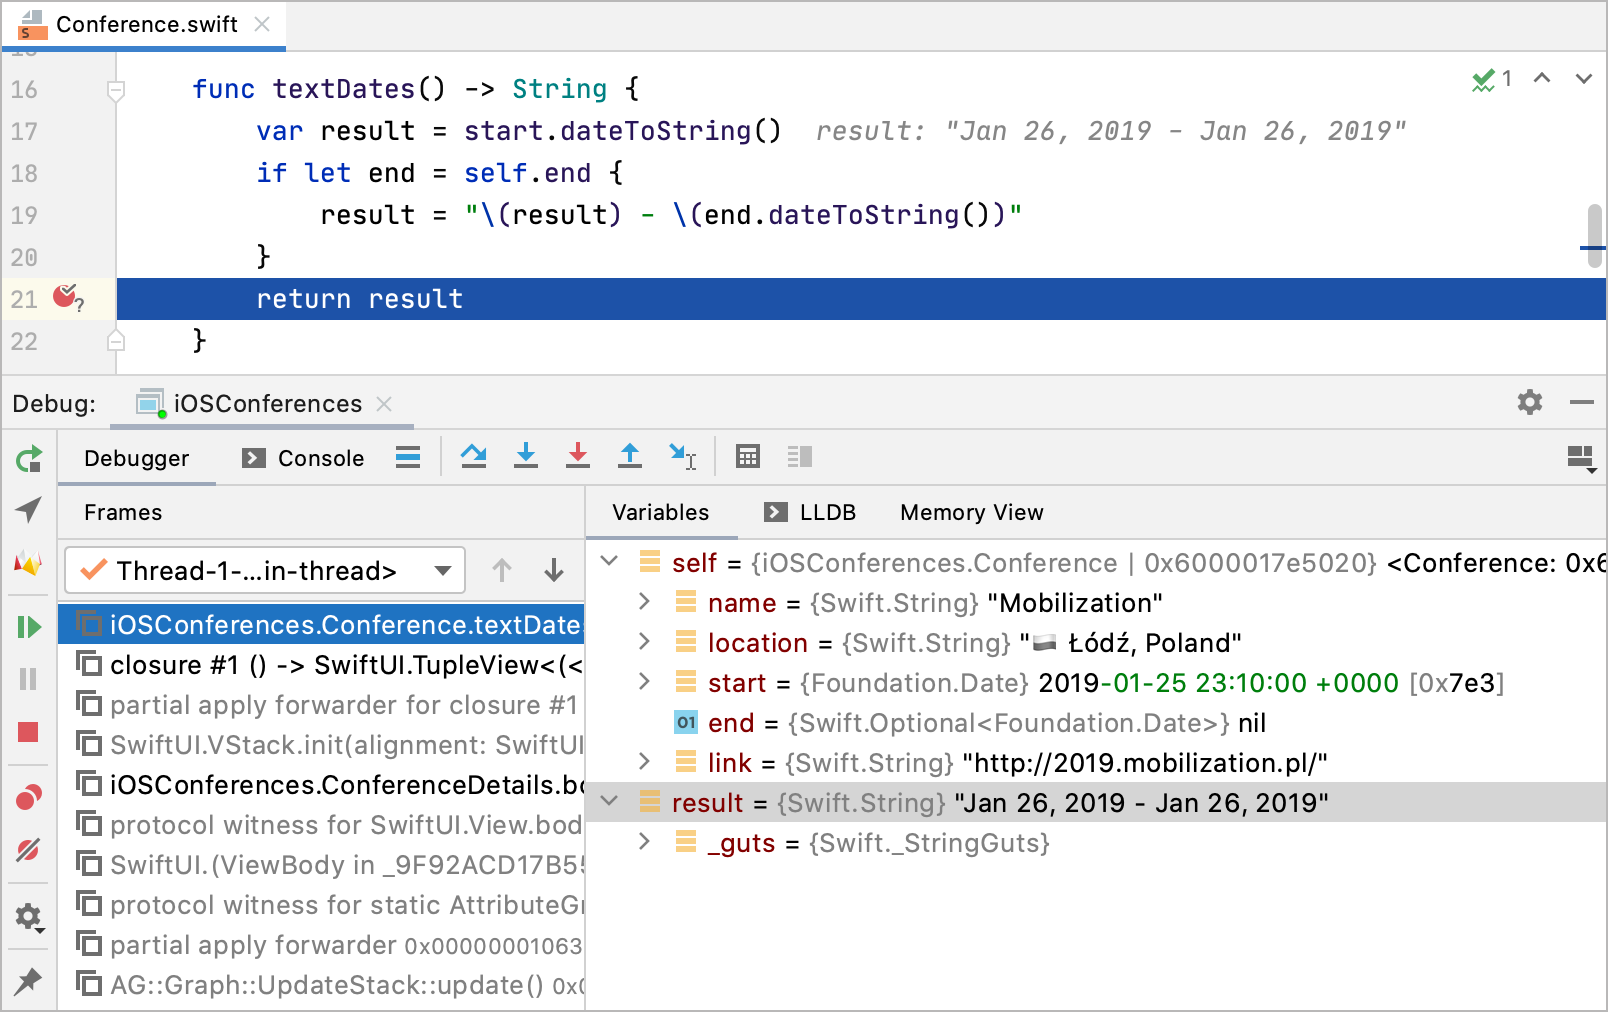
Let’s fix this bug by setting a new variable value at runtime. Go to the file and line specified in the error message (press ⇧⌘O and type filename:line number), set a line breakpoint ⌘F8 at the first line of the textDates() method, and press ⌃D.
On the device or simulator screen, select the dot Swift conference to reproduce the bug. On the Variables tab and in the editor, you can see that the end date of the chosen conference equals nil:
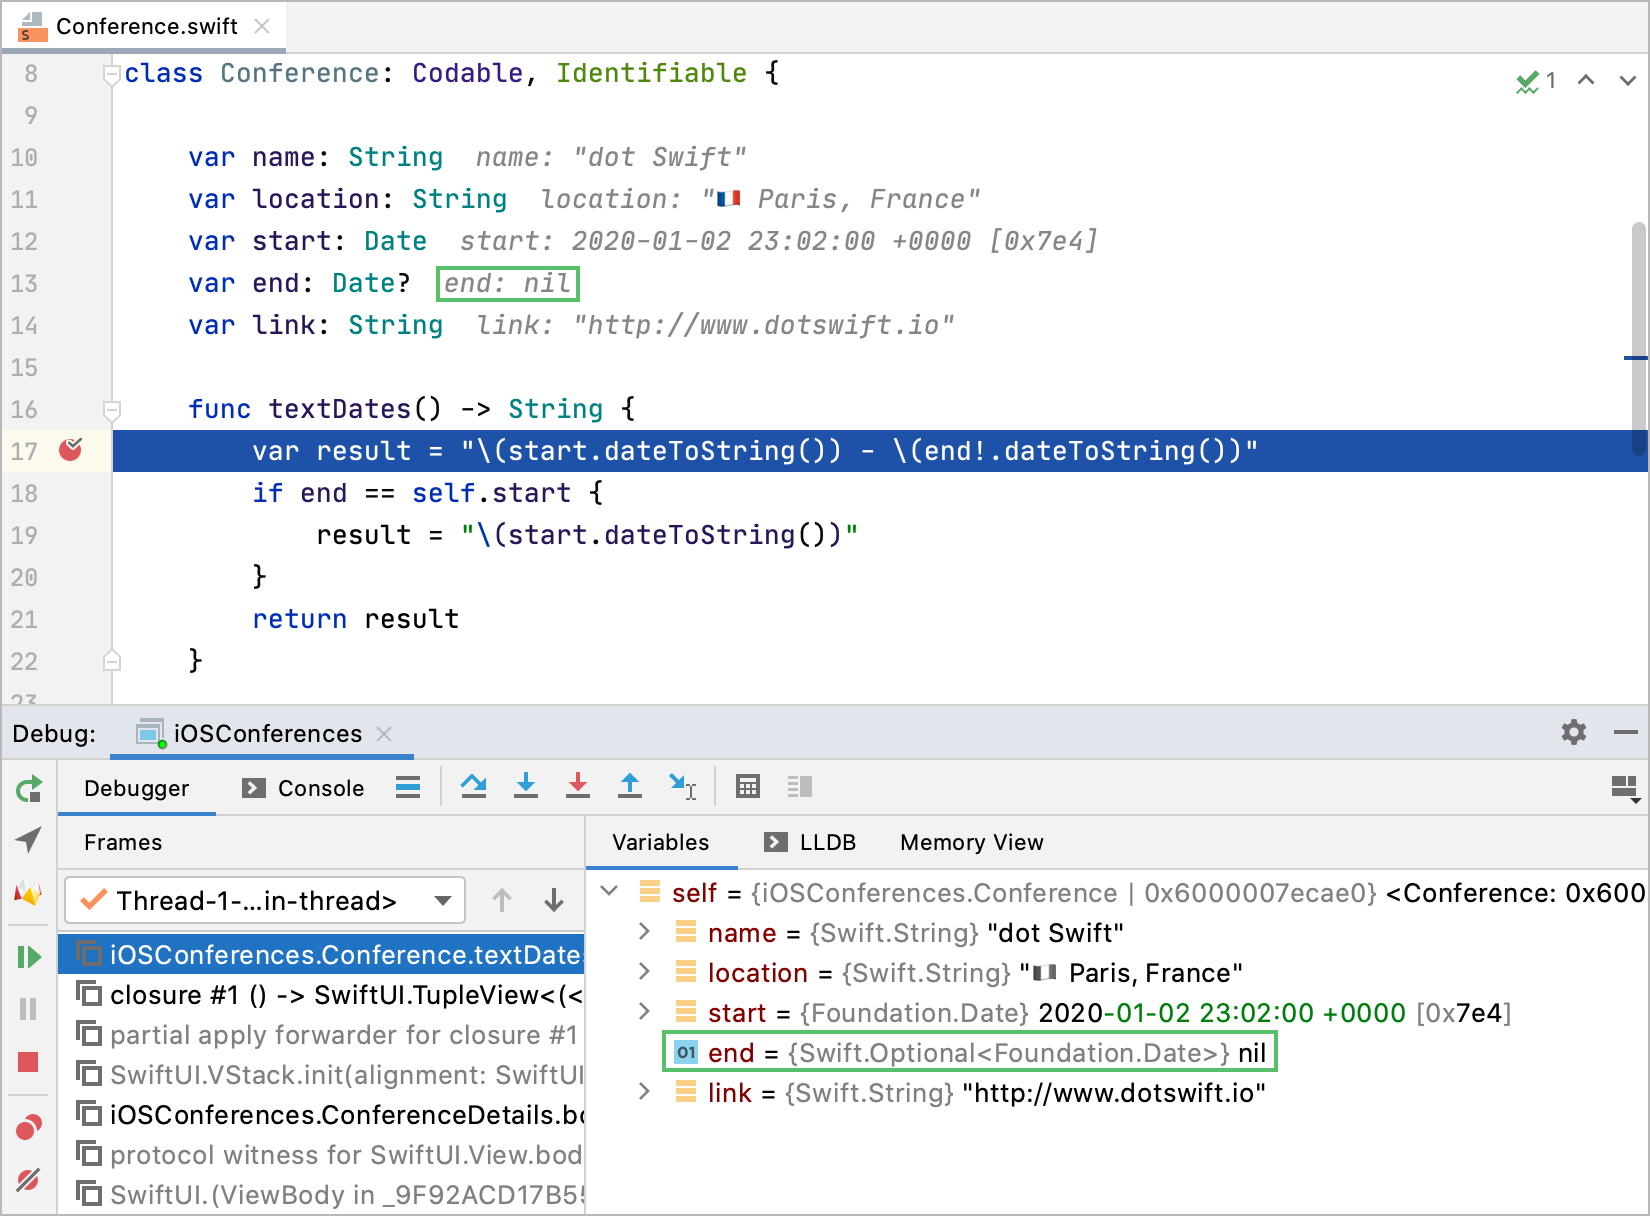
So, we see that the application is going to crash after executing line 17, more precisely, when trying to unwrap an optional value: end!.dateToString().
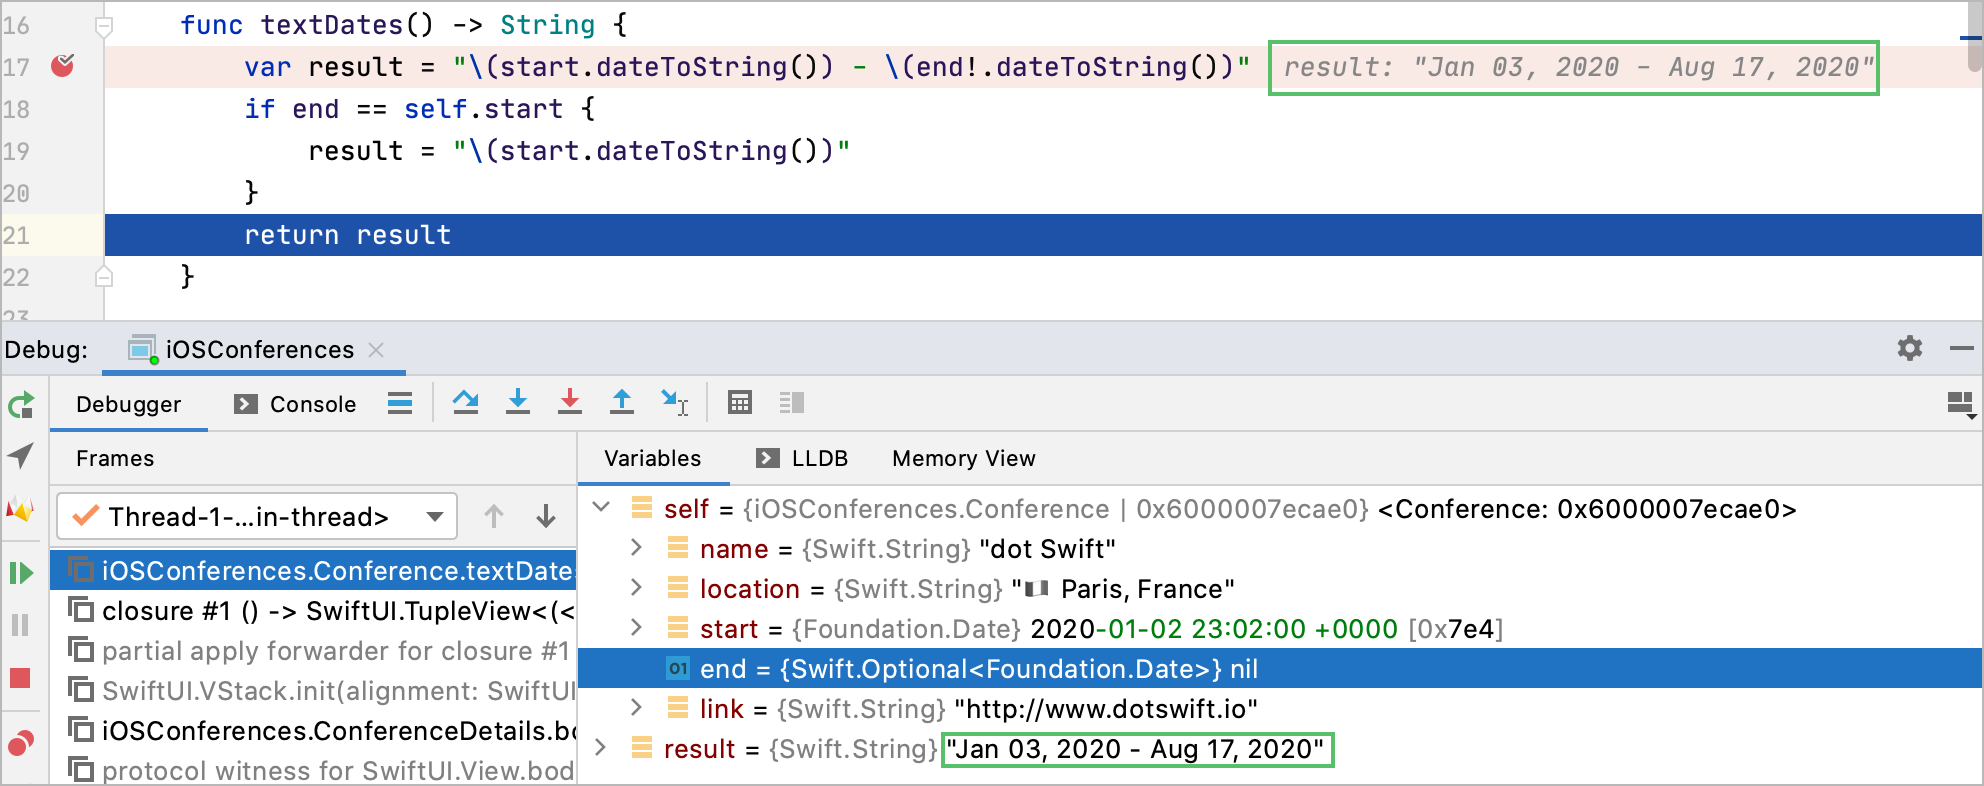
Let’s try to set a non-nil value for the end variable to ensure that it is the reason for the bug. Select the end variable on the Variables tab and press F2. In the text field that appears, type Date(), press ⏎, and press F8 or click ![]() button to execute line 17. The application doesn’t crash now because we’ve set the current day as a value of the
button to execute line 17. The application doesn’t crash now because we’ve set the current day as a value of the end property:
To fix this bug, replace the code of the textDates() method with the following:
func textDates() -> String {
   var result = start.dateToString()
   if let end = self.end {
       result = "\(result) - \(end.dateToString())"
   }
   return result
}
Run the application and check that now the dot Swift conference description opens without errors.
Set conditional breakpoints and add variables to watches
Problem
When selecting the Mobilization conference, you may notice that the day is displayed this way: Jan, 26 2019 - Jan, 26 2019.
Solution
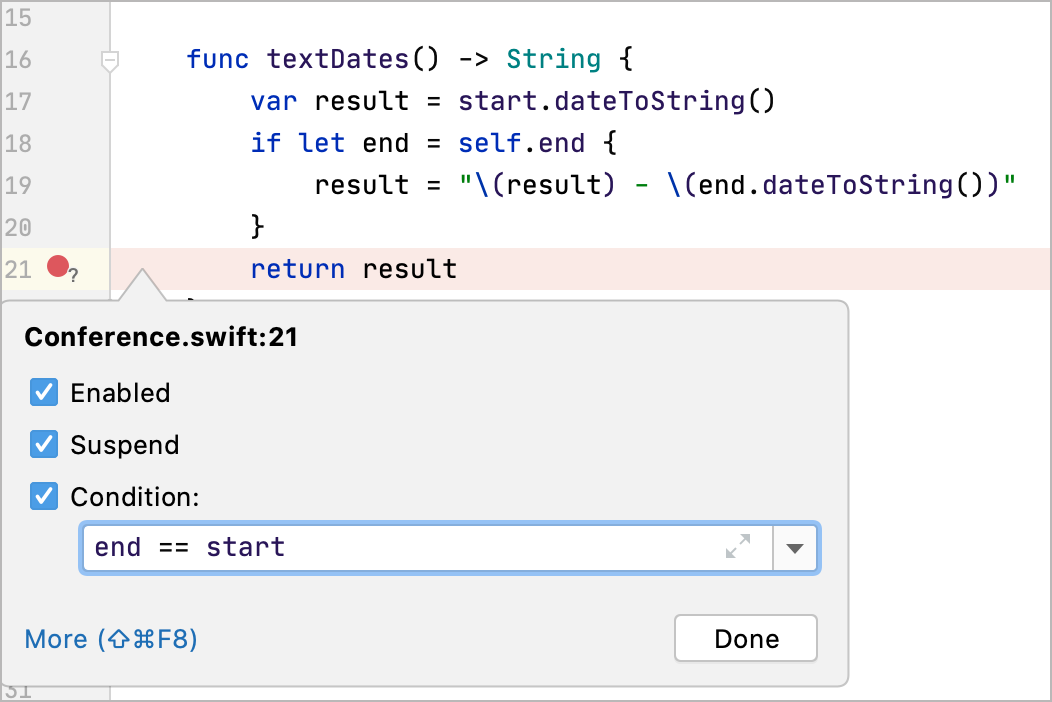
This happens because the textDates() method doesn’t handle the conferences with the same start and end dates correctly. Let’s add a conditional breakpoint that will stop the program execution only when calling textDates() for one-day conferences. For convenience, we will display the conference data on the Watches tab. Set a new breakpoint at line 21 (⌘F8) and remove the previous one at line 17 by clicking its icon in the gutter. We want the new breakpoint to stop the program execution only when the end and start dates of the conference are the same. For this purpose, we can create a special condition: right-click the breakpoint and in the Condition field type end == start:
Run the application in debug mode ⌃D and select random conferences from the list. The program execution will stop only when the specified condition is satisfied, for example, on selecting the Mobilization conference:
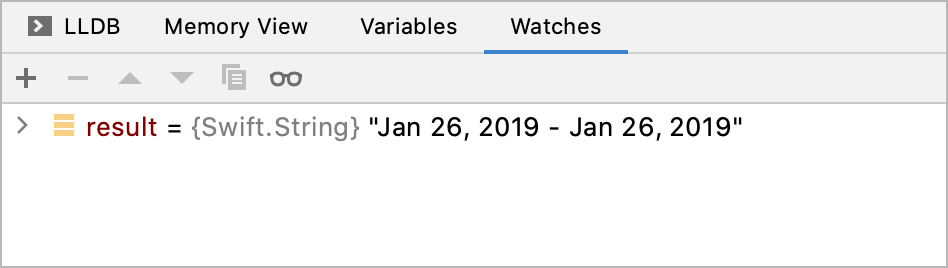
Now when the program is paused, and the Debugger tab is available, let’s add the result variable to watches, which will allow us to observe the variable state in a separate tab. To do this, right-click the variable on the Variables tab and select Add to Watches. If the Watches tab is currently hidden, click ![]() button and select Watches in the list.
button and select Watches in the list.
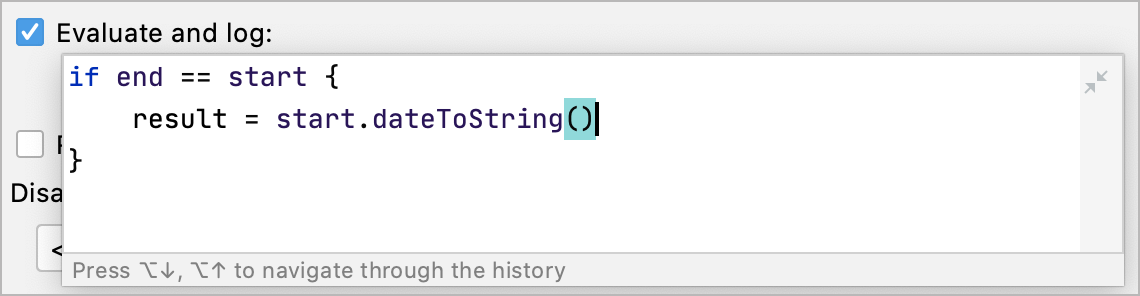
You can add any variable you want to observe to watches. For example, you can also add the name variable to see the name of the current conference. To fix the bug, write a condition that handles the equal start and end values. Firstly, change the result value at runtime using the Evaluate and log field of the Breakpoints dialog ⇧⌘F8:
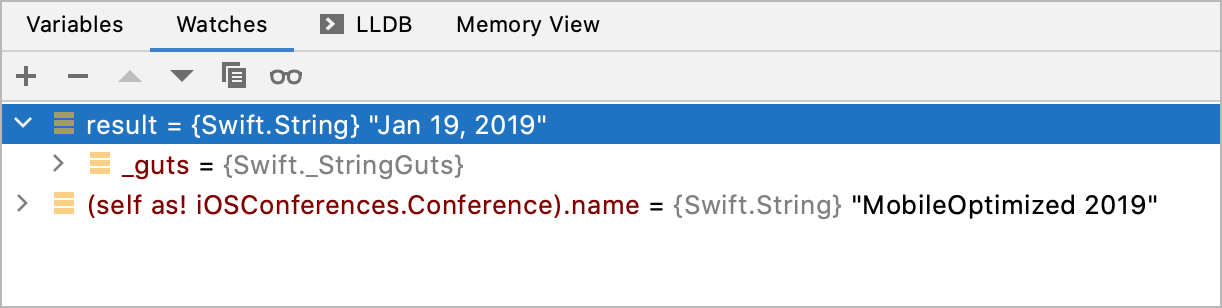
Resume the program execution ⌥⌘R and choose other conferences from the list. When a conference has the same end and start dates (for example, Mobilization or Mobile Optimized 2019), the execution will stop. On the Watches tab, you will see the correct value of the result variable:
Since the code added at runtime has fixed the issue, you can add it in the editor and rerun ⌃R the application:
func textDates() -> String {
    var result = start.dateToString()
    if self.end == self.start{
        return result
    }
    if let end = self.end {
        result = "\(result) - \(end.dateToString())"
    }
    return result
}
Set symbolic breakpoints and work with the Disassembly view
Problem
Select the Swift Leeds conference and click the Go to official website link. The linked web page cannot open as the address contains an error.
Solution
Let’s handle such cases with symbolic breakpoints: we will add a breakpoint that will stop the program execution any time a URL is opened in the application. Go to the Breakpoints dialog ⇧⌘F8, click ![]() button, and select Symbolic Breakpoint. In the Symbol Name field, type the following:
button, and select Symbolic Breakpoint. In the Symbol Name field, type the following:
[UIApplication openURL:options:completionHandler:]
open(_:options:completionHandler:) Swift method, you should type openURL(:options:completionHandler:).
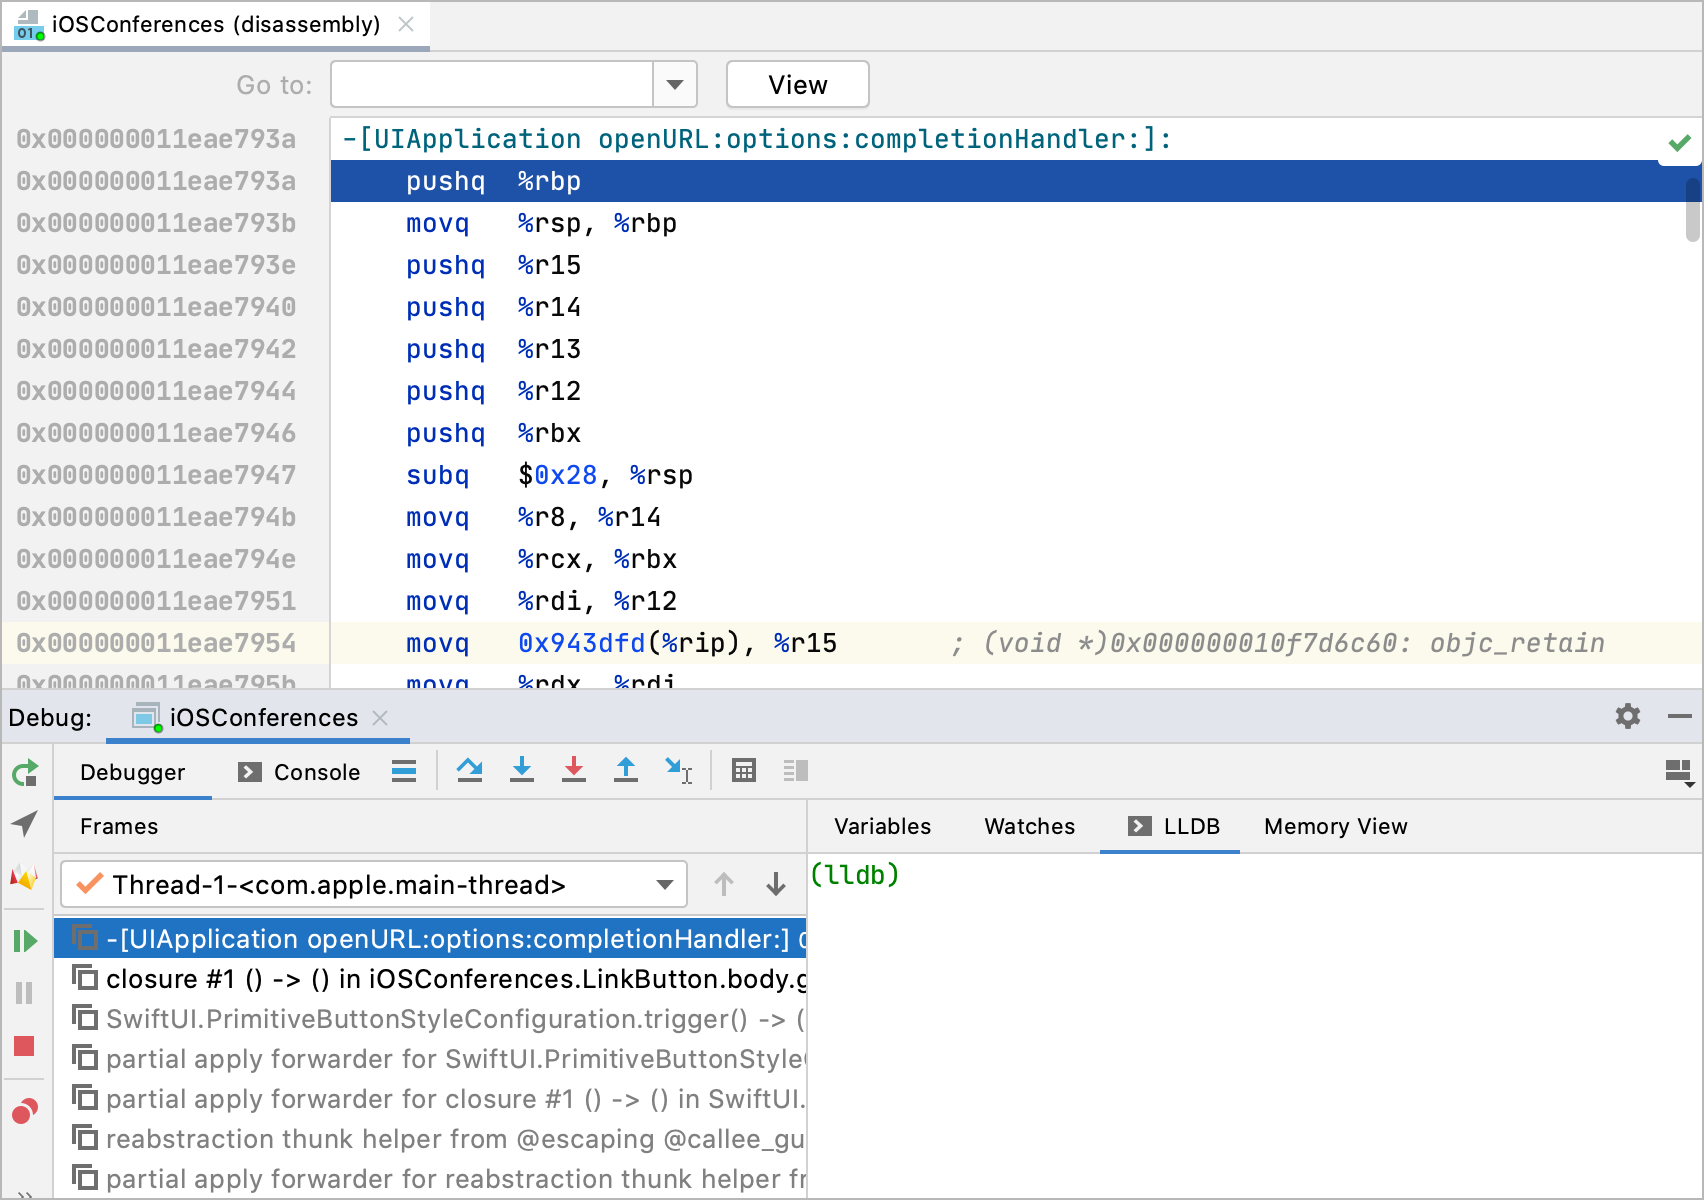
Press ⌃D to start debugging and open the same link. The program execution will stop at the method specified for the symbolic breakpoint, and you will see the disassembled code of this method in the dedicated view:
Go to the LLDB tab of the Debug tool window and type the following command in the LLDB console: po $arg3. This will return the first parameter of the method the debugger stopped at:
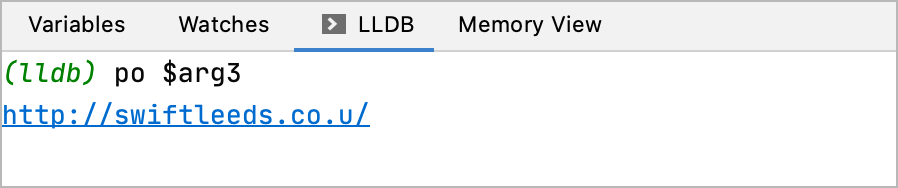
This is an invalid URL passed as a parameter of the open(_:options:completionHandler:) method. Go to iOSConferences/Resources/conferencesData.json and correct the misprint:
{
    "name": "SwiftLeeds",
    "link": "http://swiftleeds.co.uk/",
    "start": "2020-10-07",
    "end": "2020-10-08",
    "location": "🇬🇧 Leeds, UK"
}
What’s next
To learn more about debugging tools available in AppCode, refer to the Debug code help section. The view debugging is not supported in AppCode out-of-the-box, but you can use the Reveal application for this purpose, see more in Debugging iOS Apps with Reveal. If you are used to debugging in Xcode, see our migration guide that points out the general differences between the two IDEs.