Qodana
The code quality platform for teams
Unity Tools: How to improve code quality in game development with Qodana


Table of Contents
If you aren’t already familiar with JetBrains Qodana, it’s a code quality platform that extends static analysis to team reviews in CI/CD systems.
Part of its power is that it allows your team to collaborate more effectively – especially when it comes to setting code review standards and quality gates. This process can also promote stricter adherence to those standards from everyone on the team.
Our VR Unity team decided to take Qodana for a spin on an internal Unity project – Archipelago, a virtual reality app that visualizes sales in the form of mountains. Qodana brings all of Rider’s Unity inspections to CI analysis so the whole team can review code, making it one of the most exciting unity tools for VSCode and JetBrains users. A junior developer helped with the analysis to determine whether or not it was beginner friendly.
Our hope was that this could be a learning experience for some of the junior developers and a helpful tool for improving code quality. It turned out to be more than that, as it helped junior developers deliver more senior-level code. Below, the team details the steps they took to run the analysis and they share their experience.
Prerequisites: pipeline setup
Before we started using Qodana, we already had a build pipeline configured in TeamCity. This pipeline was building a Unity project with the help of a Linux Docker image containing a Dockerized version of Unity Editor. This provided us with a built APK of the project every time we created pull requests on the main branch.
To get the Qodana analysis report, we took the following steps:
1. Create project on Qodana Cloud
2. Generate the solution and install all required packages.
Unity projects typically don’t include a C# solution and project files, and these need to be generated in order for Qodana to process them. We installed the corresponding .NET SDK in the build environment and executed the following script on each build:
#!/usr/bin/env bash

${UNITY_EXECUTABLE:-xvfb-run --auto-servernum --server-args='-screen 0 640x480x24' unity-editor}
 -batchmode -quit -projectPath $UNITY_DIR -executeMethod Packages.Rider.Editor.RiderScriptEditor.SyncSolution
3. Add qodana.yaml file to the repository root of our project.
<a href="ide: QDNETversion: "1.0"baseProfile: "qodana.recommended"">ide: QDNET

version: "1.0"

baseProfile: "qodana.recommended"</a>
4. Set up an environment variable named QODANA_TOKEN in the pipeline configuration so it is accessible to Qodana. The token should be taken from the project page in Qodana Cloud.
5. Start the Qodana analysis.
Since we were using a customized build pipeline, we decided to use the Qodana CLI to launch Qodana in Native mode (on the build machine) rather than starting containers to host it. To do so on a Linux machine, we had to download the Qodana CLI. This isn’t necessary with GitHub, GitLab, or Azure DevOps pipelines. You can find out more about Qodana’s integration with various CI systems here.
To run the analysis correctly, we needed to execute the command below in the folder where the project is located. The output and report is then generated in the /report folder. For convenience, we modified the build pipeline configuration so that the report was accessible with the build artifacts.
curl -fsSL https://jb.gg/qodana-cli/install | bash
qodana scan -i $(pwd) -o /report
As a result, with every change to the main branch, we got not only an APK file but also a report in Qodana Cloud that we can view in the browser or open in Rider.
Qodana report setup
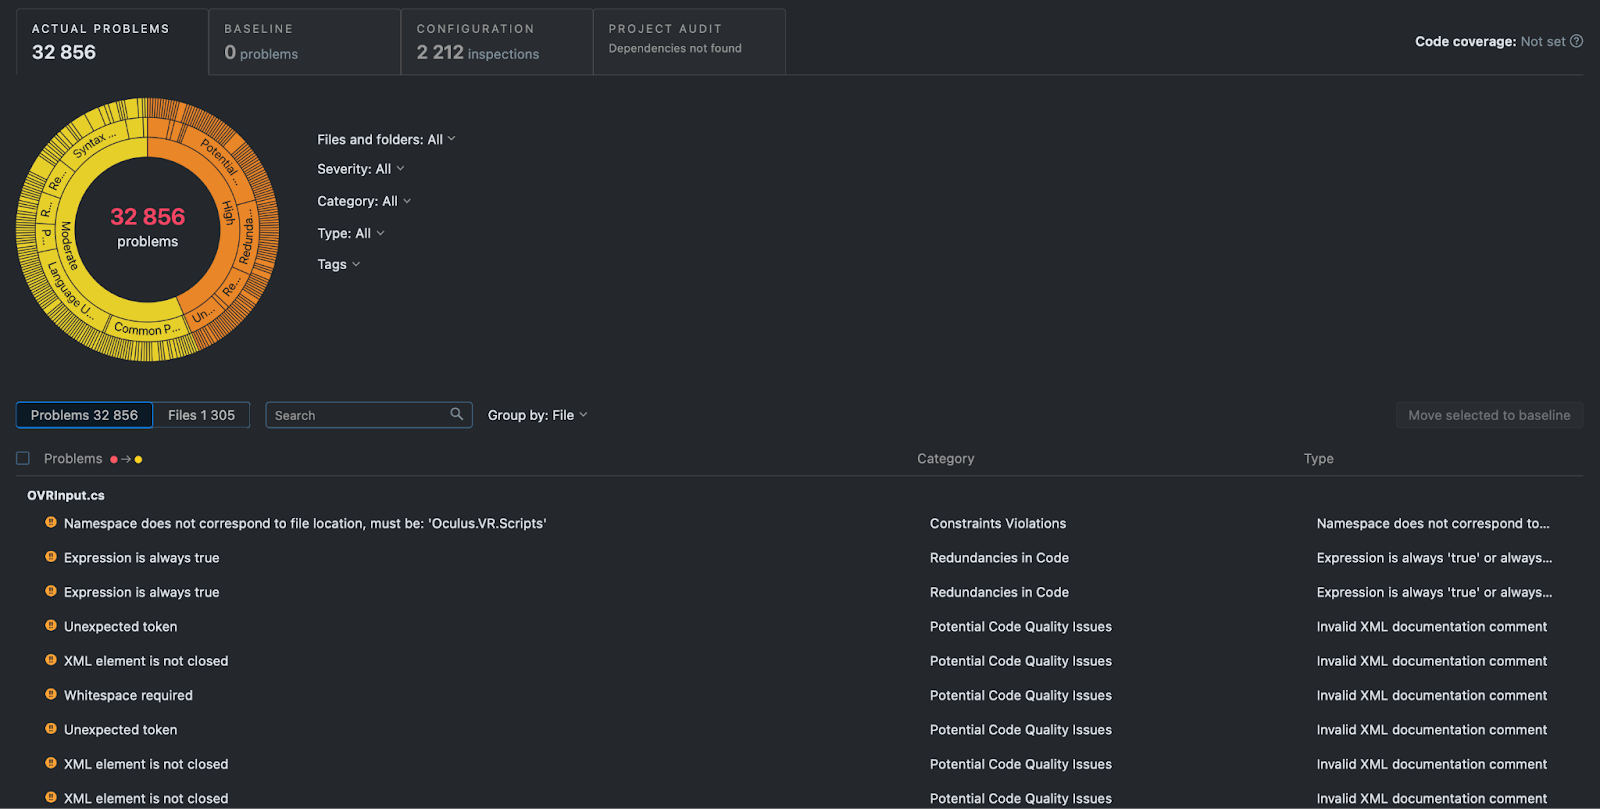
We initially got a report with almost 33,000 problems. Don’t panic, they were not all ours! When we triggered the analysis with the default profile, we accidentally got problems from all Unity libraries and assets from the Asset Store.
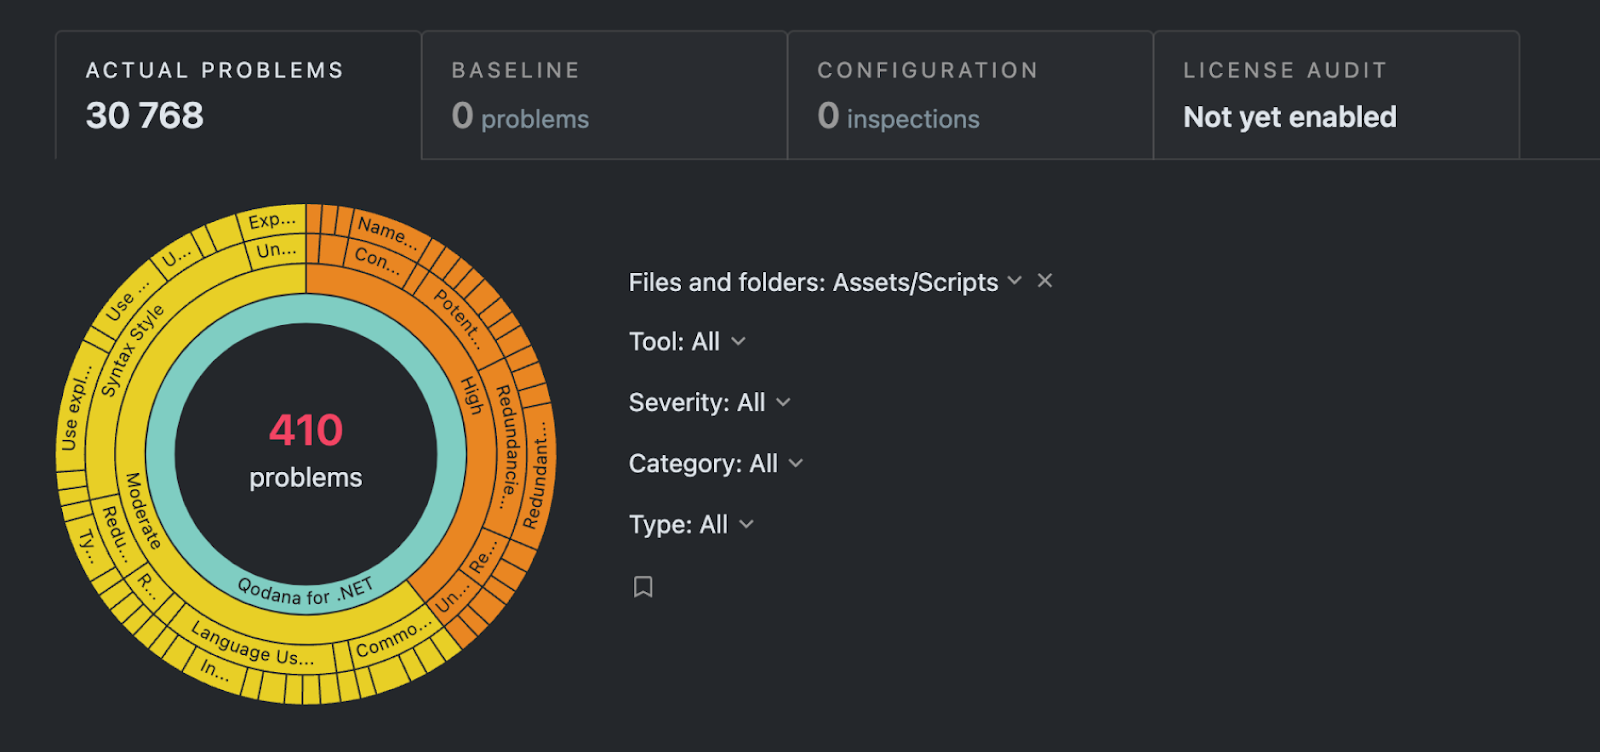
When we chose our Scripts folder within the UI, we got about 400 problems. In our opinion, this was still a lot, but we decided to take a deeper look.
We were able to work with this report, but if we tried to open it in the IDE, we would still get the whole report with 32,856 problems, which was not very useful. To get analysis for only our codebase, and not the whole project, we added a custom profile. We then updated our qodana.yaml file so it only contained a link to our profile, making it much easier to work with.
ide: QDNET

version: 1.0

profile:

   path: profile.yaml
qodana.yaml
The profile.yaml file contained inspections for our full analysis. We wanted to view the Scripts folder only, so we used scopes to do so.
baseProfile: "qodana.recommended"

inspections:

  - group: ALL

    ignore:

- "scope#!file:Assets/Scripts//*"
profile.yaml
Working with the report
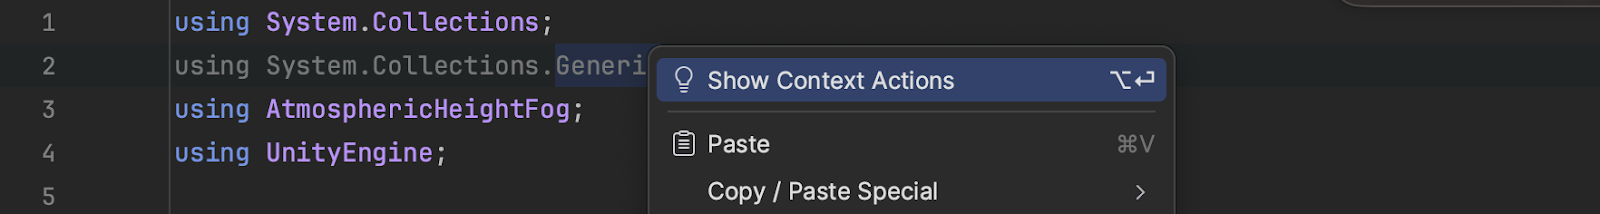
After we’d selected the right profile and gotten the right report, we looked at alerts more closely. You can find out more about how to link Qodana reports with Rider in the documentation. Most of the alerts identified redundancies and constraint violations, like Redundant using directive or Namespace does not correspond to file location.
Problems like these can be fixed in a few clicks with the help of Context Actions in the IDE.
Besides the redundancies and constraint violations, a lot of the alerts were about syntax errors or non-compliance with common practices. In most cases there were missing private modifiers or members that could be made private.
Next we selected separate categories for just Unity and Unity performance inspections. These could be addressed via quick fixes in the IDE using Context Actions, and the improvements helped with code efficiency and readability.
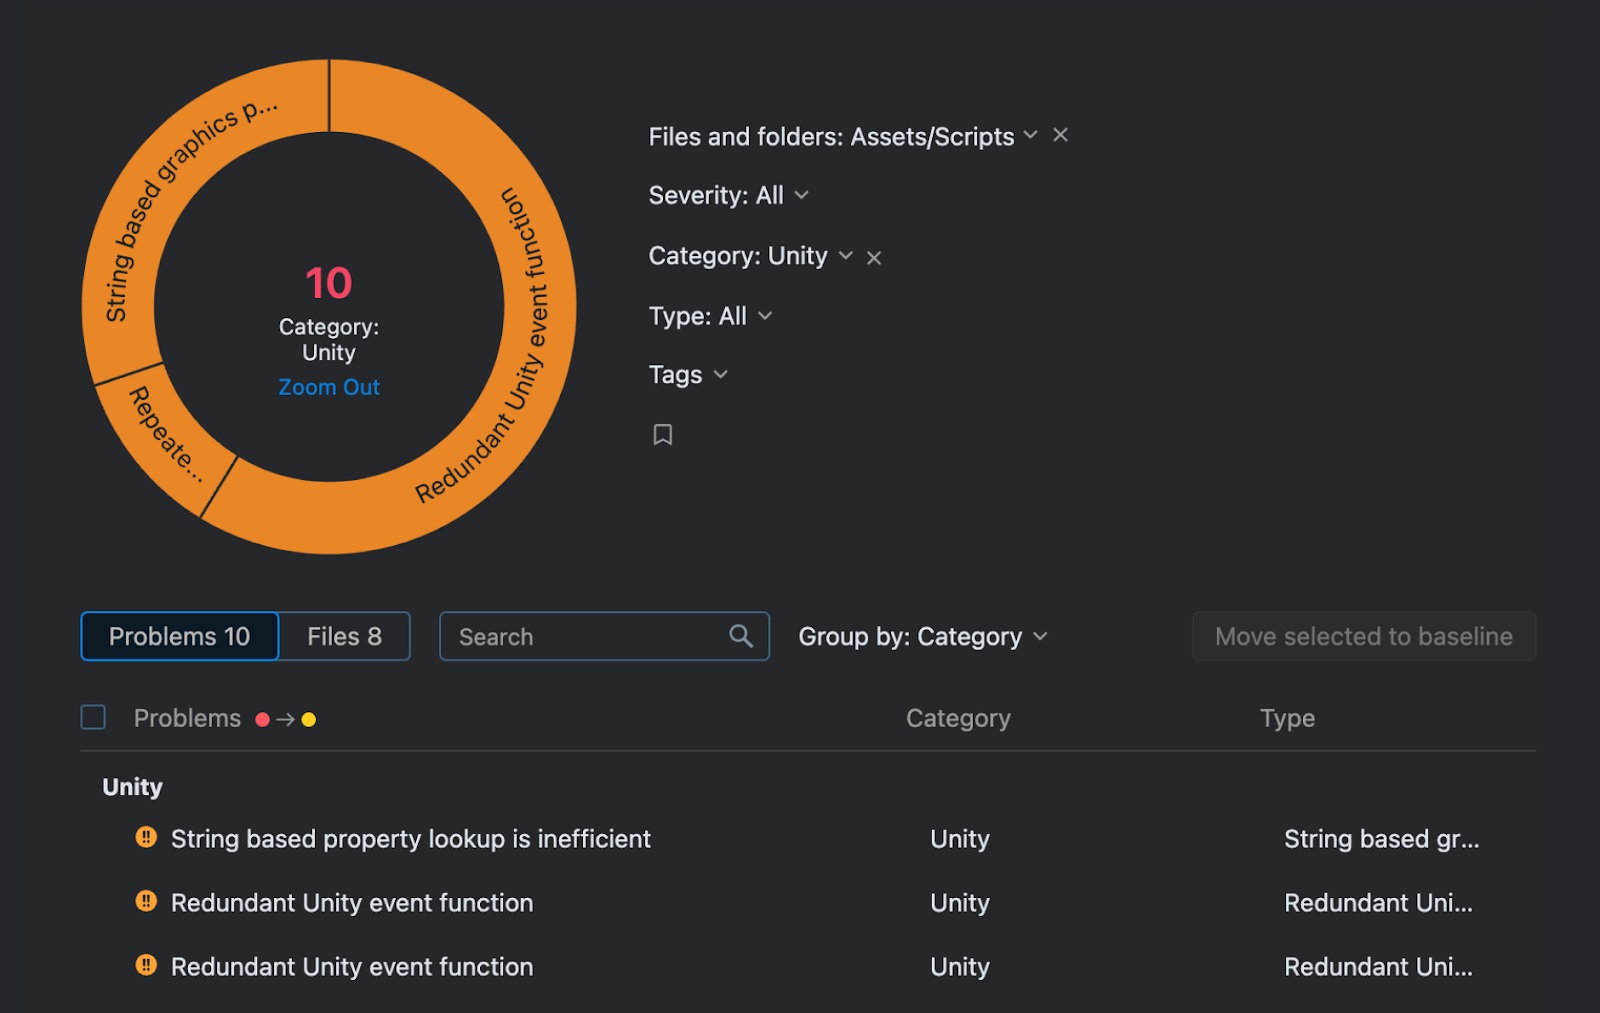
For issues like Expensive method invocation, we needed to rewrite some code. The most common of these typically involved moving the GetComponent method from performance-critical contexts to the Awake or Start event functions, as explained here.
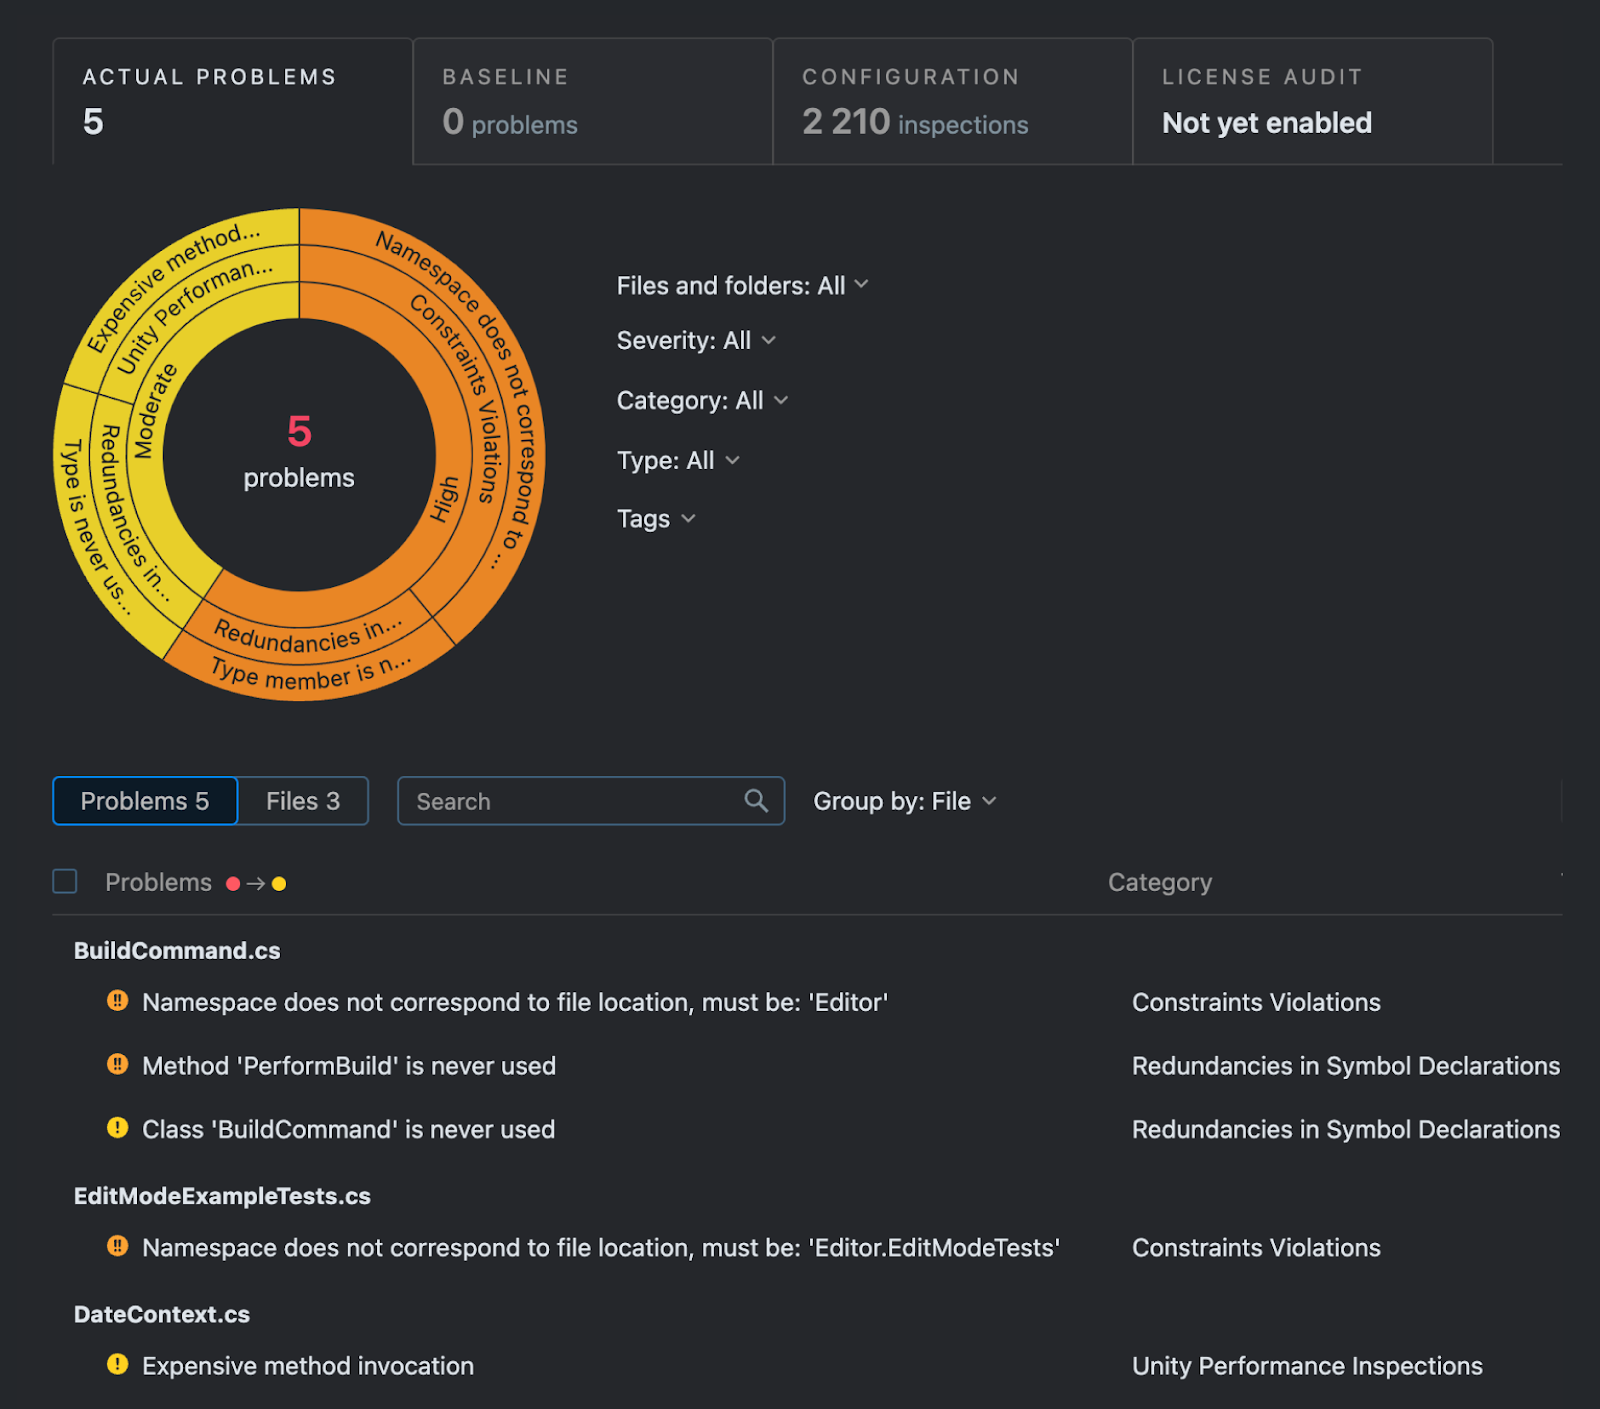
Working with the Baseline
Gradually, we got to the problems that were more complicated to fix. For example, the BuildCommand.cs class and PerformBuild method were used to create the build, but they were not called in Unity.
Next, in our case, there were method calls in DateContext.cs that were flagged as expensive. We decided to put such problems into the baseline, since those were considered non-issues for our project layout. The picture below shows a list of errors that we chose not to fix.
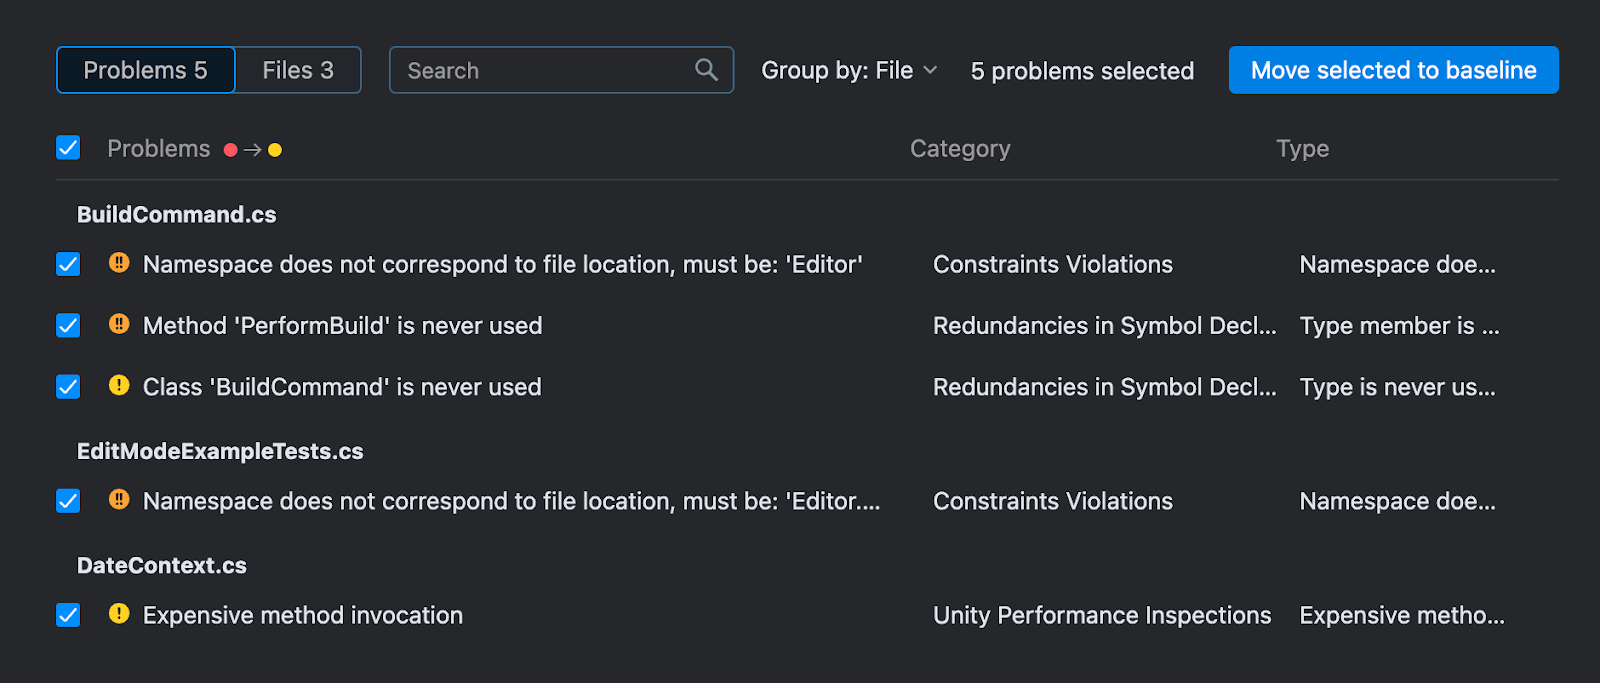
To add a baseline to our project, we downloaded the qodana.sarif.json file from Qodana Cloud and moved it to our root directory.
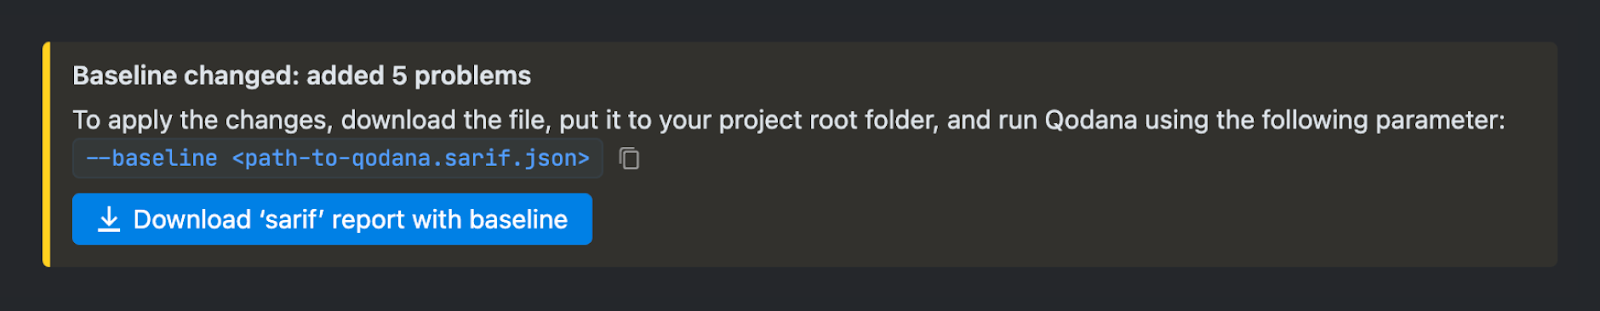
Then we added a baseline parameter to the build step.
curl -fsSL https://jb.gg/qodana-cli/install | bash

qodana scan -i $(pwd) -o /report --baseline ./qodana.sarif.json
The baseline parameter.
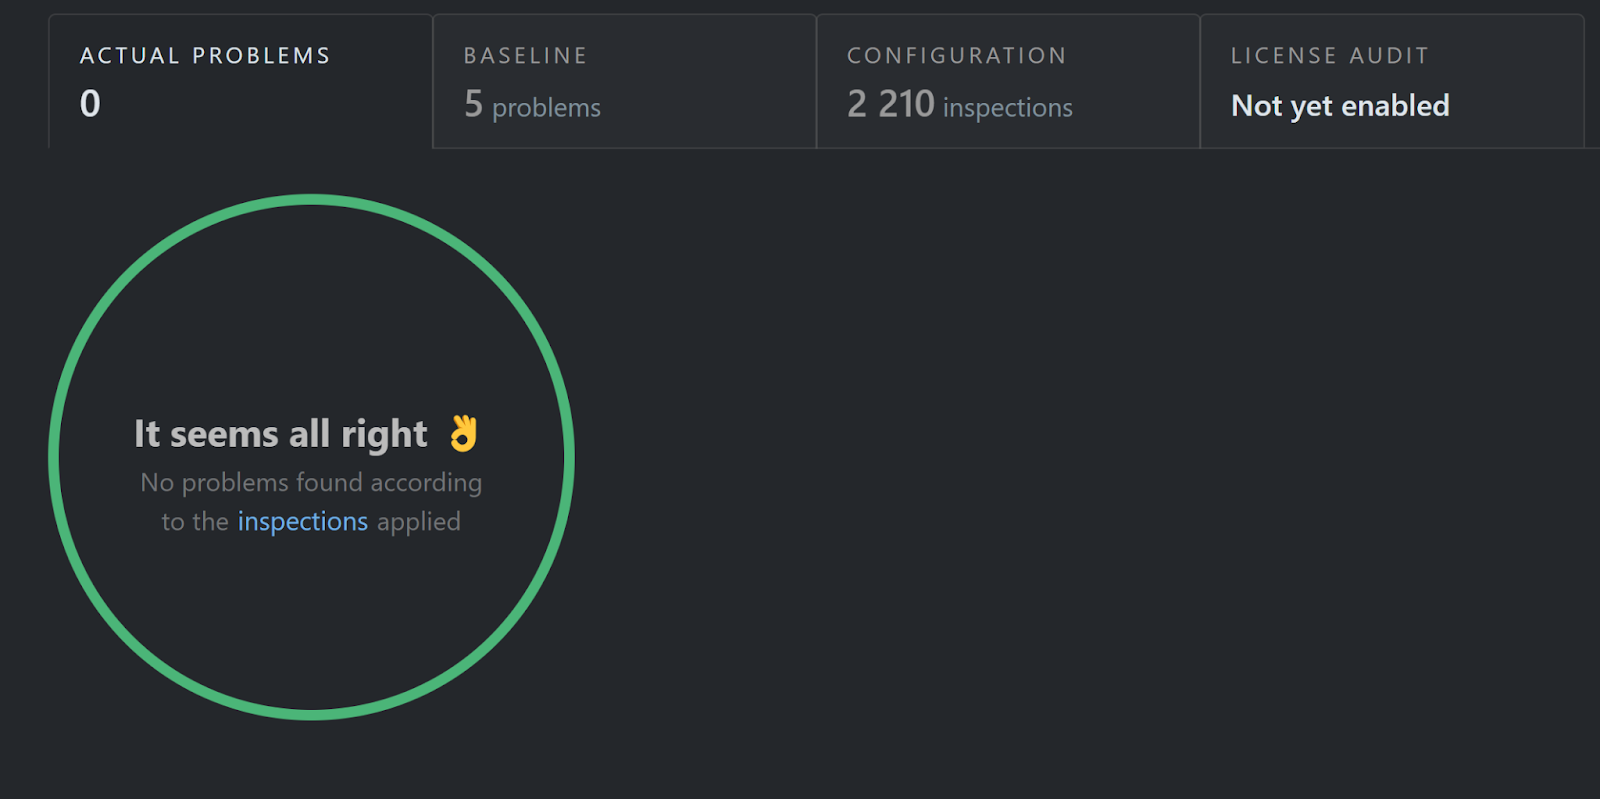
From then on, we would only get reports with new problems. But for the time being, everything seemed alright.
A closer look at the results
Over the course of this experiment, we added Qodana to our TeamCity pipeline, configured profiles, got several analysis reports, and fixed almost all of the problems in our project!
As far as Unity tools go, using Qodana was a great help in reviewing our project’s code and making it much cleaner and more effective. The real power of Qodana comes with team collaboration, but it’s also an invaluable tool when it comes to helping teams implement static code analysis – especially for those using JetBrains IDEs (in this case Rider) or VS Code (with the Qodana VS Code Extension).
Install Qodana and try it yourself by following these instructions. Feel free to comment if you’d like to know more about our experience.
Guest contributor: Ekaterina Trukhan, VR Unity Developer
A message from the Qodana Team
Thanks to Ekaterina and the team for trying Qodana with Unity. If you have any questions about how to get started improving code quality, we’re here to help – just let us know in the comment section below or log an issue on Qodana’s YouTrack project. You can follow us on LinkedIn or Twitter for more updates.
Unity tools – recommended reading
Would you like to more about Unity tools for code quality? Bring all the custom Unity inspections from JetBrains Rider into your CI/CD pipeline – for better collaboration on team code in game development! Read more.