.NET Tools
Essential productivity kit for .NET and game developers
Rider 2024.1 EAP 3: Stepping Time Visualization, Inline Breakpoints, and UX/UI Improvements.

Another week, another Rider 2024.1 Early Access Program build out for your consideration! This latest update brings the long-awaited stepping time visualization for debugging and the ability to add multiple breakpoints to a single line of code, as well as a couple of improvements to the user experience.
Let’s dive straight in!
User experience
Option to show tool window names in the side toolbars
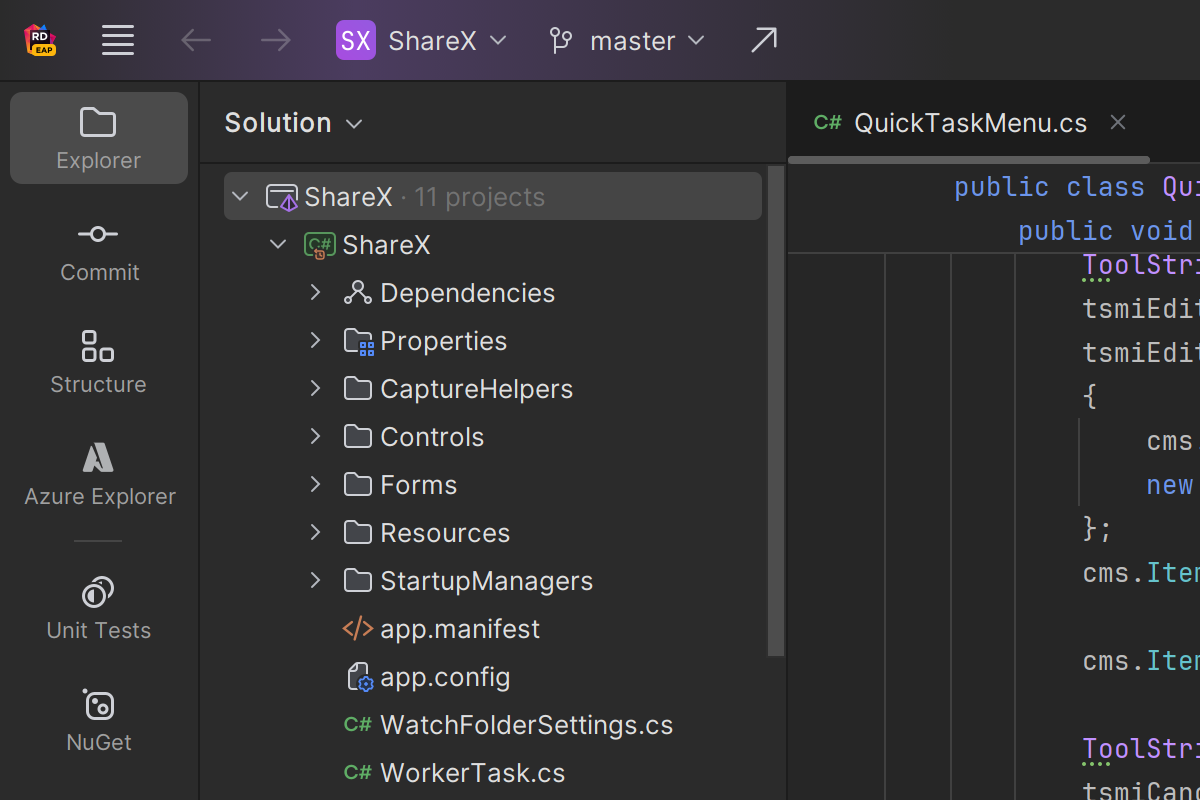
Starting with Rider 2024.1 EAP 3, it is now possible to display tool window names on the side toolbars in the new UI. Simply right-click on the toolbar to access the context menu and choose Show Tool Window Names, or enable this option via Settings / Preferences | Appearance & Behavior | Appearance | Tool Windows. It’s also possible to tailor the width of the toolbar by dragging its edge.
Option to scale down the entire IDE
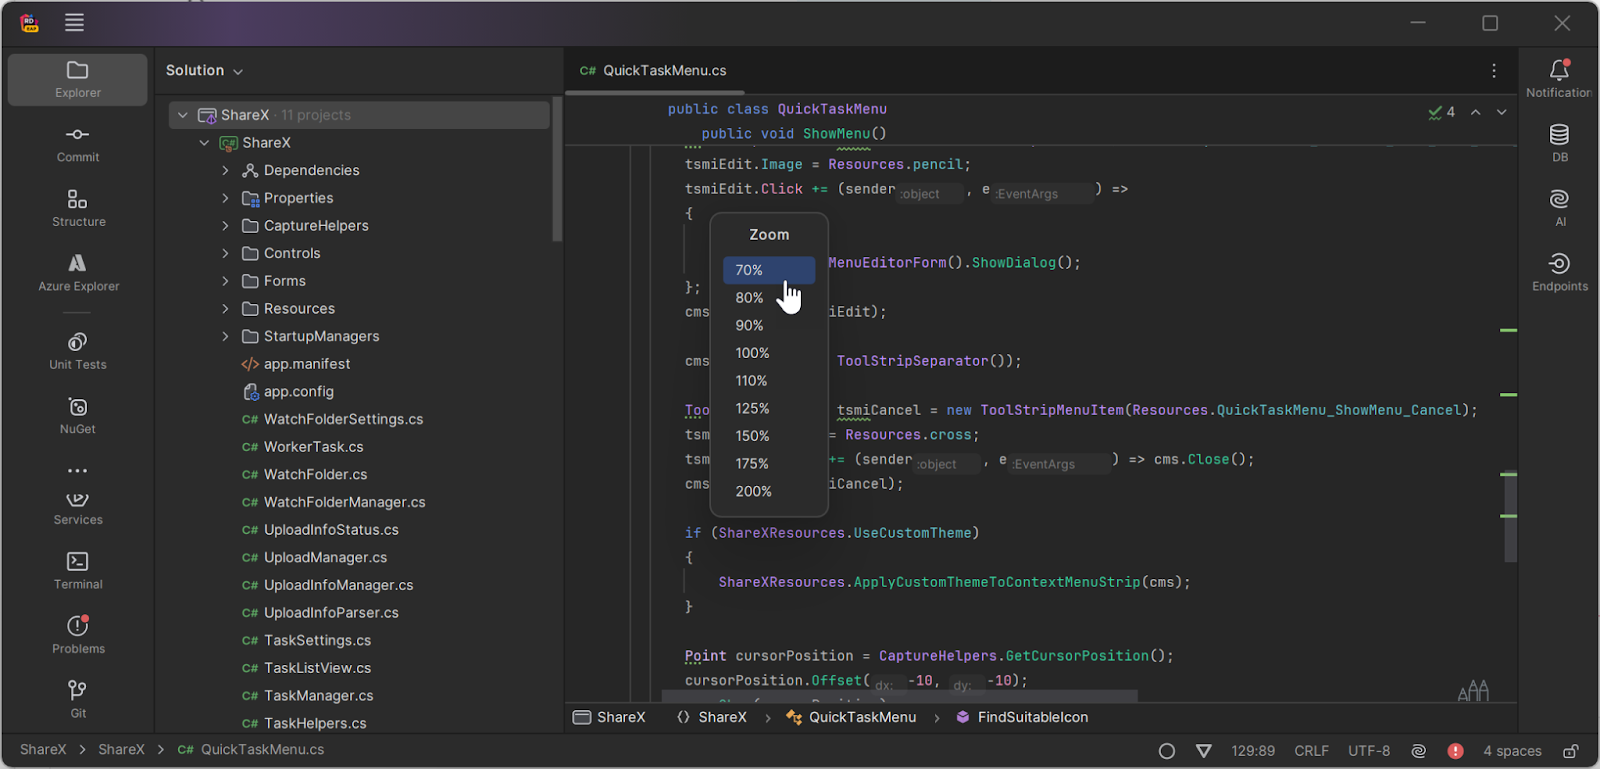
Previously, it was possible to zoom in and out across the entire IDE, simultaneously resizing all UI elements. However, the original scaling was limited to a range of 100–200%. In the 2024.1 EAP 3 build, we’ve added the ability to decrease the IDE’s scale down to 70%, giving you more flexibility when it comes to the size of everything.
Git tab removed from the Search Everywhere dialog
After analyzing the usage statistics, we’ve removed the Git tab from the Search Everywhere dialog by default. If you want to bring it back, you can do so via the Show Git tab in Search Everywhere checkbox in Settings / Preferences | Advanced Settings | Version Control |. Git.
Debugger
Stepping time
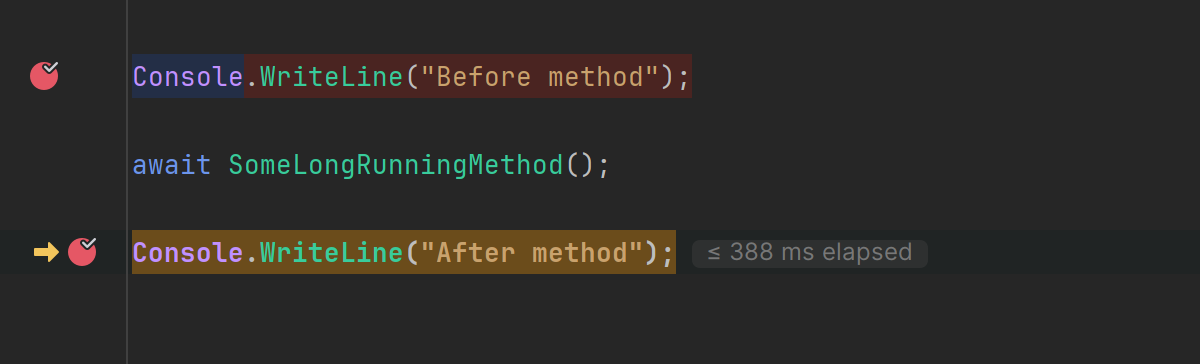
Being able to evaluate the time it takes for the debugger to execute the code between two breakpoints can be extremely valuable when debugging. If you find that the stepping time is excessively long, this might indicate performance issues in your code. When debugging an application with Rider, you will now see an inline hint displaying the time that elapsed between the last and current breakpoints.
This functionality uses Dynamic Program Analysis (DPA) to make the calculations more accurate. To get the best results, make sure DPA is enabled.
Stepping time is only available for applications targeting .NET Framework, .NET Core, and .NET.
Inline breakpoints
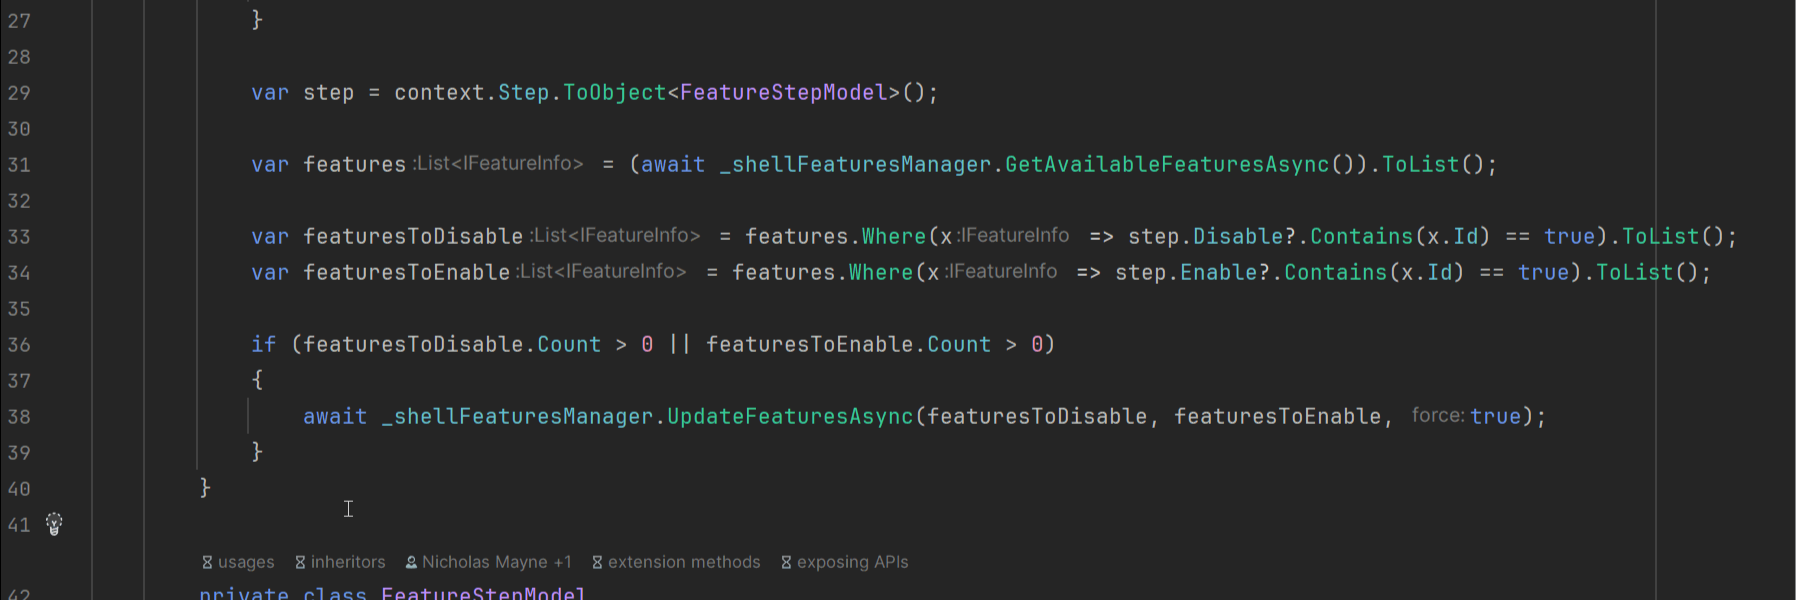
Starting with the EAP 3 build, Rider will allow you to set up multiple breakpoints on a single line of code if several statements are present. You can set the breakpoints either by using the relevant inline hints or via a key shortcut.
That’s it for now!
For the full list of updates included in this EAP build, check our issue tracker.
Please share your feedback on the latest Rider EAP builds in the comments below or on social media.