.NET Tools
Essential productivity kit for .NET and game developers
12 Debugging Techniques In JetBrains Rider You Should Know About

Nothing stops the flow of software development like an app-breaking bug. Bugs are a natural part of software development, but that doesn’t mean you need to spend more time fixing them than you want.
This post will explore 12 debugging features and techniques within the JetBrains Rider feature set to help you squash bugs and get back into the flow. Let’s level up!
1. Inline Watches
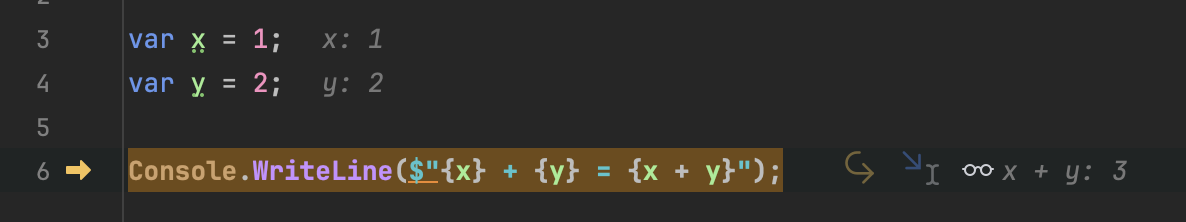
How often have you refactored code to add variables for debugging? Let’s take a look at the following code.
var x = 1;
var y = 2;

Console.WriteLine($"{x} + {y} = {x + y}");
It might be tempting to add var result = x + y to your codebase, but with JetBrains Rider’s debugging capabilities, it is unnecessary. During a debugging session, right-click on any line after the values you want to use and choose the “Add Inline Watch” option. You can type any expression, and Rider will display the evaluated result in the editor.
All inline watches persist across debugging sessions, allowing subsequent runs to take advantage of your previous work.
2. Return Values
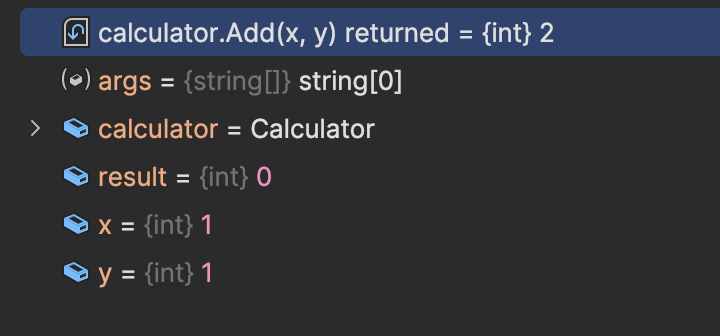
Like inline watches, you may want to see a value that execution hasn’t explicitly set to a variable. Return values are a common place for developer refactoring to add breakpoints to glean additional information. In the case of JetBrains Rider, we automatically add return values as inline watches.
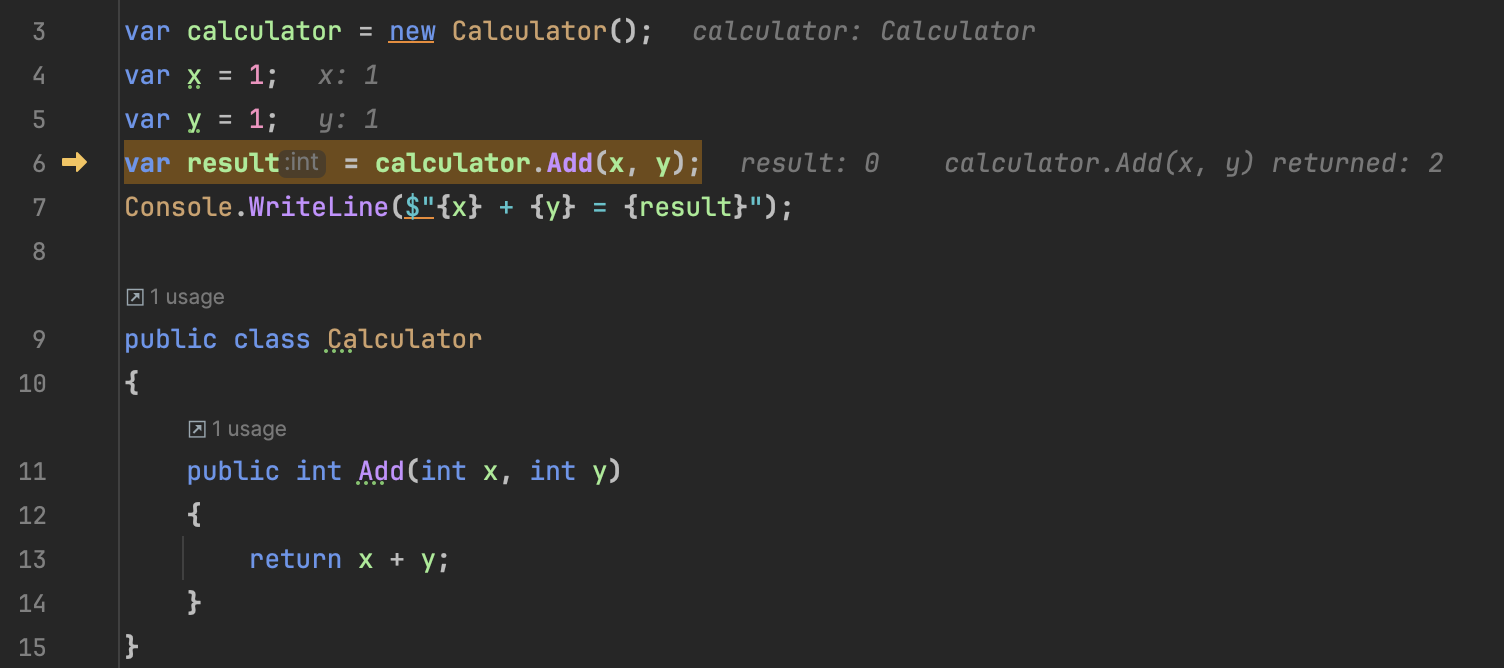
We also display the values in the debugger tool window and other debugging session values.
3. Smart Step Into Debugging
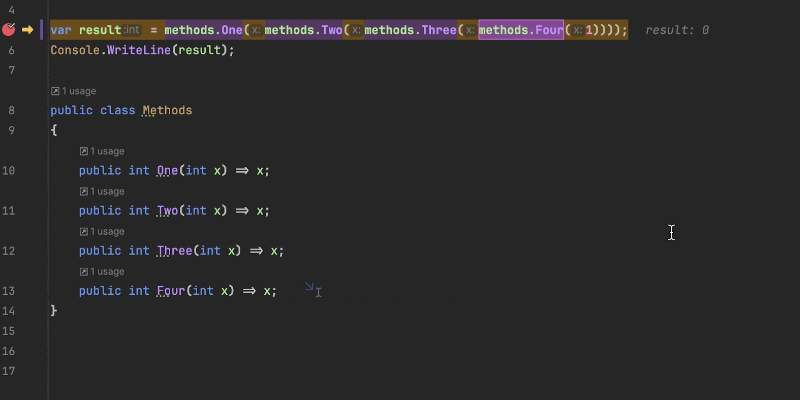
When chaining method calls into a single line, navigating through the call stack can feel like a spelunking expedition, traveling down until you find what matters to you. With Smart Step-Into, you can always choose the correct method, bypassing the others.
My colleague, Maarten, discussed the 2017 Smart Step Into Debugging blog post.
4. Breakpoints Options
In any application, a lot is happening in a debugging session. That said, you may want or need additional information during an investigation. You’ll see an icon with two overlapping breakpoints in the debugger tool window. When you click the icon, the Breakpoints options window lets you see existing breakpoints and define when and how they behave.
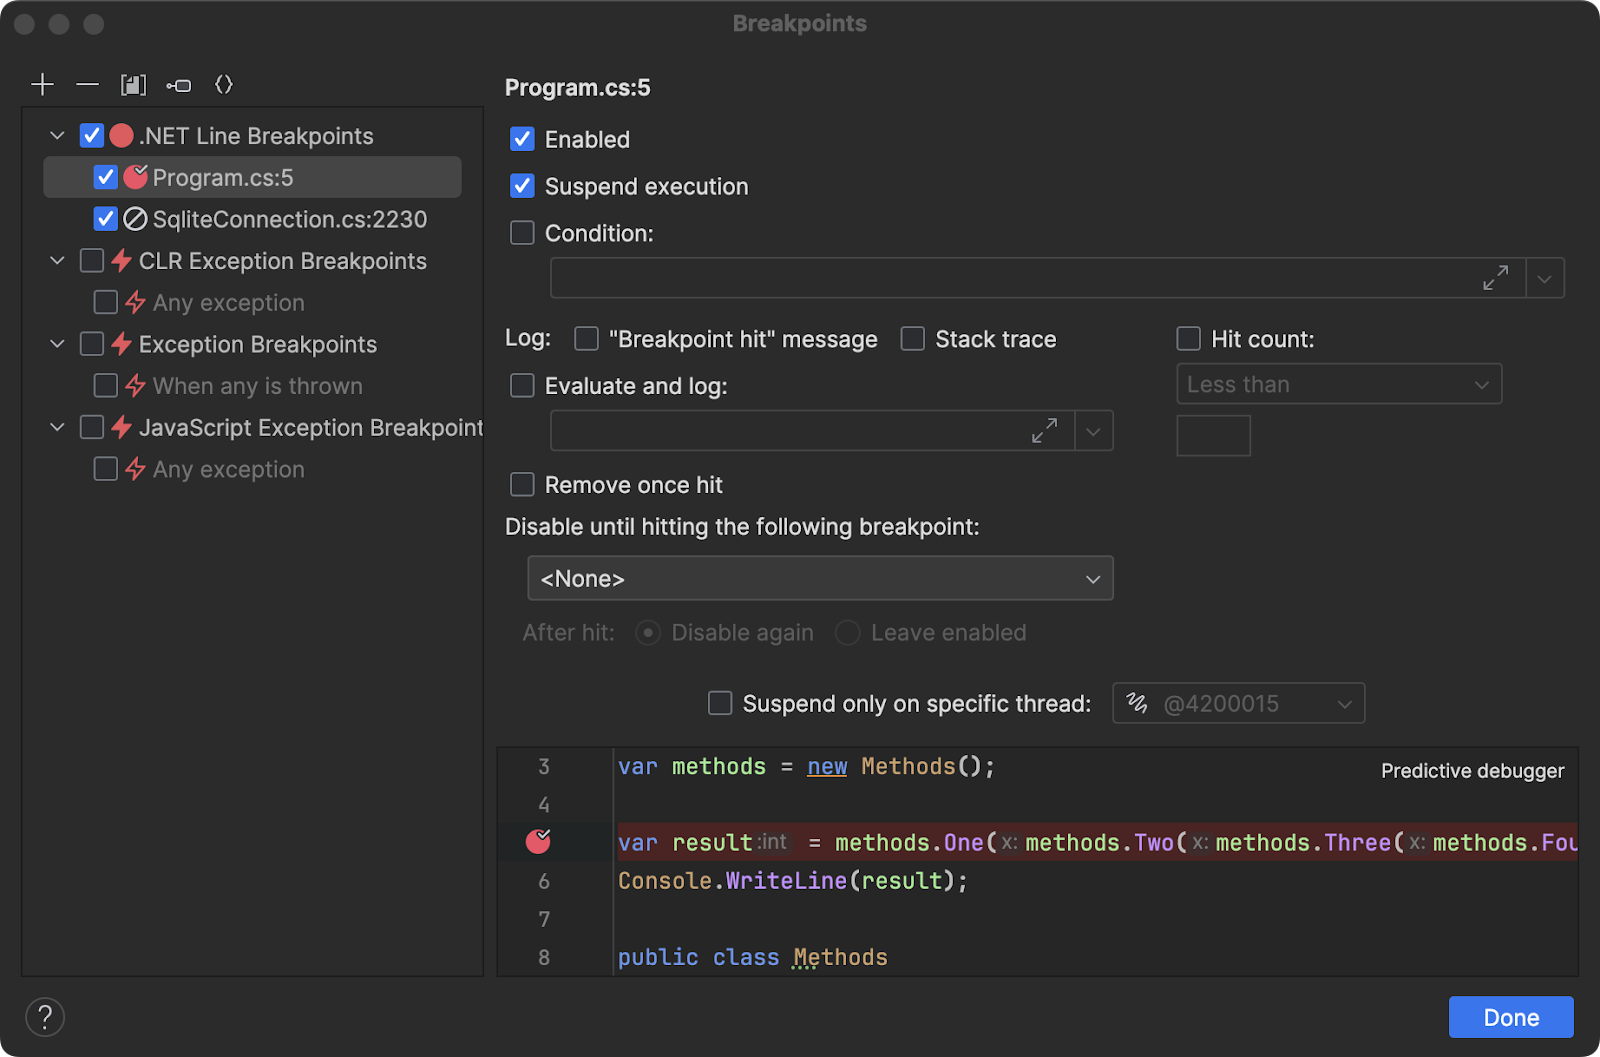
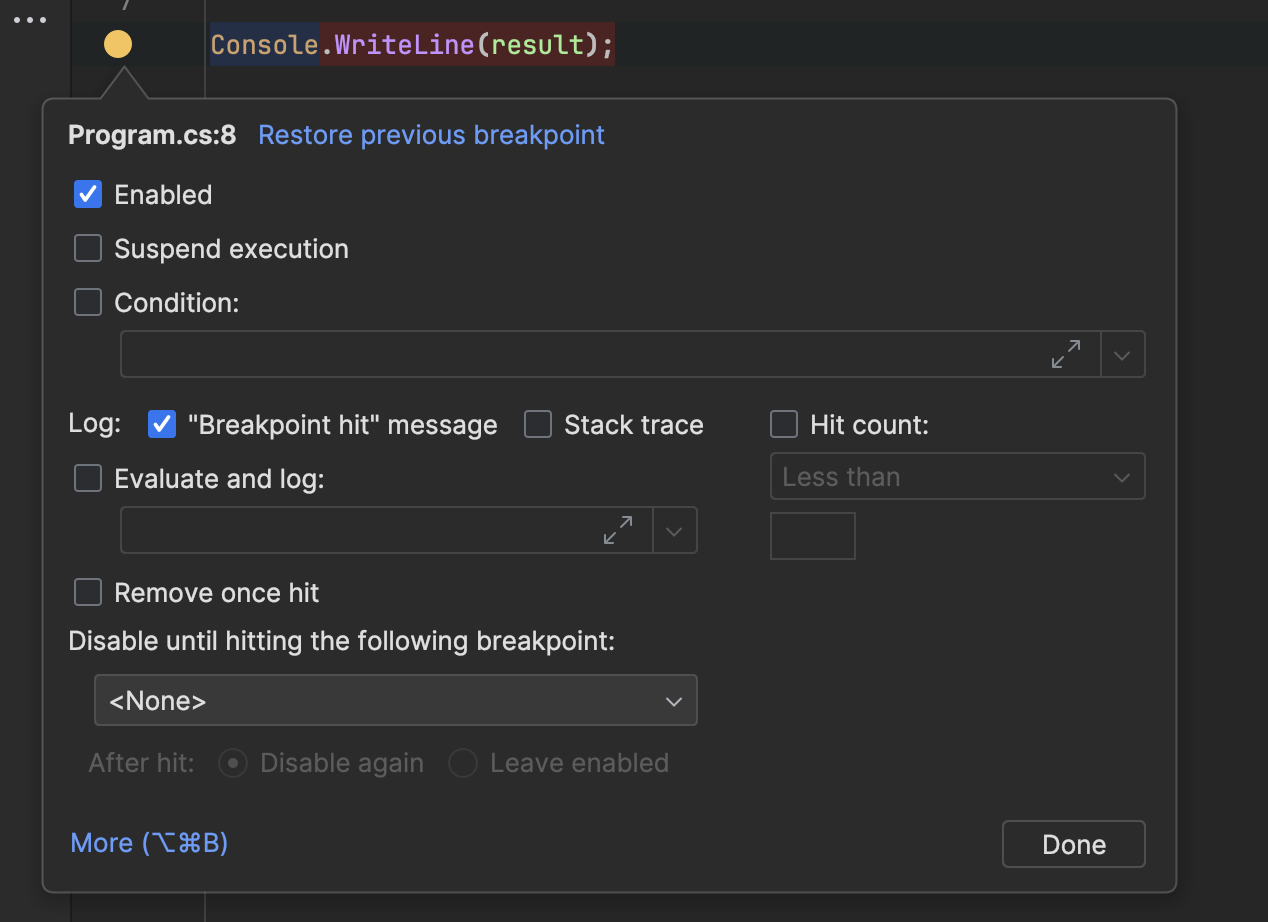
It’s worth exploring this window. The minutes invested here can save you hours later. You can also set breakpoints using “Shift+Click” to display additional options while setting a new breakpoint. Read more about the Breakpoints dialog in the JetBrains Rider documentation.
5. Drag Execution Pointer
Sometimes, you need to re-execute or skip a problematic line of code. By dragging the yellow execution point, you can alter the execution path of your running application. This ability can help you narrow down when and where issues happen within fewer investigations.
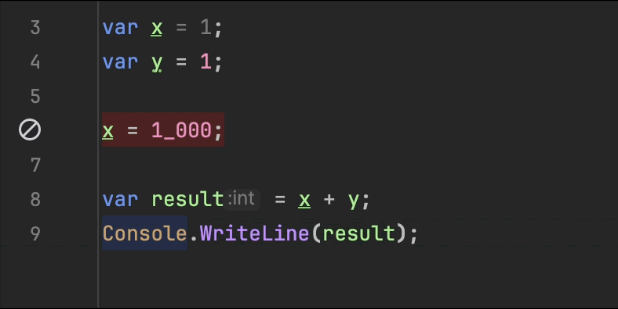
You can also use the two visible icons when hovering over the editor. The first yellow icon indicates the “Skip to Here” functionality, which does not execute any lines between the current execution line and the target line. The blue “Run to Here” icon will execute all lines to a target line. These can be more convenient than attempting to drag the cursor down.
6. Debugging External Decompiled Code
The .NET landscape is much more open these days, but for the unlucky few still dependent on close third-party libraries, it can be frustrating when exceptions happen within a black box. JetBrains tools allow you to decompile third-party libraries during debugging and step into methods you suspect of throwing exceptions. The “Ctrl+Click” shortcut will jump to any code containing that symbol, even if it needs the code needs decompiling. Once decompiled, you can also set breakpoints to quickly identify if it’s a “you” or “them” issue.
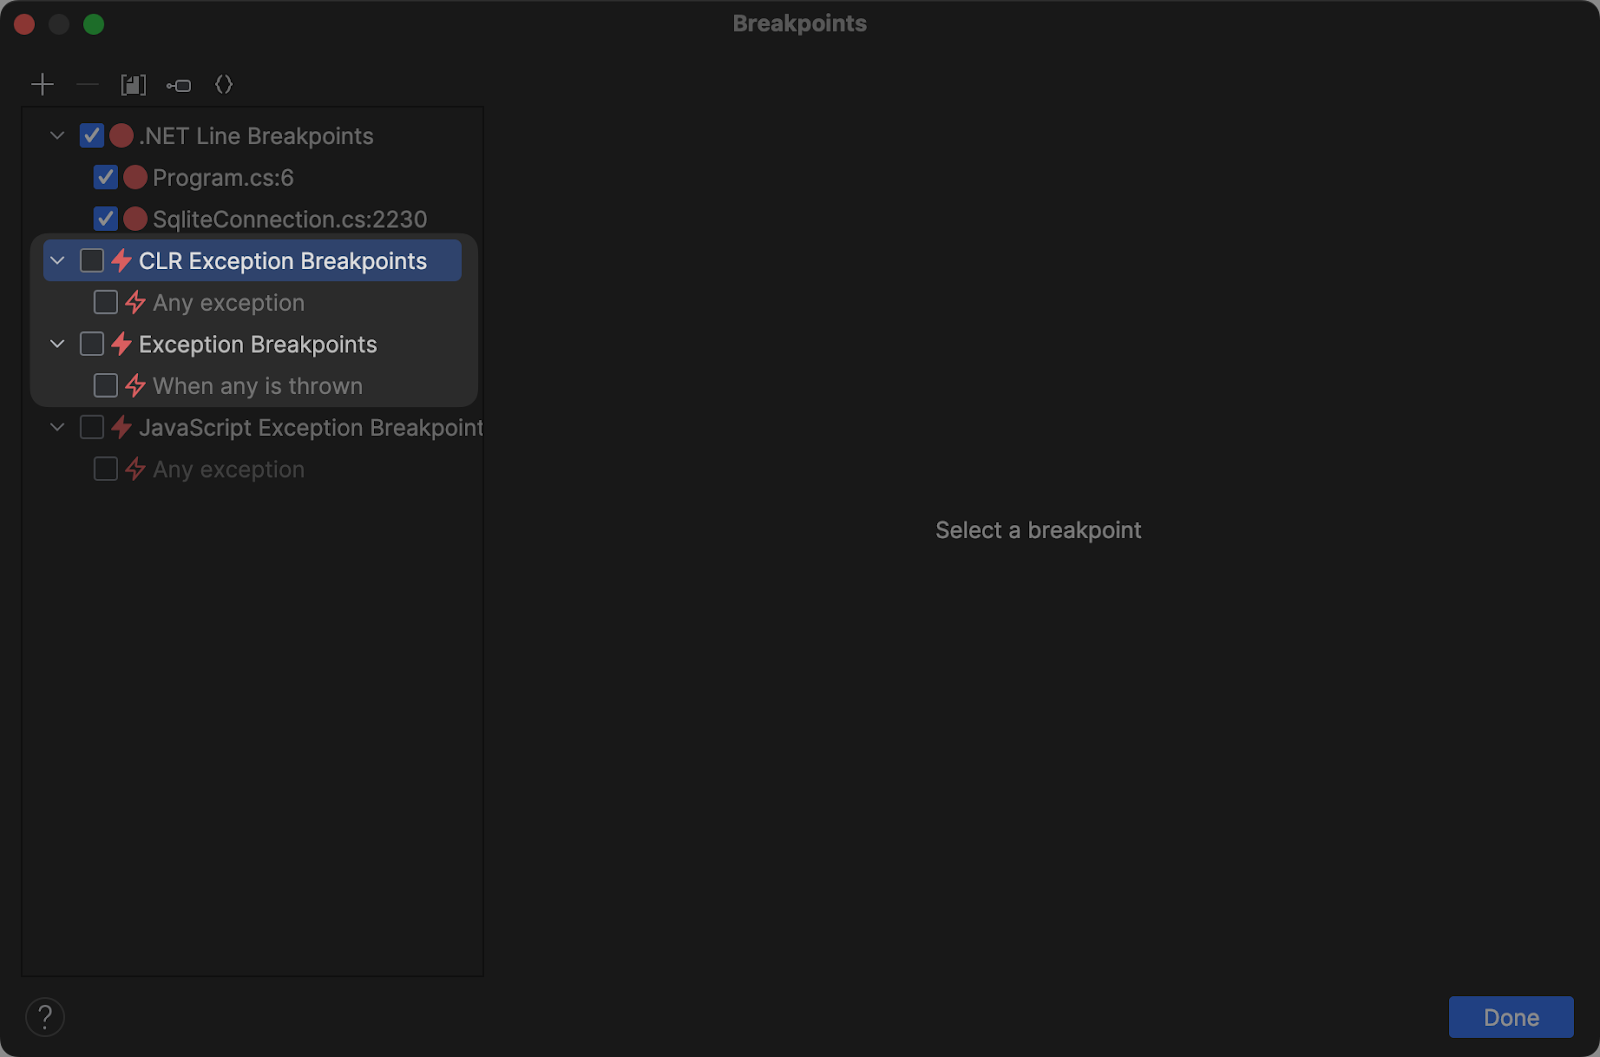
7. Exception Breakpoints
You’re not alone if you’ve ever been left scratching your head about why your application just quit. The culprit is typically a CLR or general exception. If your debugging sessions end abruptly, check the CLR Exception Breakpoints and Exception Breakpoints options in the Breakpoints options window. Applications can throw these exceptions when there are configuration issues, such as disk access or incorrect permissions. This feature can also help halt before a catch block handles the exception.
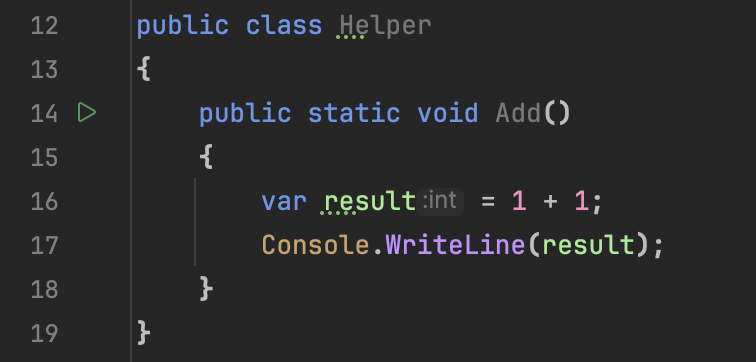
8. Run and Debug Static Methods
You can use JetBrains Rider to run any static method in isolation. Running static methods can help narrow issues during runtime by allowing you to create a self-contained and repeatable situation. Look for the “run” button in the gutter of any public static void method with no parameters. The static method run configuration is also an excellent tool for storing repeatable tasks within a codebase.
9. Edit and Continue
The feedback loop is at the heart of fast software development, and with Edit and Continue .NET, developers experience an iterative process unlike any other ecosystem. With Edit and Continue, you can make targeted code changes to a running application without recompiling or stopping your investigation. Learn more about Edit and Continue in Matthias’ blog post.
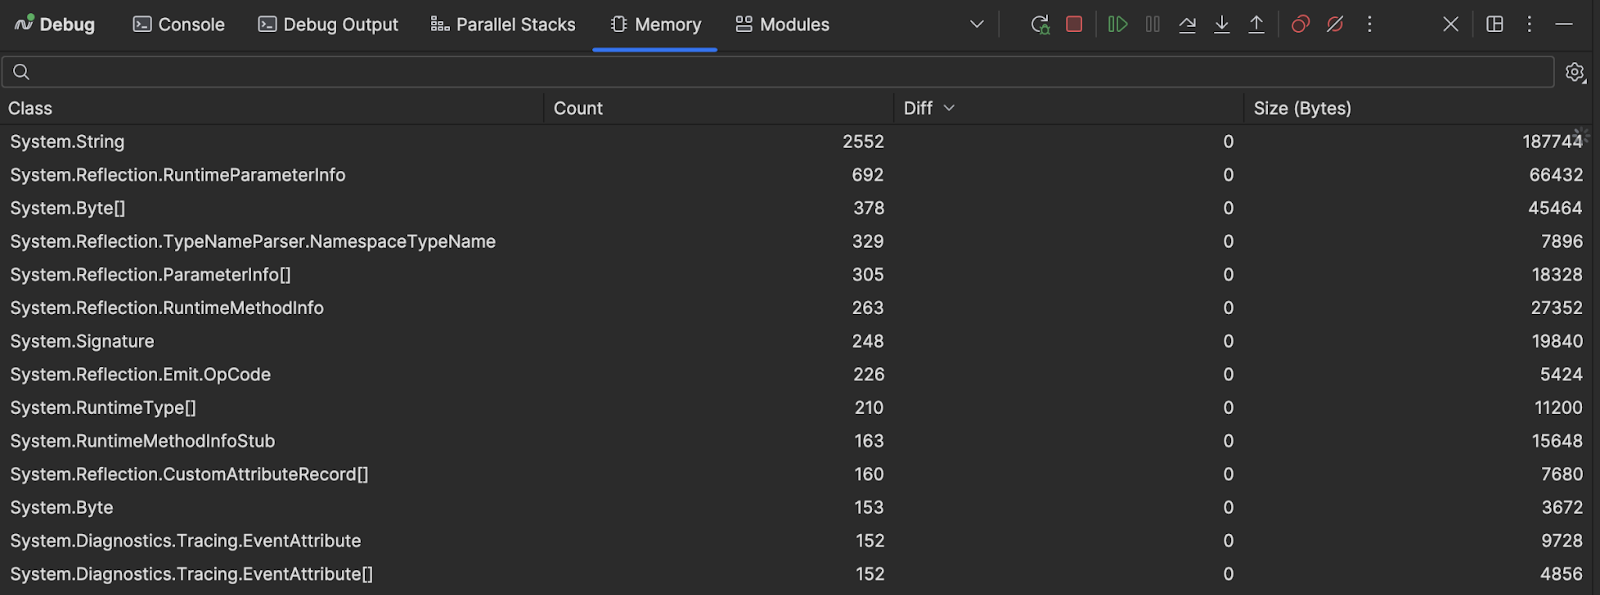
10. Memory View
Knowing what’s in your application’s memory space can be half the battle when tracking down pesky bugs. With JetBrains Rider’s Memory tab, you can see what classes are currently in memory, how many there are, and the size they occupy in memory. The view is an excellent summary and a supplement to using more detailed tools like Dynamic Program Analysis and dotMemory.
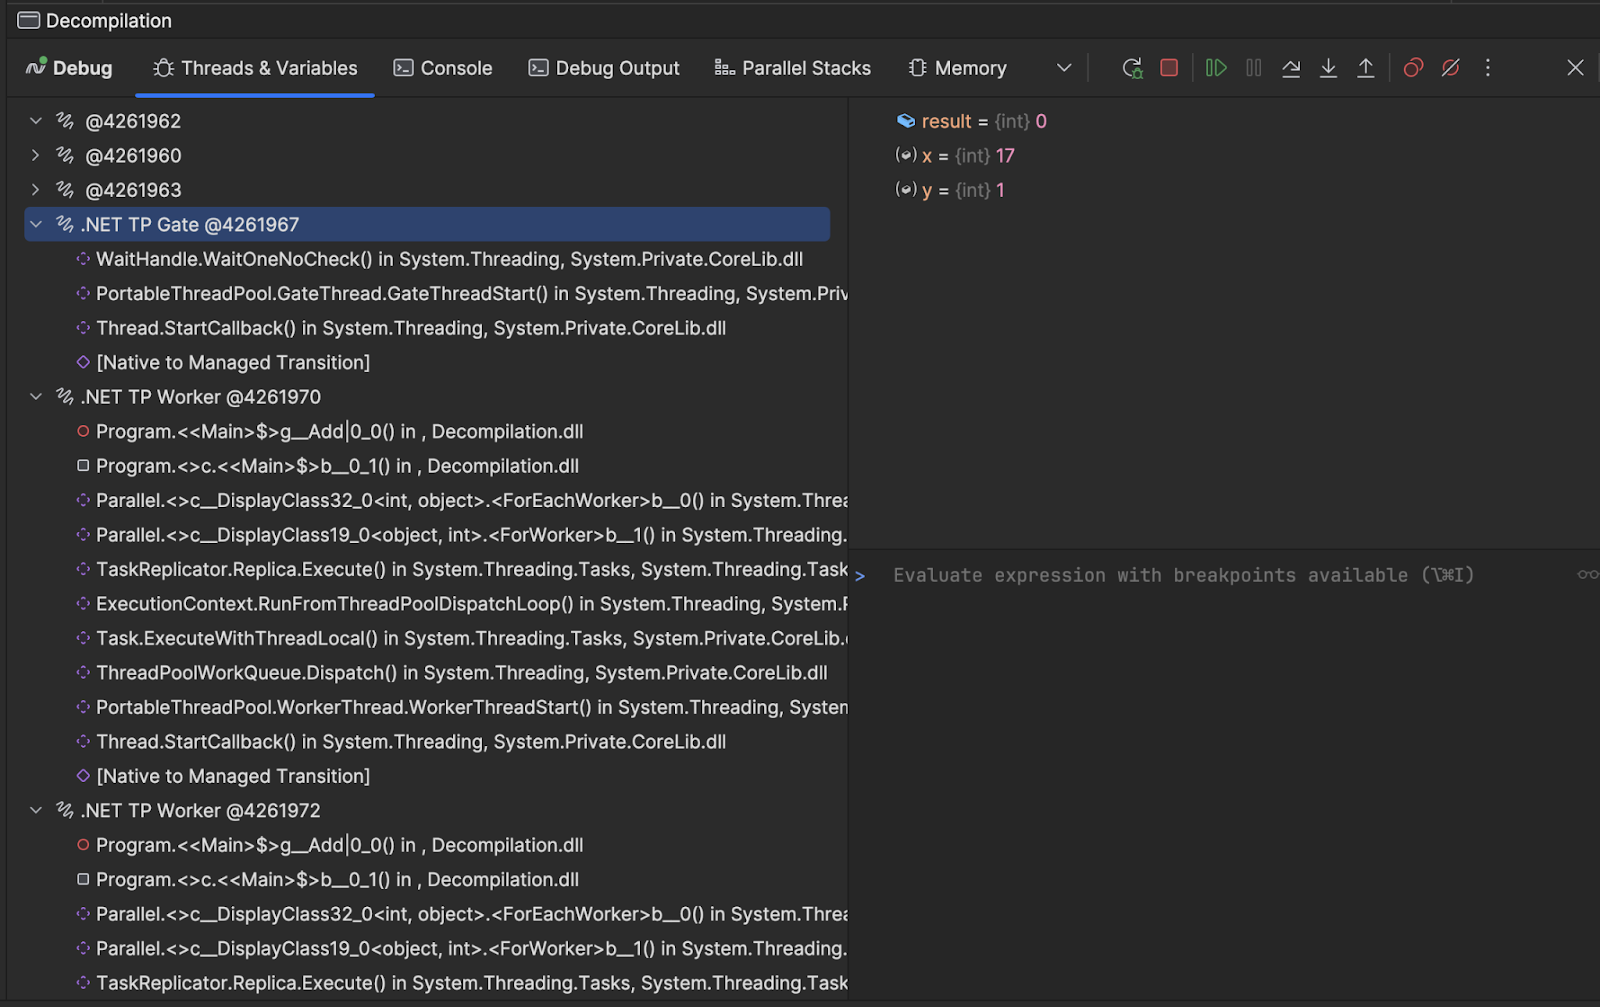
11. Thread Specific Breakpoints
Commonly, your application has multiple threads executing the same set of code during any given time. The threads view in the debugger tool window can show you what call stacks are executing within each thread, helping you narrow down when and where a breakpoint should halt execution.
Once you’ve determined the thread, you can use the Breakpoints option window to only break on the chosen context.
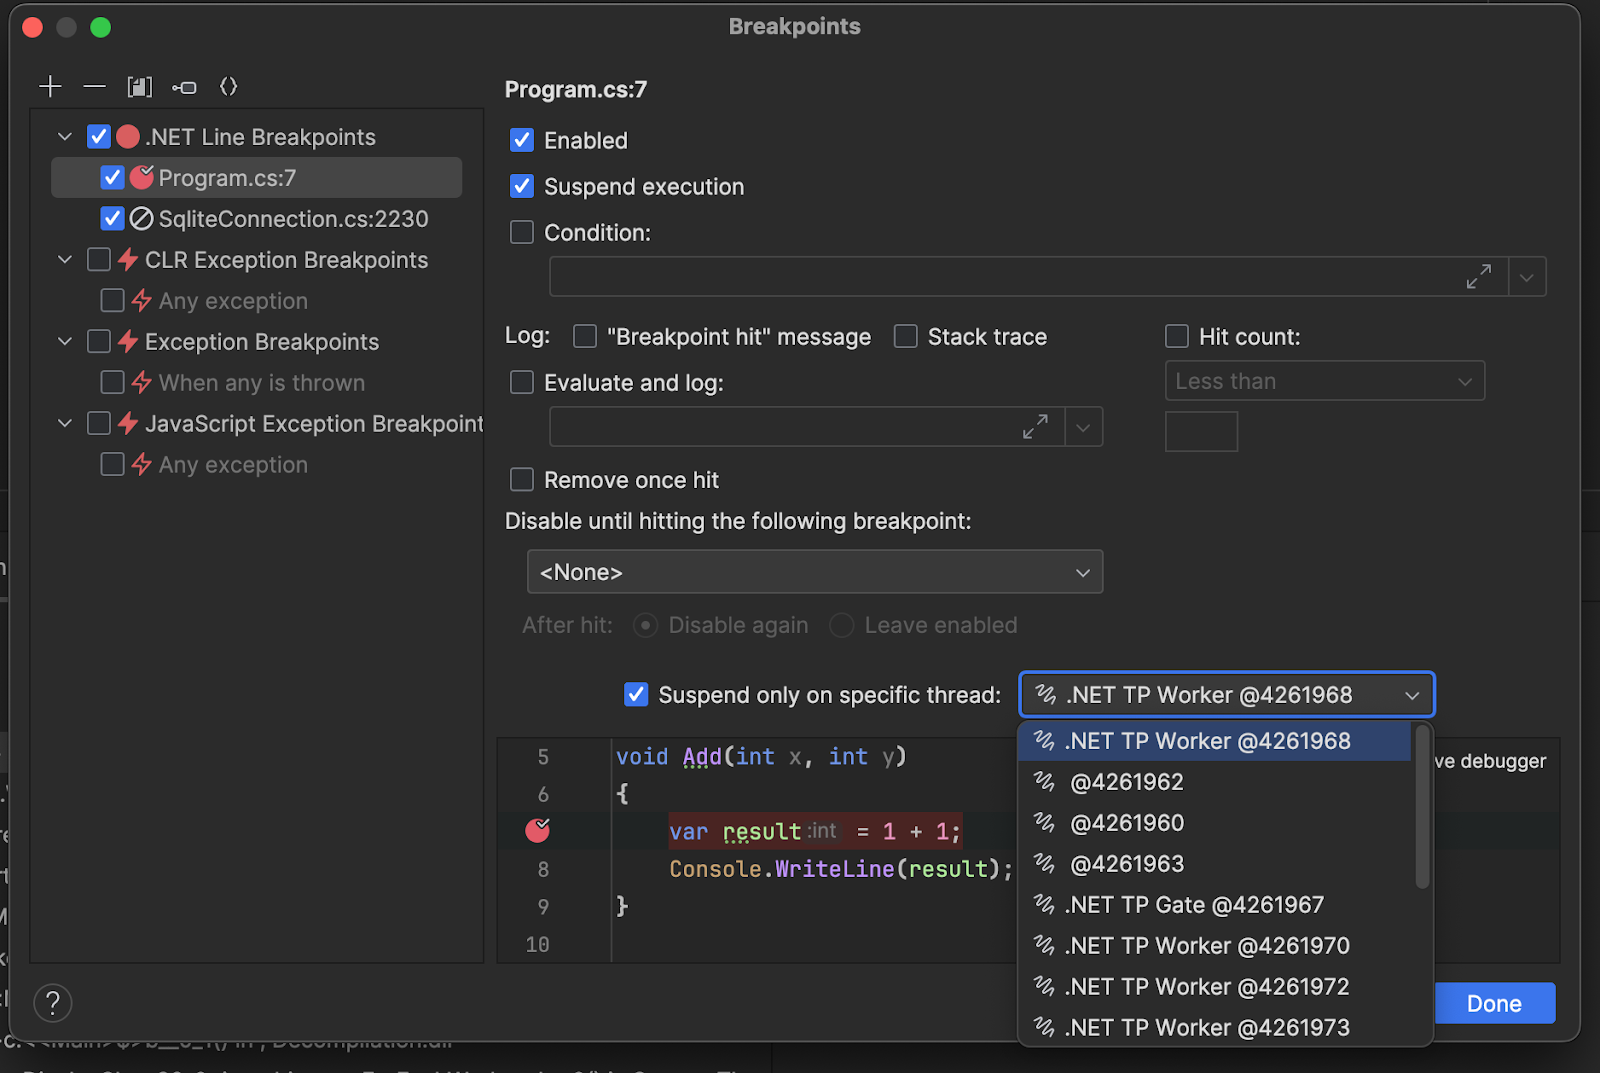
You can also right-click any breakpoint in the editor while debugging to set the thread quickly.
12. DebuggerDisplayAttribute Support
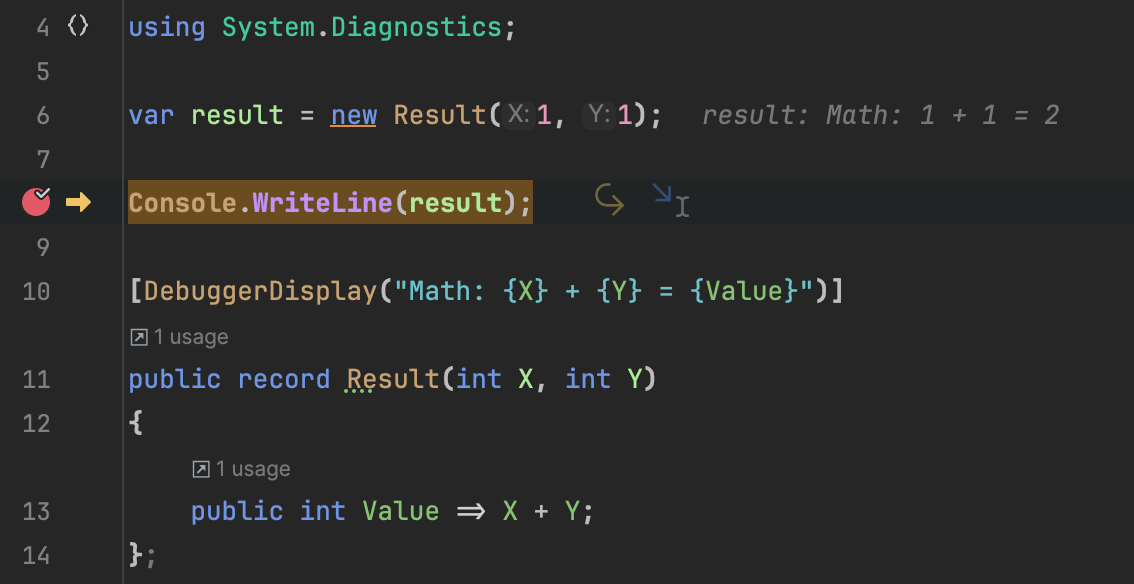
Complex class definitions can have a lot of data but only have a few user-friendly pieces of information. Using the DebuggerDisplayAttribute can help shape how you surface critical information in JetBrains Rider. Take the following code, for example:
using System.Diagnostics;

var result = new Result(1, 1);

Console.WriteLine(result);

[DebuggerDisplay("Math: {X} + {Y} = {Value}")]
public record Result(int X, int Y)
{
    public int Value => X + Y;
};
JetBrains Rider will use the DebuggerDisplayAttribute to render a display value in the editor and within the debug tool window.
Consider using this feature if you waste time toggling debugging values to find essential information.
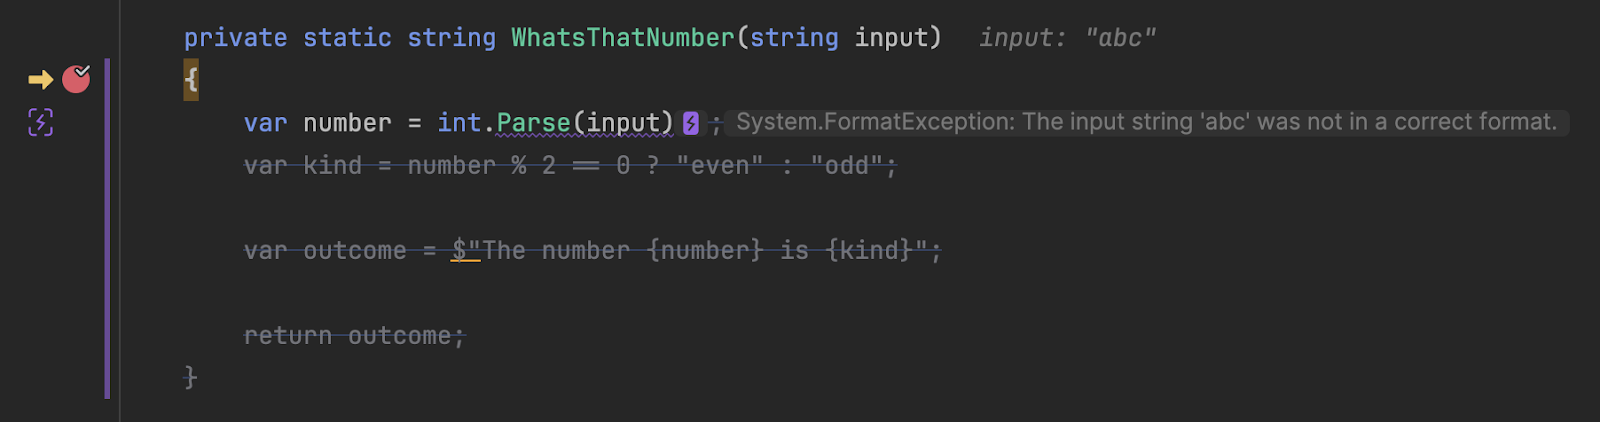
Bonus: Predictive Debugger
Any branching code is going to be a challenge to traverse mentally. JetBrains Rider 2023.3 brings with it the much-awaited Predictive Debugger feature. Given the current execution context, JetBrains Rider can predict where code execution will flow and what values you may get from any particular path. The feature can help predict variable values and potential exceptions before they happen.
Read more about the Predictive Debugger in a recently published post.
Conclusion
As you’ve noticed in this post, there’s an entire toolbox of approaches to help you improve your debugging workflows. Any of these features would be good on their own, but together, they’re great! Bugs are a pain, but debugging doesn’t have to be a drain on you. Let us know in the comments which ones are your favorite and which ones you hope to use more.
As always, thank you for reading and your interest in JetBrains IDEs.
image credit: AbsolutVision on Unsplash