Debugging Rust in JetBrains IDEs: state of affairs

Almost two years ago, we published a blog post on the essentials of debugging Rust in CLion. It’s still a great reference for the general debugging procedure. In this blog post, we would like to summarize what’s been improved and updated since then, and also discuss how you can debug with IntelliJ Rust not only in CLion but in other JetBrains IDEs as well.
Debugging for Rust is available in CLion, IntelliJ IDEA Ultimate, PyCharm Professional, and GoLand. The major differences between CLion and other IDEs are the following:
- In CLion, Rust debugging works out-of-the-box; in our other IDEs, IntelliJ Rust prompts you to install the Native Debugging plugin and downloads the debugger binary upon the first session.
- CLion supports two debugger backends, GDB and LLDB, which you can switch between. The other IDEs work with LLDB only.
- On Windows, you can develop any Rust project in CLion, while in the other IDEs only the projects targeting MSVC ABI are currently supported.
- On Windows, debugging for WSL works in CLion only.
- In terms of the debugger functionality, core dump debugging and attaching to local processes are only available in CLion.
Now that we’ve highlighted the differences, let’s dive into the debugger updates:
- Debugging Rust projects targeting MSVC ABI
- WSL debug (CLion)
- LLDB updates on Unix systems
- Rust-specific pretty-printers
- Stepping into the stdlib sources
- Inlay hints for variables in the editor
- Breakpoints in disassembly
- Break on panics
- Debug as root
- Attach to process (CLion)
- Core dumps debug (CLion)
Debugging Rust projects targeting MSVC ABI
If you are working on Windows with a Rust project targeting MSVC ABI (the i686-pc-windows-msvc or x86_64-pc-windows-msvc toolchain), debugging is available in any of the supported IDEs.
Note that you don’t necessarily need to install Microsoft Visual Studio or any other software in addition to what is required for compilation. See the rustup documentation for details on how to build with MSVC.
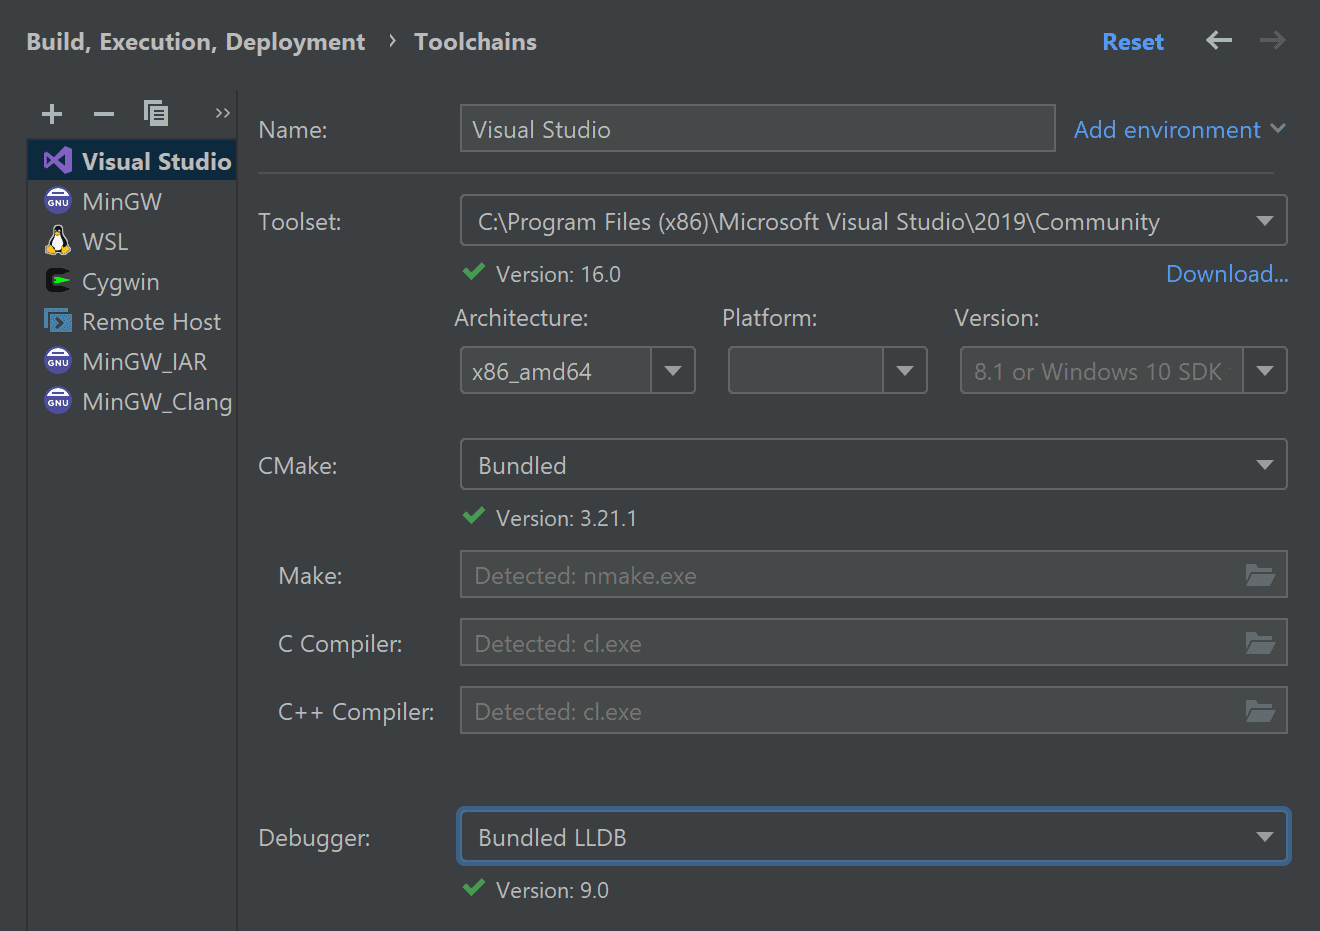
In CLion, the plugin will employ the bundled LLDB-based debugger, which is included in the C/C++ Visual Studio toolchain. Before starting a session, make sure to switch to a Visual Studio toolchain in Settings / Preferences | Build, Execution, Deployment | Toolchains and check that CLion has detected ‘Bundled LLDB’ as the toolchain’s debugger:
In other IDEs, no additional steps are required.
To track the progress of the MSVC debugging support, keep an eye on this meta issue.
WSL debug (CLion)
The plugin’s support for WSL is no longer an experimental feature and is enabled by default. Although WSL support is available in all IDEs, debugging only works in CLion.
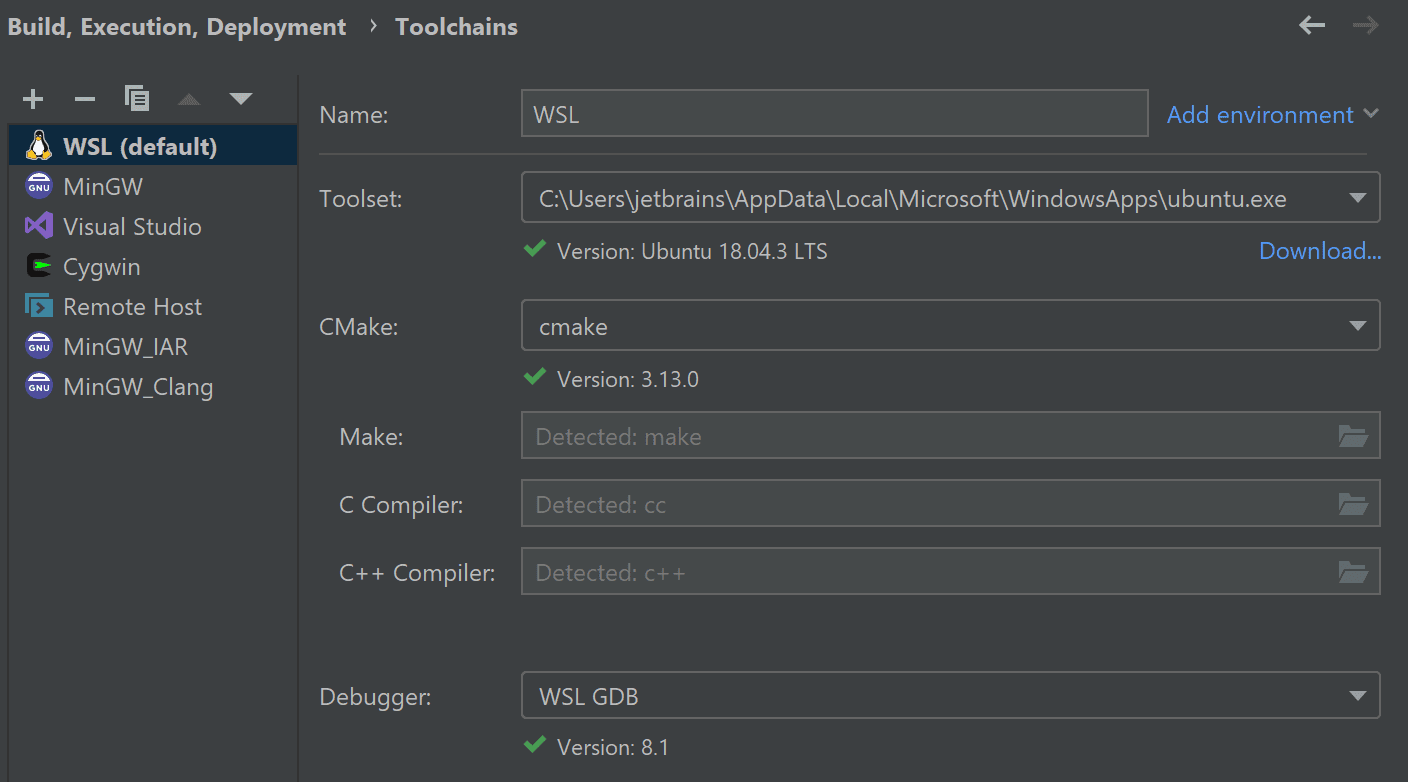
To debug on WLS, you need to switch to a WSL toolchain in the CLion settings:
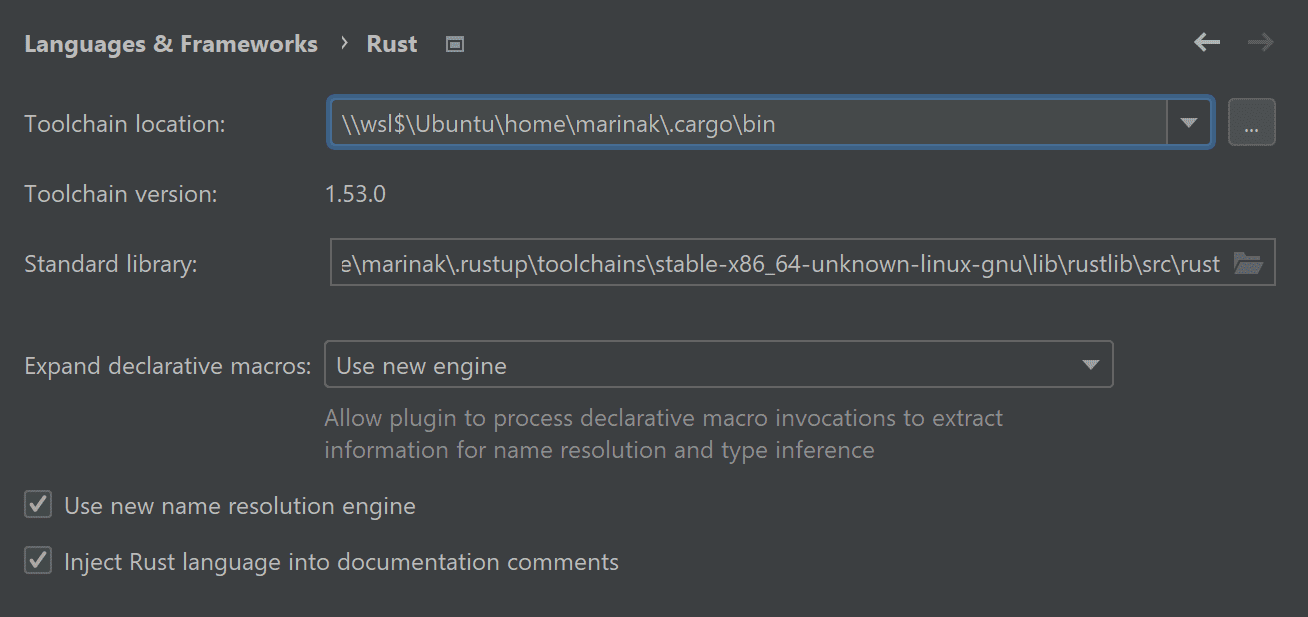
Also don’t forget to set the WSL toolchain location for Rust:
LLDB updates on Unix systems
A while ago, we announced significant improvements in the LLDB debugger backend on macOS and Linux.
In short, rendering for enums and primitive types like i32 in the bundled LLDB work much better starting from version 2020.1 of the IDEs.
Rust-specific pretty-printers
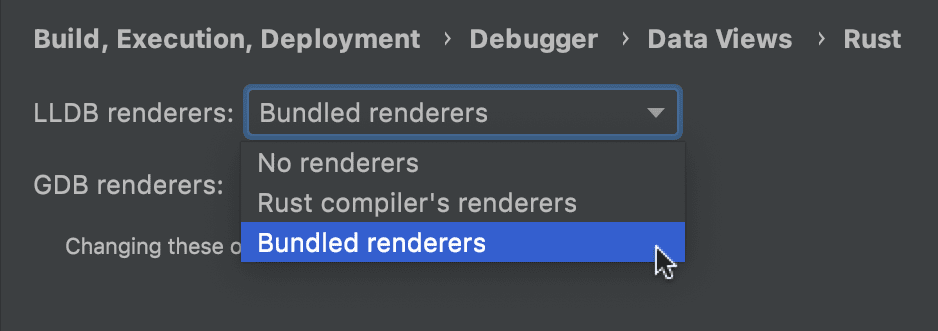
You can switch the renderers the plugin uses when showing Rust types in the Variables pane. The switcher is available in Settings / Preferences | Build, Execution, Deployment | Debugger | Data Views | Rust. In CLion, you will see two switchers, for LLDB and GDB, respectively:
The renderers developed and maintained by the plugin’s team have recently been merged into the Rust compiler. So what is the difference now and why do we still provide two separate options for the bundled and compiler’s renderers?
After the initial merge (see this pull request), the plugin’s renderers are no longer being developed intensively, and are mostly adopting the changes from the compiler. However, we recommend that you use the bundled renderers and keep the compiler ones as a backup option for some rare situations. For example, you may want to switch to compiler renders if you are using nightly rustc, and it appears that the most recent changes are not yet pulled into the plugin.
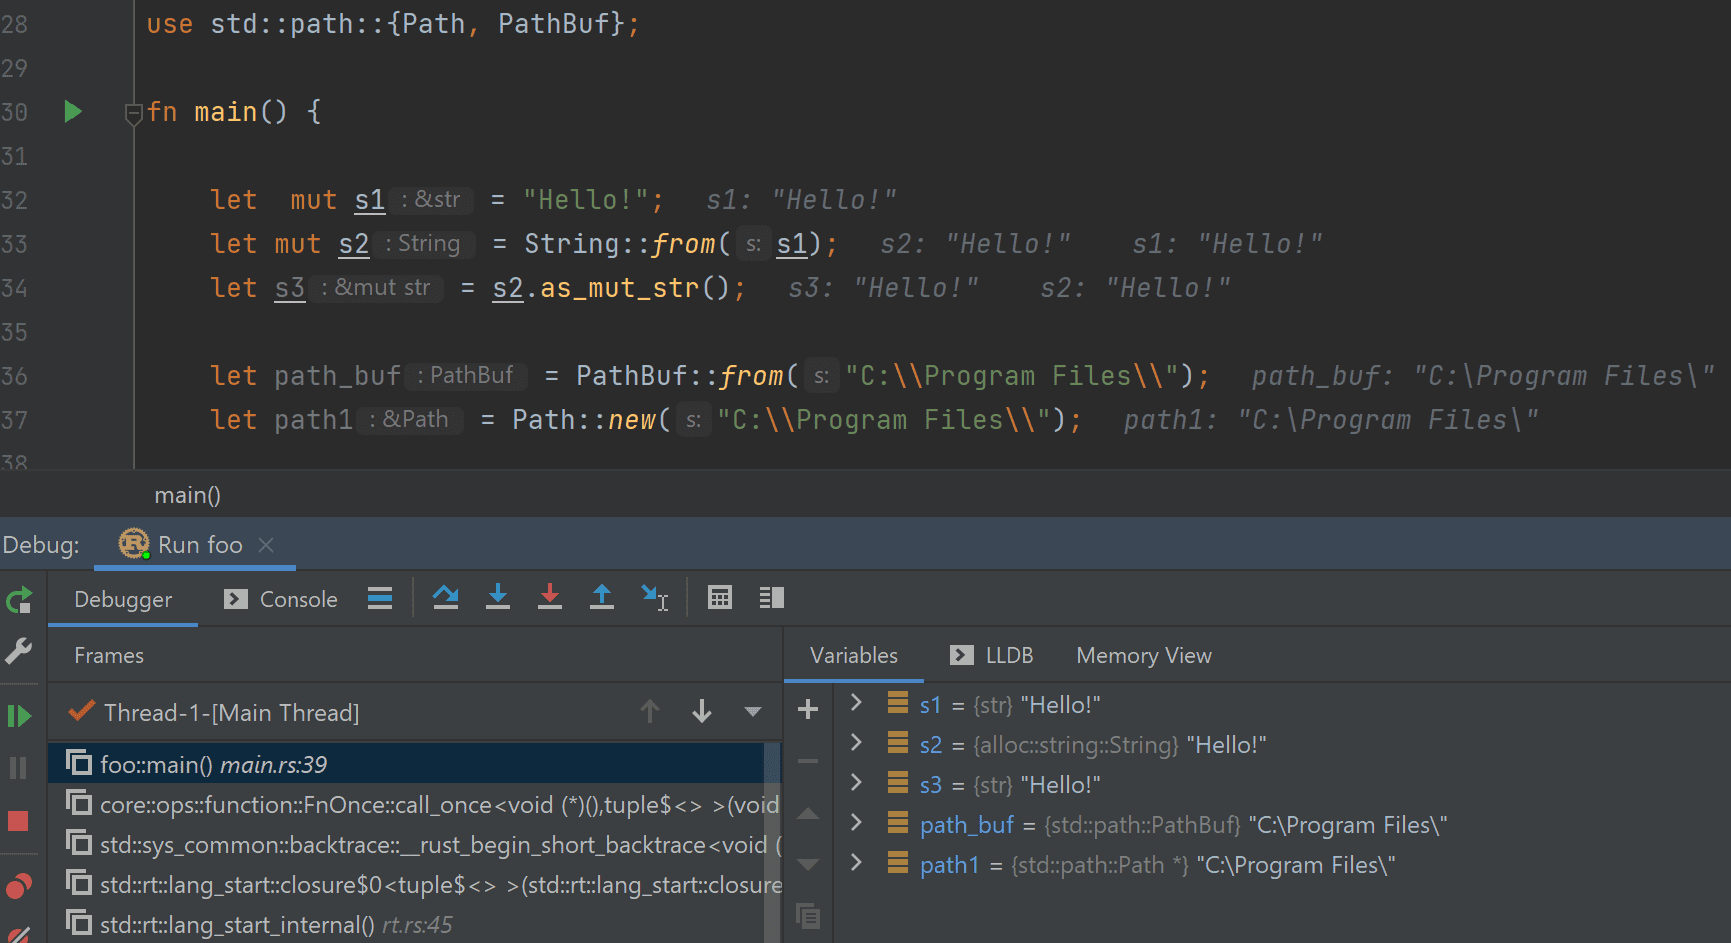
For bundled LLDB formatters, we recently added proper rendering for Path/PathBuf, and also &str slices for MSVC LLDB:
Stepping into the stdlib sources
This particular feature is not new, but we mention it as an important debugging feature that you may not know about. When you step into the code of the Rust standard library, the plugin finds the sources automatically and allows debugging inside them as usual:
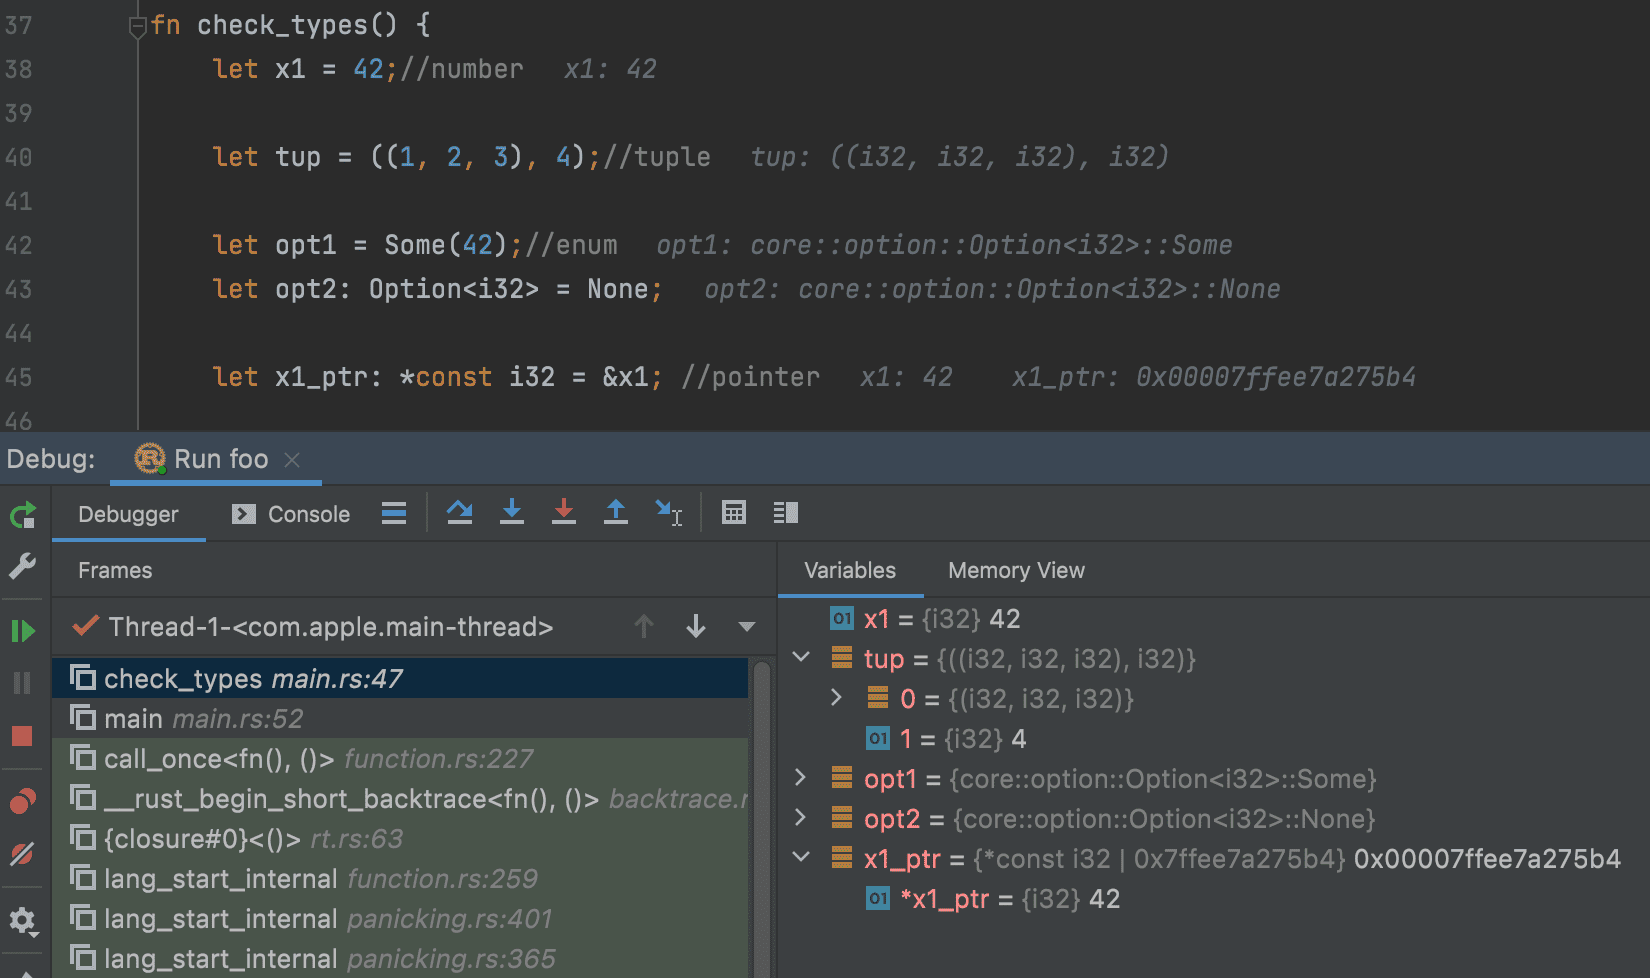
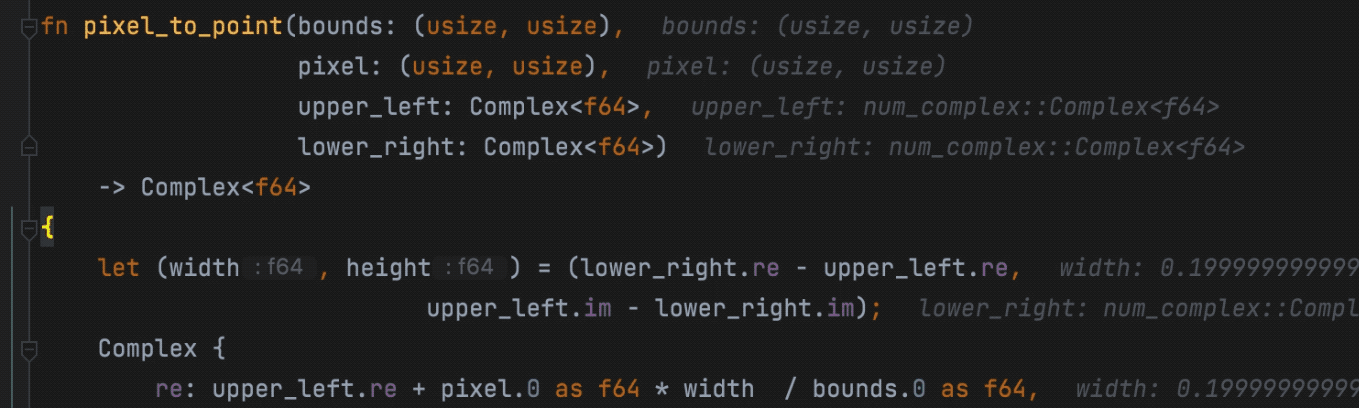
Inlay hints for variables in the editor
When you debug, you can track how the variables are changing not only using the Debug tool window but also right in the editor. The current values are shown next to the variables and updated on the go.
Now editor hints allow expanding the contents of complicated variables and even adding inline watches for child items:
Breakpoints in disassembly
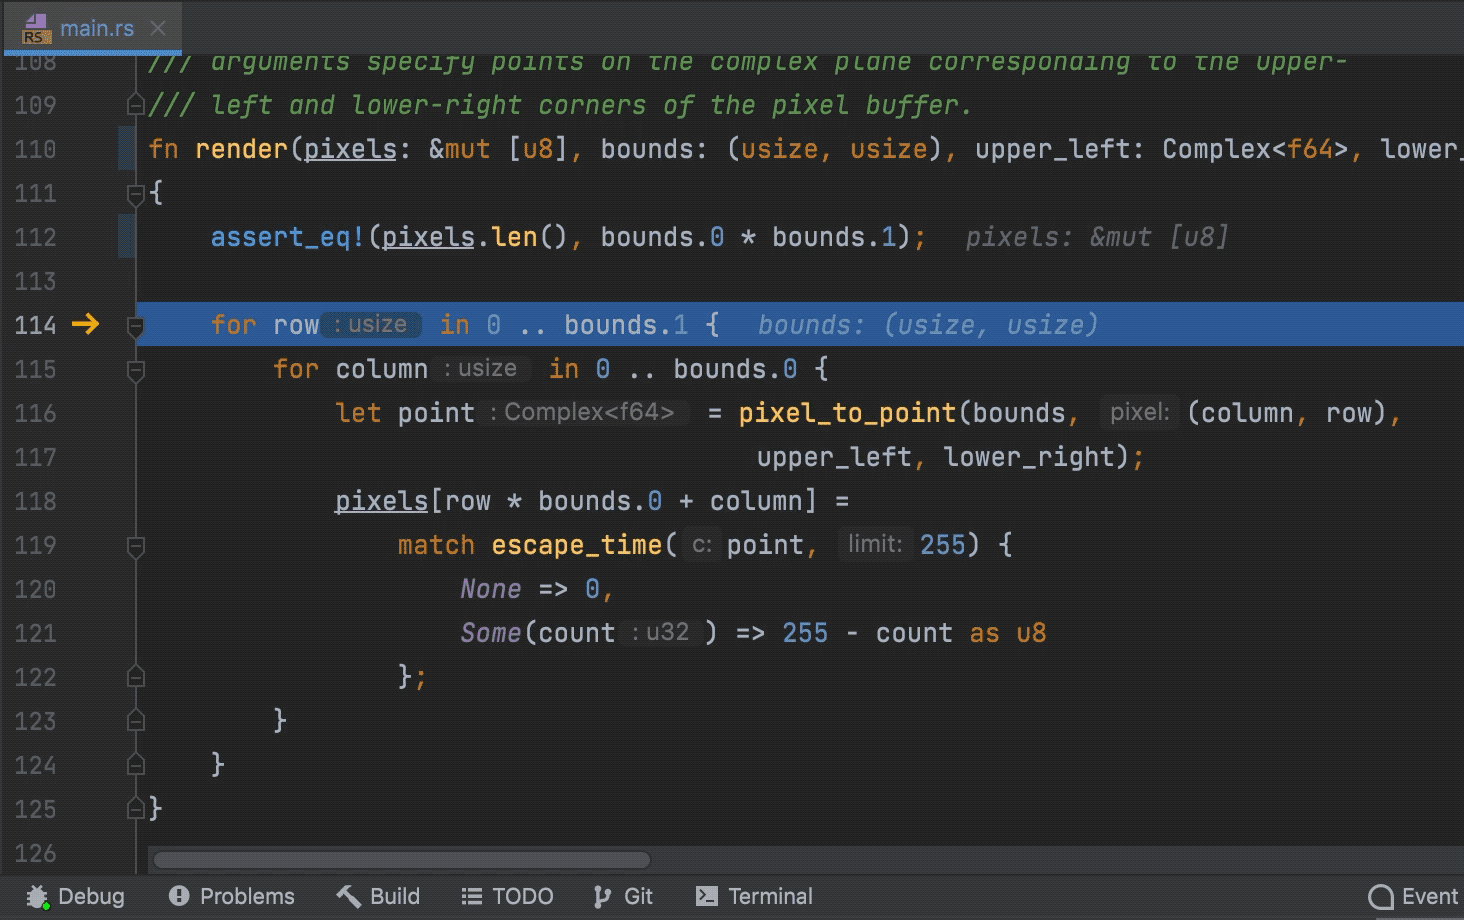
During stepping, the IDE automatically switches to disassembly when sources are not available, and you can proceed with debugging the disassembled code.
Previously, breakpoints were not supported in disassembly, but now you can set them the same way you do in Rust source files:
These address breakpoints are removed automatically when you stop a debug session.
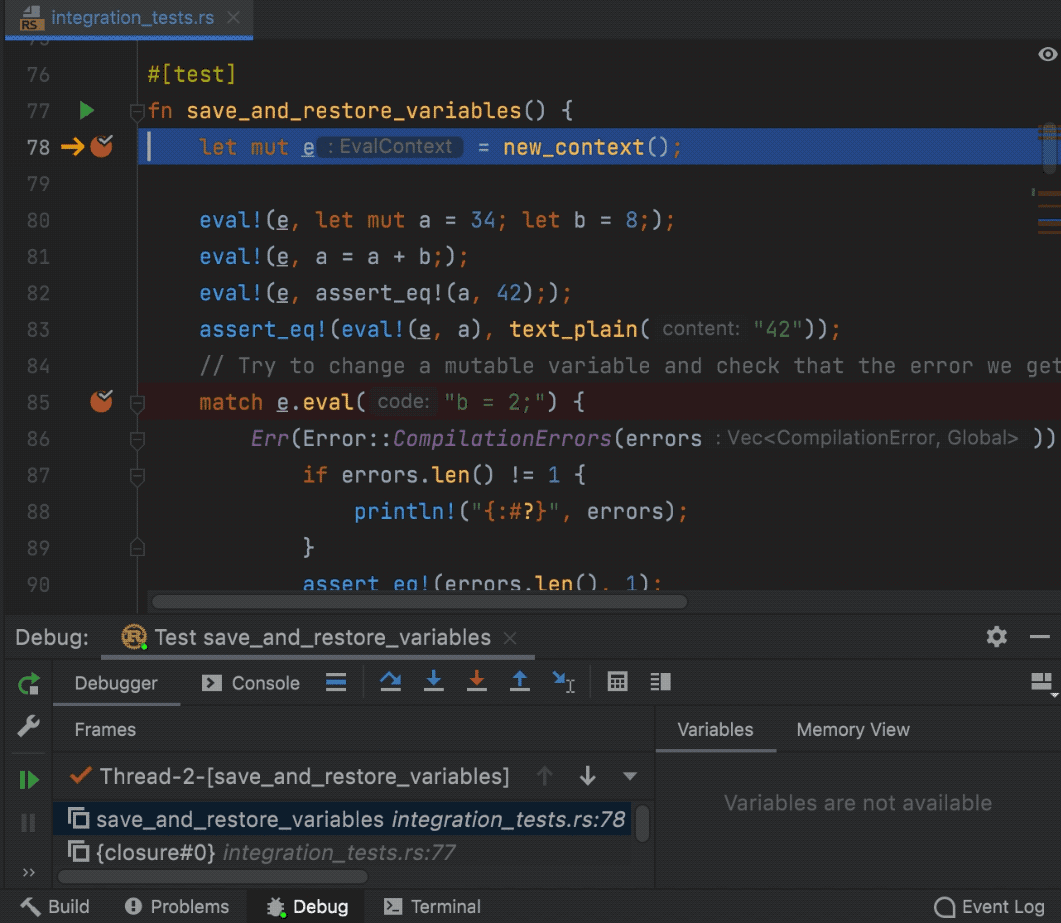
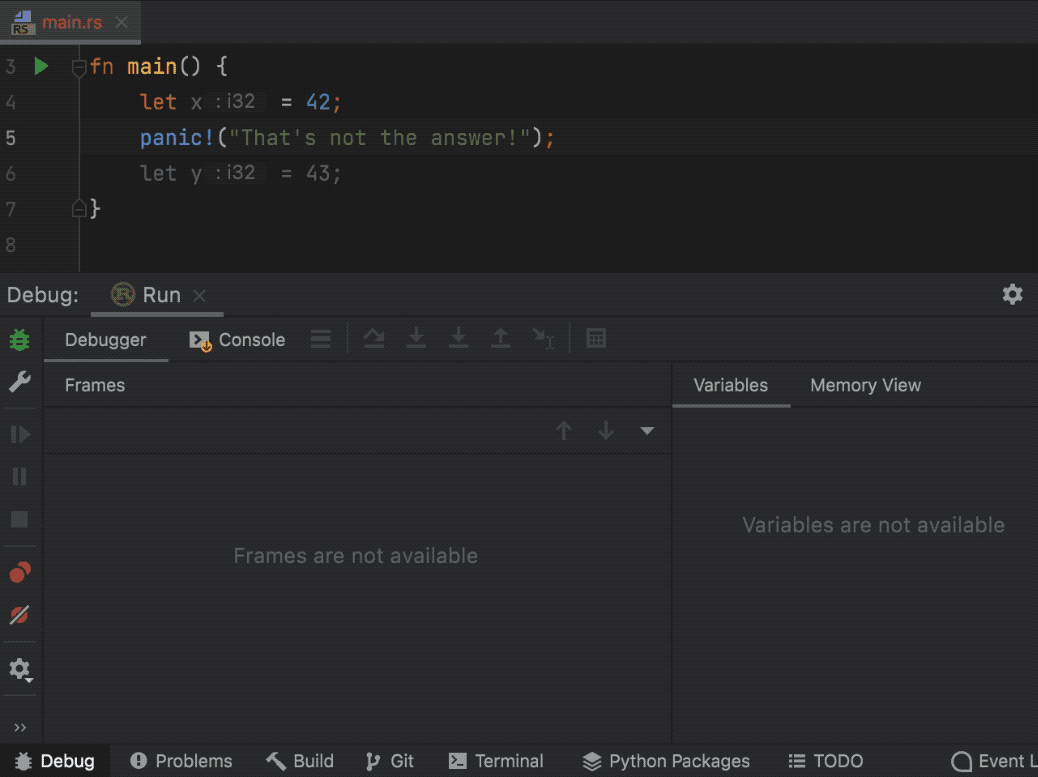
Break on panics
Now when a panic occurs in your application, the debugger will stop inside the panic! call automatically. This helps to investigate the stack trace and variable context around the point of panic.
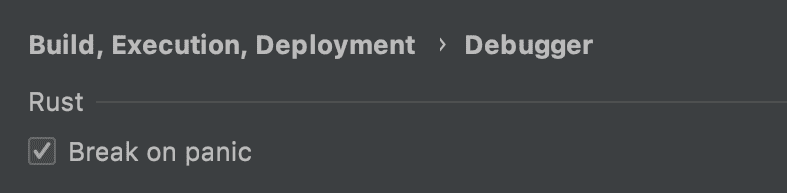
Breaking on panics is enabled by default. If you prefer to disable it, go to Preferences | Build, Execution, Deployment | Debugger and clear the Break on panic checkbox:
Debug as root
Whichever IDE or platform you work on, you can now debug Rust applications with root privileges. Find the option in your Cargo configuration settings:
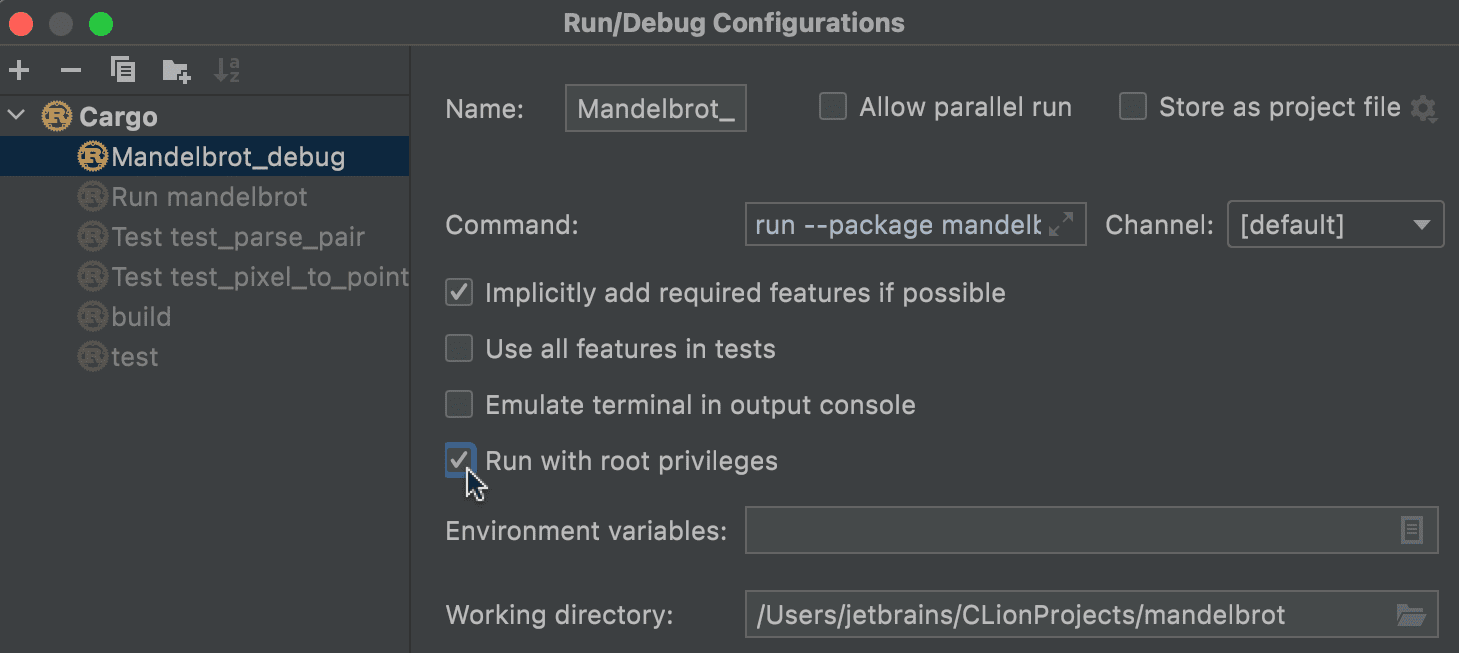
When launching a debug session with elevated privileges for the first time, you will be prompted to choose whether to authorize each time or grant authorization for a configured period. See the IDE webhelp for details.
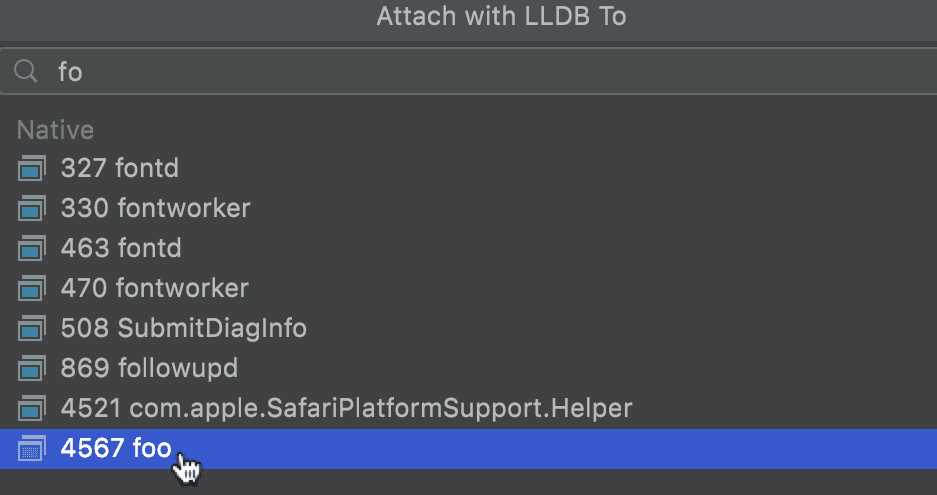
Attach to process (CLion)
Another option is to attach the CLion debugger to an already running Rust application. If the process you attach to provides debug information, you will be able to debug the source code as usual. Note that otherwise, breakpoints will be unavailable and stepping will be performed in disassembly.
Launch the program you want to debug, call Run | Attach to Process, and search for the process in the list:
See this section in CLion webhelp for more information.
Core dumps debug (CLion)
Debugging core dump files is a way of investigating a program crash or any other situation when it terminates abnormally.
After collecting system dumps, you can open them using a specific configuration in CLion and debug the corresponding source code. Since the only available data is a memory snapshot for the time of a crash, stepping through will not be possible, but you will be able to explore the code with all other debug features at hand.
For instructions on how to set up a core dump debug process, refer to CLion webhelp.
________________________
That’s it for the IntelliJ Rust debugger news. If you have any questions, feel free to ask them here in the comments or reach out to us on Twitter. You can always use the plugin’s issue tracker to submit an issue or start a discussion.
Thank you for reading and stay tuned!
Your Rust team
JetBrains
The Drive to Develop