

TeamCity
Powerful CI/CD for DevOps-centric teams
Stop Bad Code from Being Promoted in TeamCity Build Chains, with OverOps

This guest blog post is brought to you by Alex Zhitnitsky, Director of Product Marketing at OverOps.
It’s no secret that 100% test code coverage ≠ 100% of critical issues identified. Developers, build engineers, and managers are throwing everything they have at this problem – rigorous code reviews, static analysis, and every possible type of automated test they can think of, but the facts of the matter stay the same – code still breaks.
The reason for this is that testing requires foresight. You can’t predict the future with absolute certainty, and the level of foresight that’s required to prevent code from breaking in production is close to impossible. It’s a fact of life that we’ve grown to accept, and even the best engineering teams out there can’t avoid it.
Every engineer worries that the new code they deployed is going to cause issues in production, but there’s only so much they can test.
So what can be done to address this gap?
Today, most teams approach code quality only through the lens of pass/fail test results and static analysis. The complexity of what’s happening underneath the surface – the exceptions, HTTP errors, logged errors, and warnings – is not addressed, letting preventable issues slip into production.
The ability to optimize all of this operational data and serve it to developers in a form they can easily consume is what sets OverOps apart and exactly where our integration with TeamCity fits in.
Introducing runtime code quality gates for TeamCity
At OverOps, we’ve created a new way to ensure code changes don’t impact customer experience in Java and .NET based applications. By learning and mapping code at runtime, we optimize live application data and make it accessible to the entire team. This enables our users to identify code-level anomalies, prevent them from being promoted, and resolve them with the required context. Fully automated, and with no reliance on logs.
Using OverOps with TeamCity Build Chains introduces a brand new way to avoid deploying bad code to production, which takes into account caught and uncaught exceptions (including those not logged), and events like logged errors, warnings, and HTTP errors.
Normally, analyzing all these events would be extremely difficult. There’s just so much noise out there that it’s close to impossible to find the issues that matter.
This is where our machine learning algorithms kick in.
OverOps is not only aware of these events, but also deduplicates them and classifies anomalies in real-time, selectively capturing the required context to understand what happened.
The way this data meets you is through 6 new levels of runtime code quality gates:
- New Errors – did the release introduce any errors that hadn’t happened before?
- Critical Exceptions – did the release introduce any severe/showstopping errors?
- Increasing Error Rates – did the rate of a known error increase dramatically in this release?
- Resurfaced Issues – did an error that was previously resolved appear again in the current release?
- Total Errors Volume – did this release introduce a dangerous spike in the total volume of errors?
- Unique Errors Volume – did the release introduce an unusually high number of many unique (i.e. discrete) errors?
How to integrate OverOps with TeamCity
To get started with our first runtime code quality analysis, follow these 3 steps:
- First, let’s install the plugin. If you’re new to OverOps, check us out on overops.com by signing up and connecting your application. Once your environment is set up, you’ll be ready to get started by installing the Runtime Quality Report plugin with one click from the TeamCity UI.
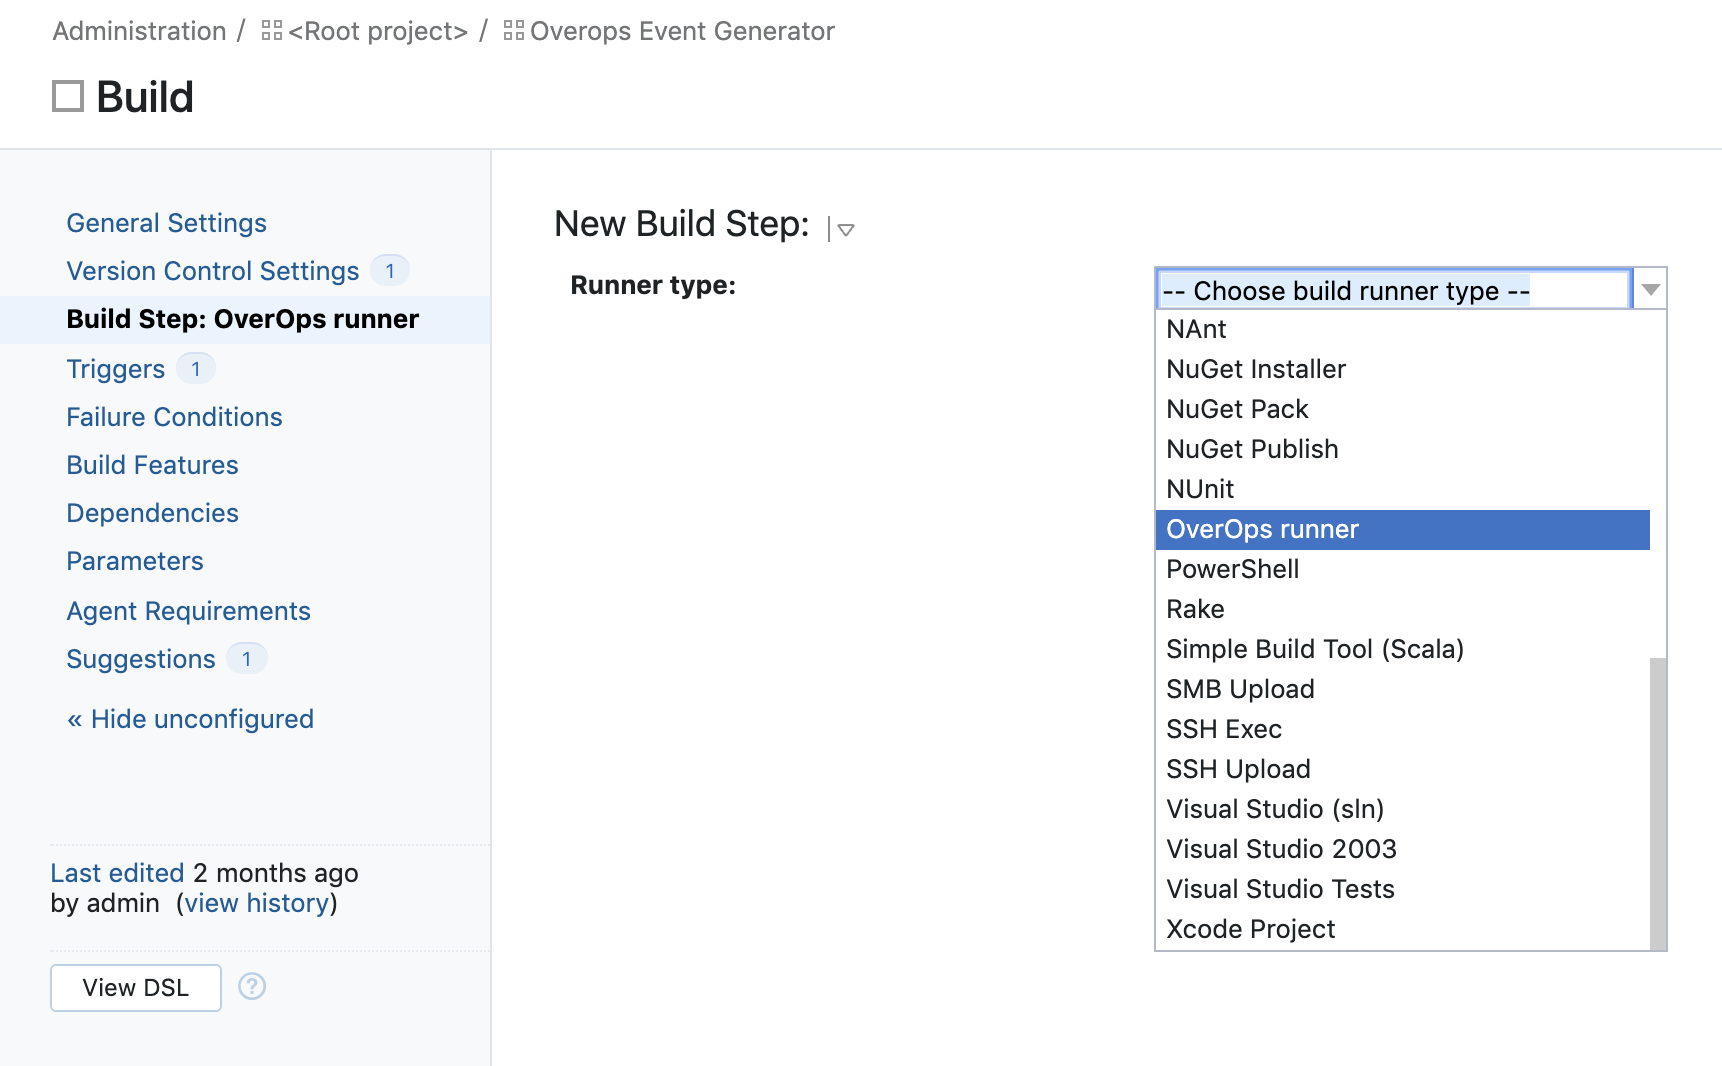
- Now that your plugin is installed, it’s time to connect it with OverOps. Add the OverOps Runner build step from the Runner type drop down in your build configurations:
- Fill in your OverOps environment ID and API token (accessible via OverOps), and test the connection:
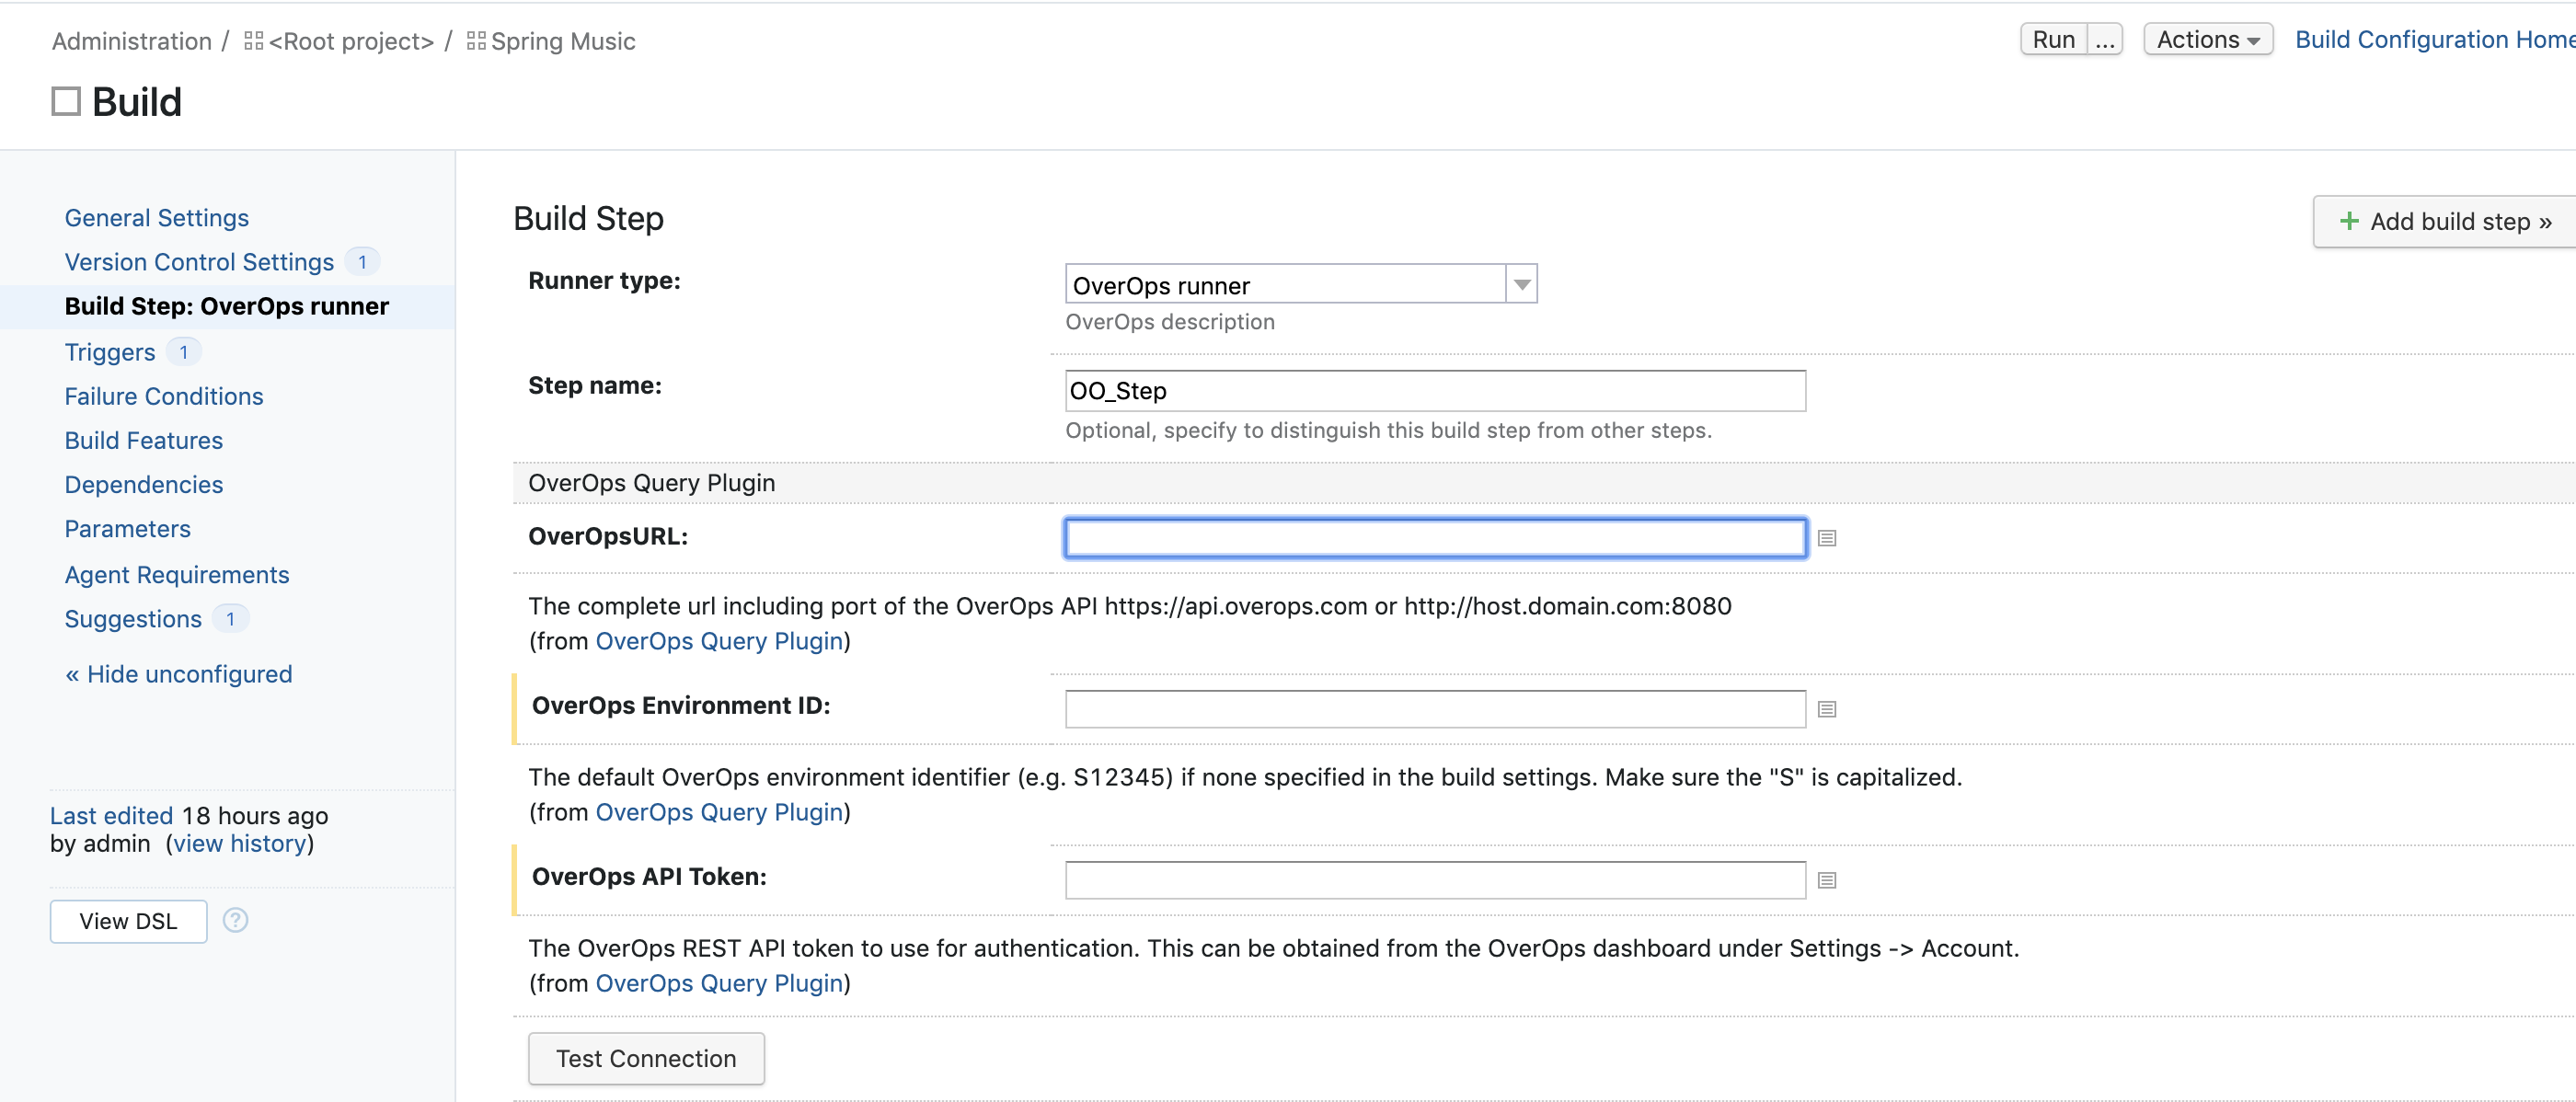
All right! Now we’re ready to get started. You can now also name your application and deployment in the same configuration screen, and review some of the more fine-grained options. These will come in handy when you’ll want to customize how each runtime quality gate is defined and what conditions will make it block your build.
The complete documentation is available on our GitHub page.
Now that we’re set up, let’s walk through an example
Your team just ran its automated test suite on a new build, and looks like everything passed. Normally, the build would be considered stable and moved to the next step in your pipeline. However, OverOps will mark a build as unstable if it identifies code-level issues that triggered the runtime code quality gates you’ve set up:
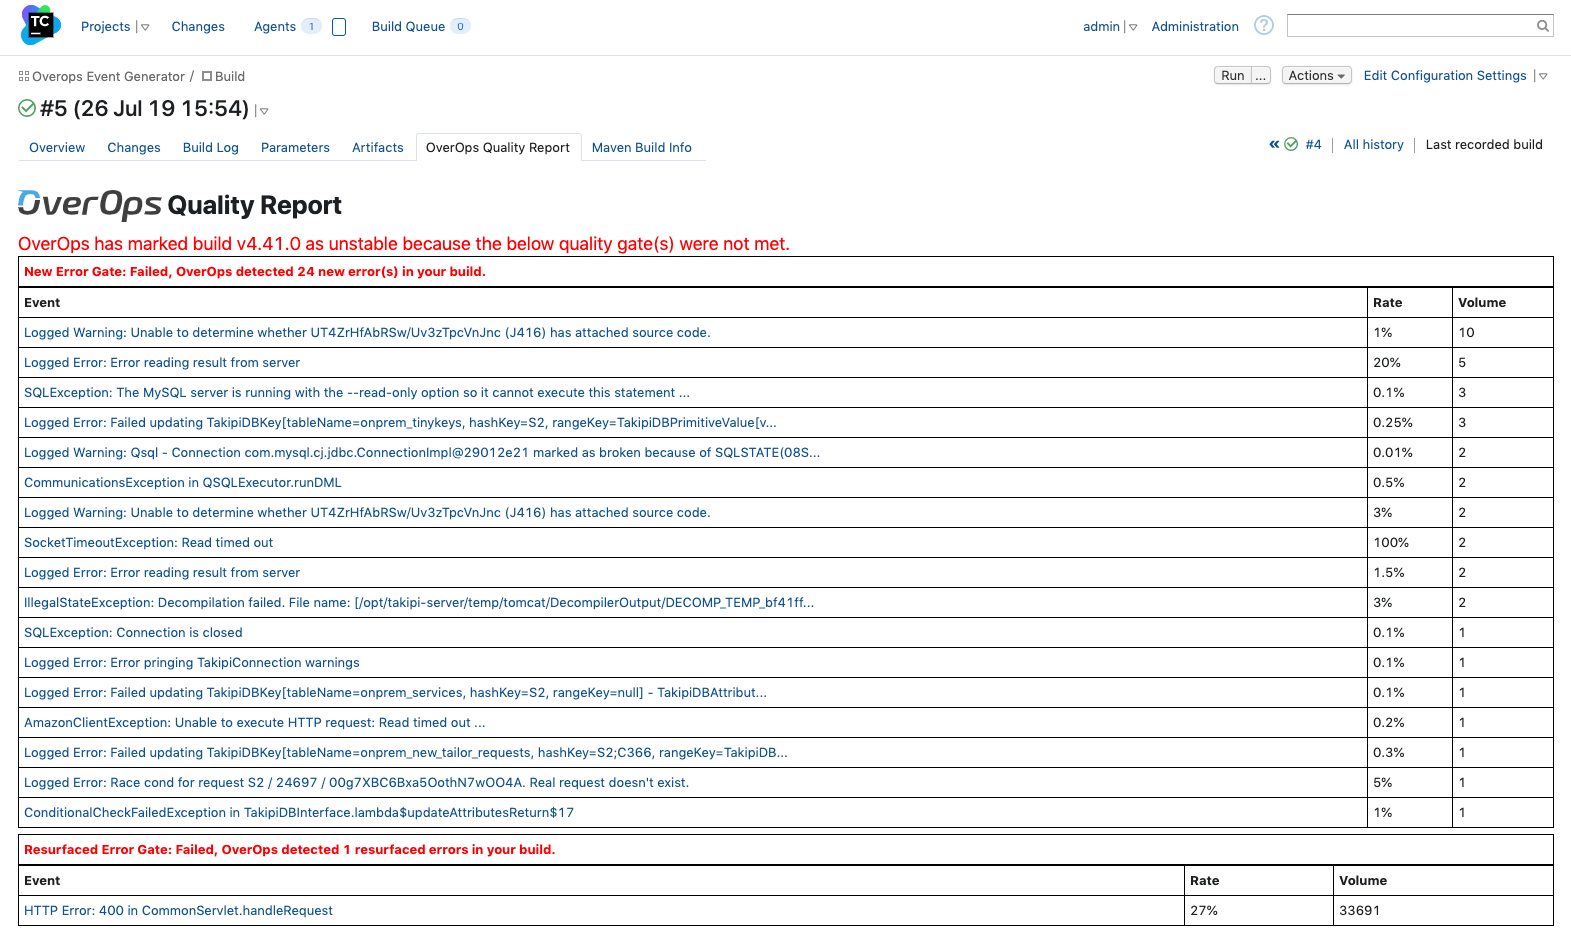
We can see that in this case, build v4.41.0 was marked as unstable because OverOps identified 24 new errors that didn’t exist in the previous version, and 1 resurfaced error that was previously resolved. Now, the team will be alerted to review the new errors that were identified.
We can see each error’s rate, which represents the number of times it happened out of the overall number of times the method it’s in has been called. This is a great way to have an even more fine-grained ability to focus on the most critical issues.
But that’s not all.
To quickly triage what’s going on, clicking into each error leads you to the data you need to resolve it. This includes the complete source code and variable state for the issue at hand, the state of the environment, and more, taking into account the 7 key components of true root cause analysis.
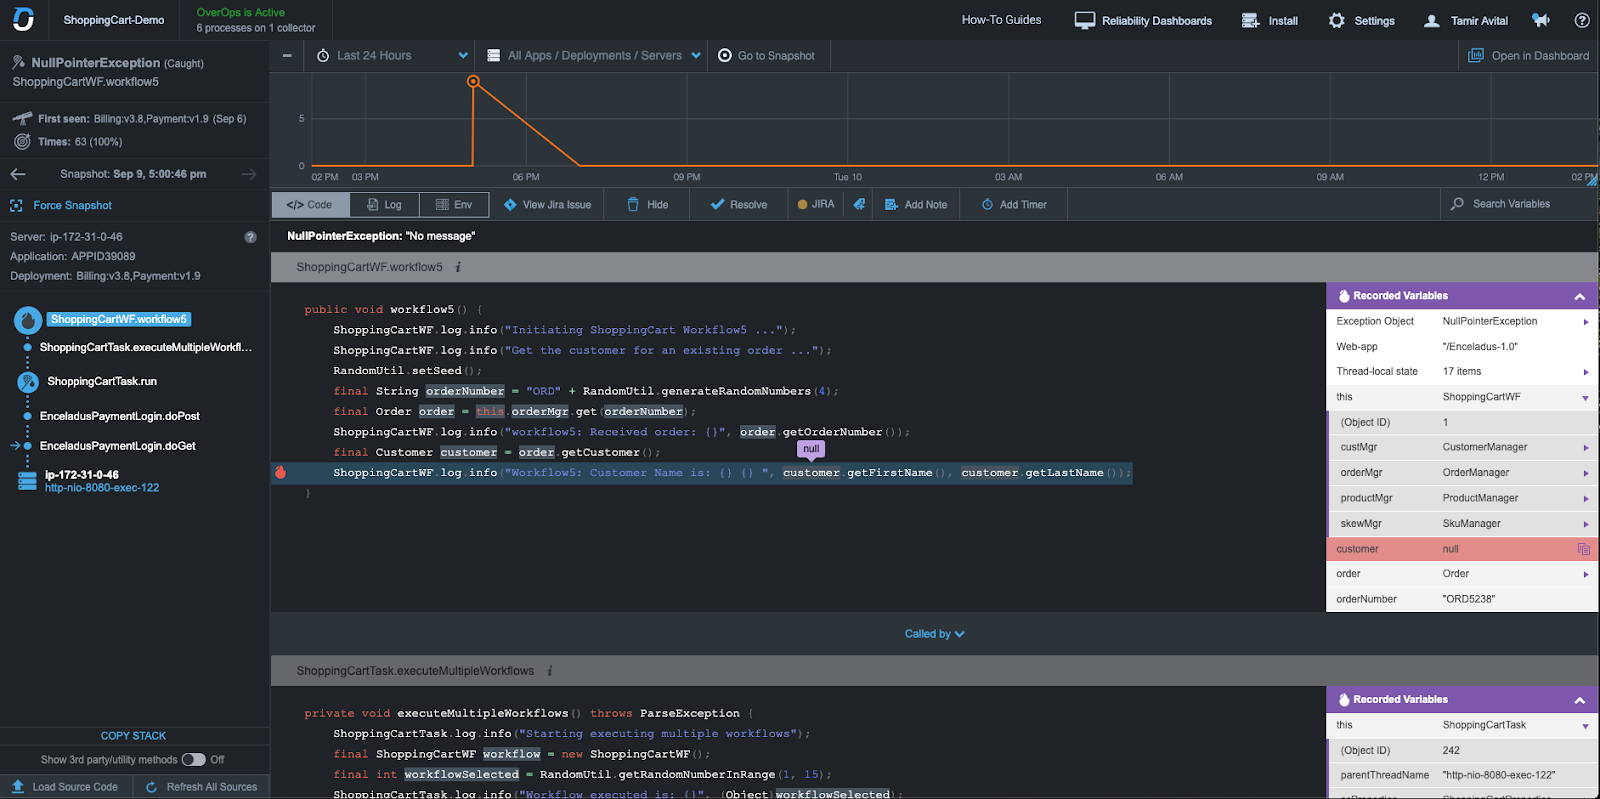
For each error, you get the following types of data in this error analysis screen:
- Type and location in the code, server, application, and deployment.
- Times and error rate, including a time-series chart of occurrences since it was first seen.
- Full stack trace and source code with complete variable state.
- The last 250 logging statements, including DEBUG and INFO, regardless of logging verbosity.
- The state of the environment, including threads, memory, and CPU stats.
In this case, we can see that a NullPointerException occurred because customer is null. Using this analysis, we can trace back the steps of how we got there and understand what needs to be done to stop it from happening again.
Does this look interesting? Then check out this 3-minute overview of OverOps to learn more, or request a demo with one of our engineers.
