.NET Tools
Essential productivity kit for .NET and game developers
dotMemory 2016.2. Compare memory snapshots from different sessions
Along with multiple performance improvements and bug fixes, dotMemory 2016.2 brings one long-awaited feature: comparison of memory snapshots stored in different workspaces (or in other words, snapshots collected in different profiling sessions).
When might this be helpful? Generally, in any situation where the data you need compared cannot, for some reason, be collected in one profiling session. For example, you want to find out how particular code changes affect memory usage in your application. In this case you need at least two profiling sessions: before and after changing the code.
How does it work?
It’s really simple.

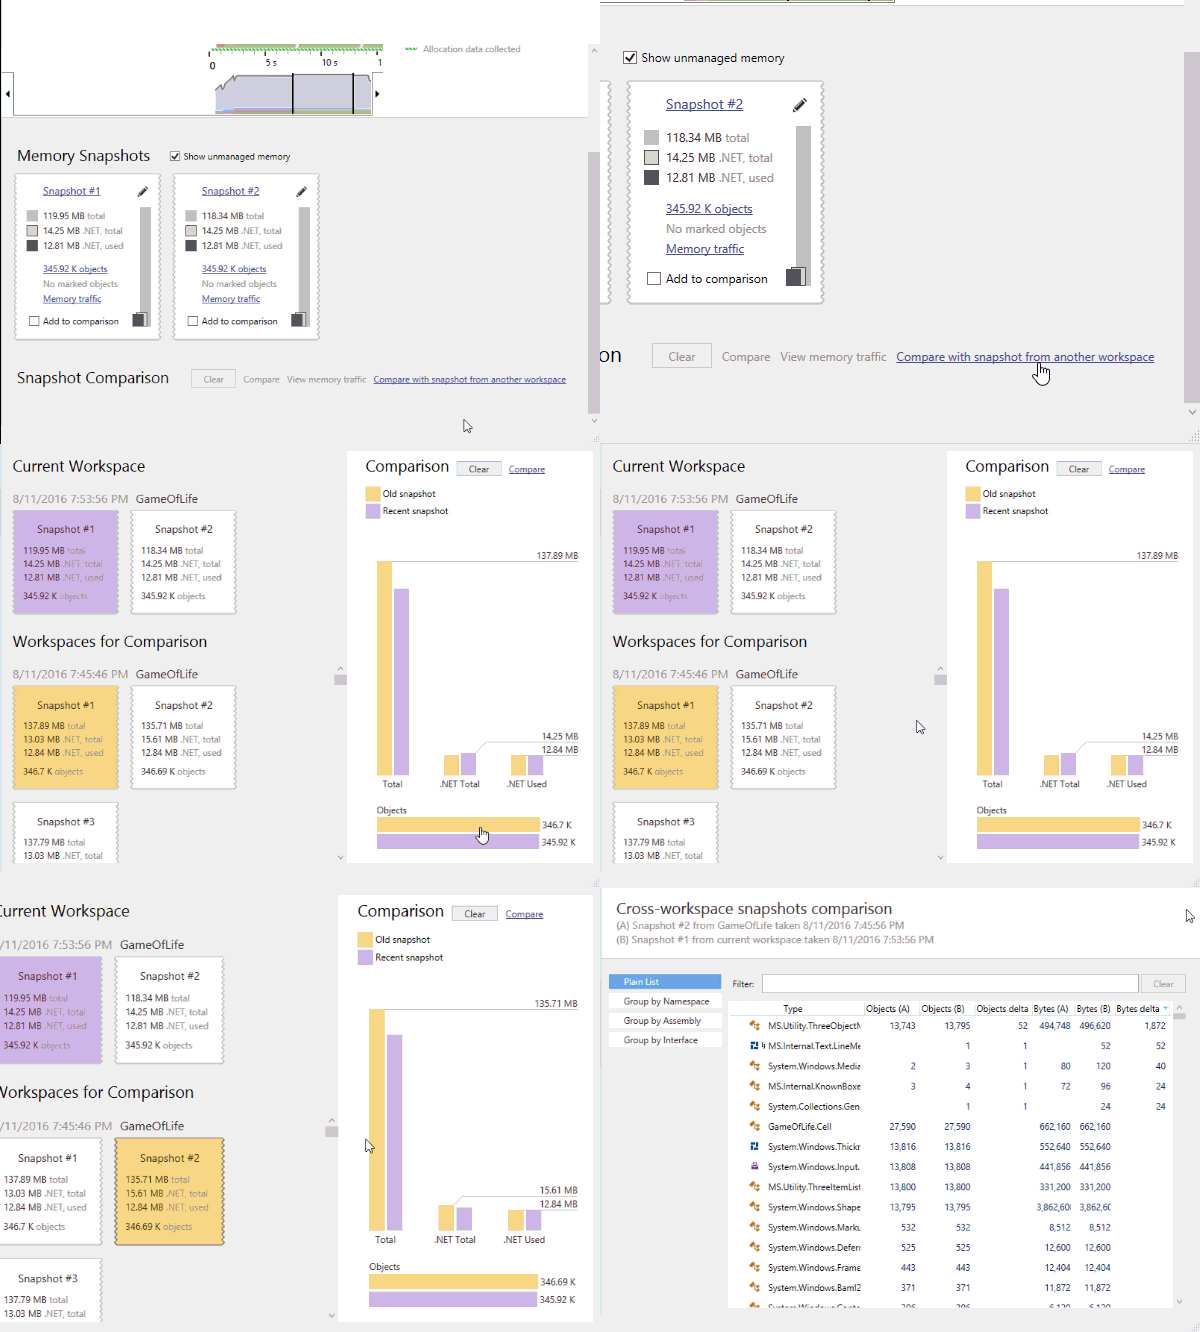
- Profile your application and take snapshot(s), or open an existing workspace.
- Click Compare with snapshot from another workspace.
- Select a snapshot you want to use as basis.
- Select a snapshot for comparison.
- Click Compare.
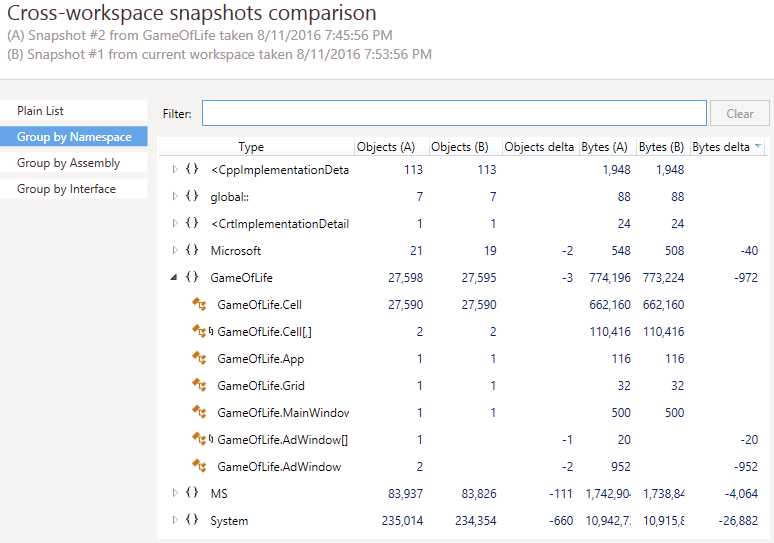
This will open the Cross-workspace comparison view. Here you can see how many objects of a particular type exist in both snapshots. Since it’s impossible to match object lifetime data between sessions, the view won’t show you “new” and “collected” objects (which the regular “within-session” snapshot comparison does show). Nevertheless, in most cases, this data should be enough for further analysis.
For example, you can quickly detect a problem when the same workflow in your application (e.g., before and after you commit changes) leads to a different number of objects in your application’s namespaces.
Consider downloading ReSharper Ultimate and giving this new feature a try.


