

Big Data Tools
A data engineering plugin
Big Data Tools Update

We released another update of the Big Data Tools plugin recently, and this article is an overview of its new features.
The previous release was a momentous event for us as the plugin left the Early Access preview stage and became generally available. Since then, we’ve received a lot of feedback from you and have started developing features that the community wants. For example, Big Data Tools now has support for Kafka, which can be easily connected in just a few clicks.
Let’s take a closer look at what has changed in the new release.
Kafka monitoring
Throughout the year, we conducted polls on which technology you think we need to support in the next release. You can guess which technology won. At some point, we even stopped including Kafka in the list of options because it would always win with a crushing score.
The Kafka ecosystem is huge. There are so many projects out there that are not only using all its capabilities but also extend it in incredibly useful ways. Which parts should we support in the plugin? The goal is to make sure you have everything you need readily available as you develop. For example, you are unlikely to need to reconfigure Kafka every minute with a complete restart of the entire system (this would be useful for an admin, but not a developer). Watching topics, on the other hand, could be very useful. As it would be impossible to memorize them, right?
When looking at the products people generally use to work with Kafka, there are a few that usually come to mind such as the Kafka Tool, Kafdrop, Burrow, and maybe a couple of others. Each one has its own strengths and weaknesses. For example, Burrow doesn’t have a graphical interface, but it can measure lags in consumer groups.
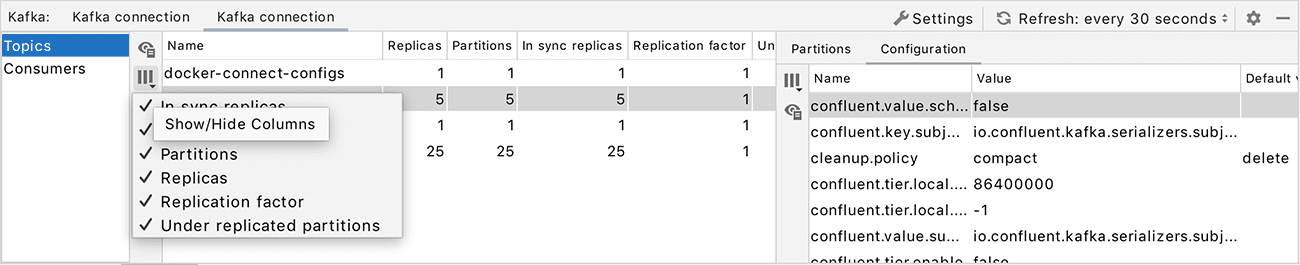
In this release, we concentrated on the essential features that almost every user needs: viewing consumer groups and topics, and configuring them. We cannot yet watch specific messages and create new topics (like Kafdrop can). But if there’s one significant advantage going for Big Data tools, it is that all the available information about the topics is displayed directly in the IDE and updated automatically, so you don’t need to wander aimlessly through the web interfaces to get to that information. You could say this isn’t a replacement for existing tools but a convenient addition to them.
Here’s what the interface now looks like:
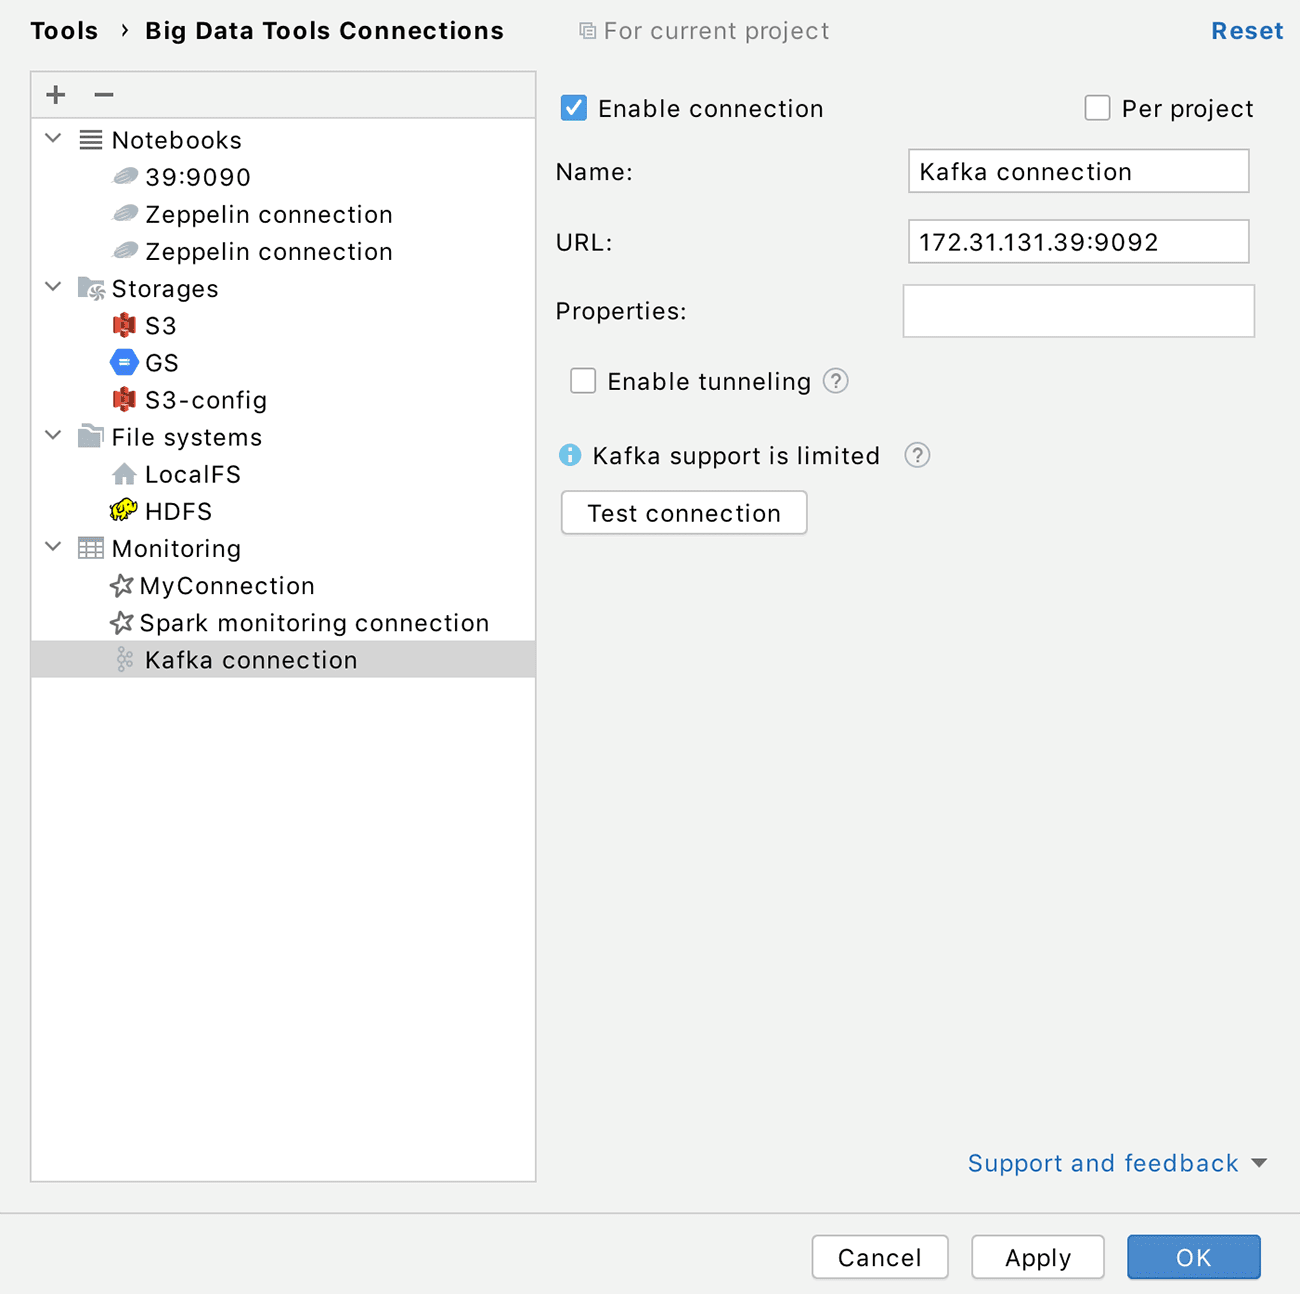
To enable this interface, simply add a new Kafka configuration in the Big Data Tools panel and specify the URL of your server. There’s no need to go into ‘system administrator mode’.
Support for Kafka is still somewhat limited, but we’re working on lots of new features and what’s even better, you can influence what features will appear in the next releases! Follow us on Twitter @BigDataTools and give us your feedback so we know what you want us to focus on. Thank you!
New Project wizard
In previous releases of Big Data Tools, it was assumed that you already had a project that you needed to configure the IDE for. But there are still times where you need to create a new project, for example, if you want to sketch a new prototype or experiment with Spark’s capabilities in a small sandbox.
Previously, you would have had to follow the standard procedure for our IDEs: select a build system and then manually fill in the build file with the settings and dependencies of the new project. Often you had to search for the settings on Google or copy the configuration from some other project. Then when you finally opened it, you’d have to wait another half an hour for the project to be reindexed. This was a pretty big psychological barrier for creating new projects. The painful prospect of having to create a new project in this way must have forced quite a few users to abandon the idea. This is why we set out to remove this barrier to help make your development more enjoyable.
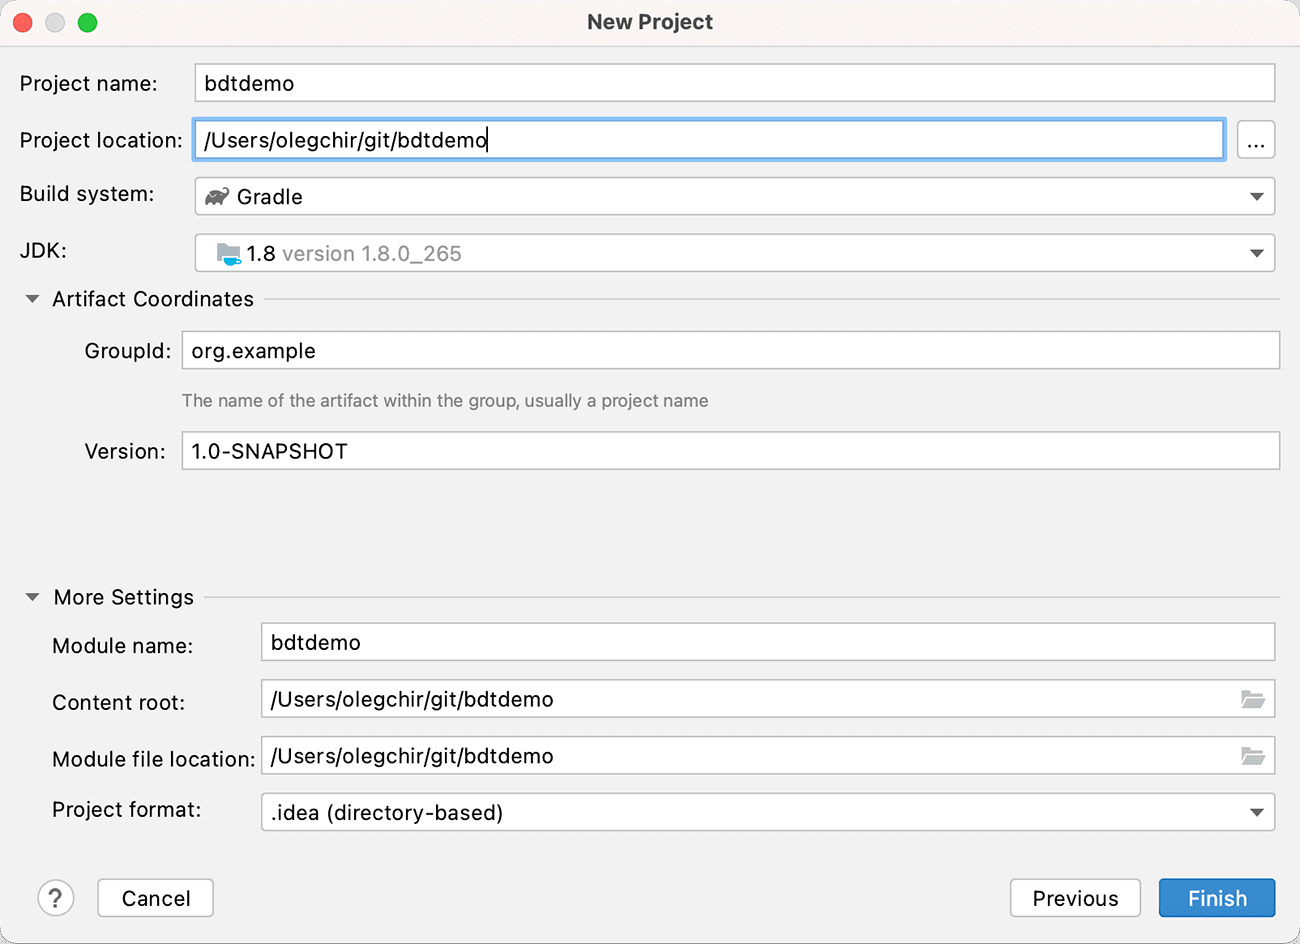
Fortunately, JetBrains IDEs already have an intuitive, ready-made mechanism for creating new projects from a template. Starting with release 1.1 of the Big Data Tools plugin, you can select File → New → Project and find a new category of projects: Big Data Tools. So far, the category consists of just one item: Spark. On the first screen of the wizard, you can select a build system and JDK, and based on this information, the Big Data Tools plugin will automatically create a new project.
The interface looks like something like this:
After that though, the loading of dependencies and indexing will go on as usual; no miracle here. A Gradle project will take longer to get up and running than Maven, but it will give you more flexibility and customization options. All the required dependencies for working with Spark will be loaded in the new project.
To start this project in Big Data Tools 1.1, you’ll need to build it and get the compiled JAR file (for example, in the target directory for Maven). Next, create a new Run Configuration with the Spark Submit type and then proceed as usual. In future releases, we may develop something more advanced, like creating such configurations automatically depending on what you specify in the new project wizard.
Notifications for Zeppelin
One of the main advantages of working with Zeppelin is that you can create a notebook and start writing code instantly. However, people often write code that takes a long time to run. Have you ever had to switch from Zeppelin to some other project just because your one line of code took an hour to run? That experience can ruin your impression of how fast and straightforward everything seems to be in Zeppelin. What’s worse, now you’re biding your time and watching the progress, trying not to miss the moment it completes. That can be a big waste of your time and knock you out of your flow.
With Big Data Tools 1.1, you can get notified when a paragraph has been completed. And we’re not talking about messages inside your IDE; we mean real alerts in your operating system. They work differently in each operating system, but the general idea is the same. No matter what task you are doing now, you will immediately know when to switch to Zeppelin. This means that you can tune out of Zeppelin and devote your full attention to whatever task you’re working on.
Note that the notifications appear only when you are not working in the IDE, that is, only when you are in another window. This is done so as not to overload you with unnecessary information, which there is plenty of as it is.
Not everyone will need these alerts, though, so they’re disabled by default. You can enable them with one click in the Zeppelin configuration settings, like so:
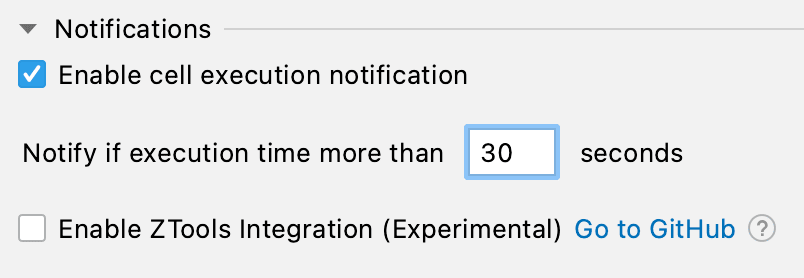
You can also configure the duration of the paragraph so that, for example, notifications will not be sent for very fast paragraphs. We think it makes sense to only enable alerts for tasks that take more than 30 seconds.
Grouping for charts in Zeppelin
One of the most important features of Zeppelin, and the reason why everyone uses it, is the ability to quickly visualize data. The more advanced rendering capabilities Zeppelin has, the more useful it is.
Grouping is a well-known feature that is available in the Zeppelin web interface. Now you can use the same feature in the Big Data Tools plugin. It looks and works similar to what you see in the web interface.
A new field called Groups has appeared in the chart settings. Fill it with the groups you need, and voilà:
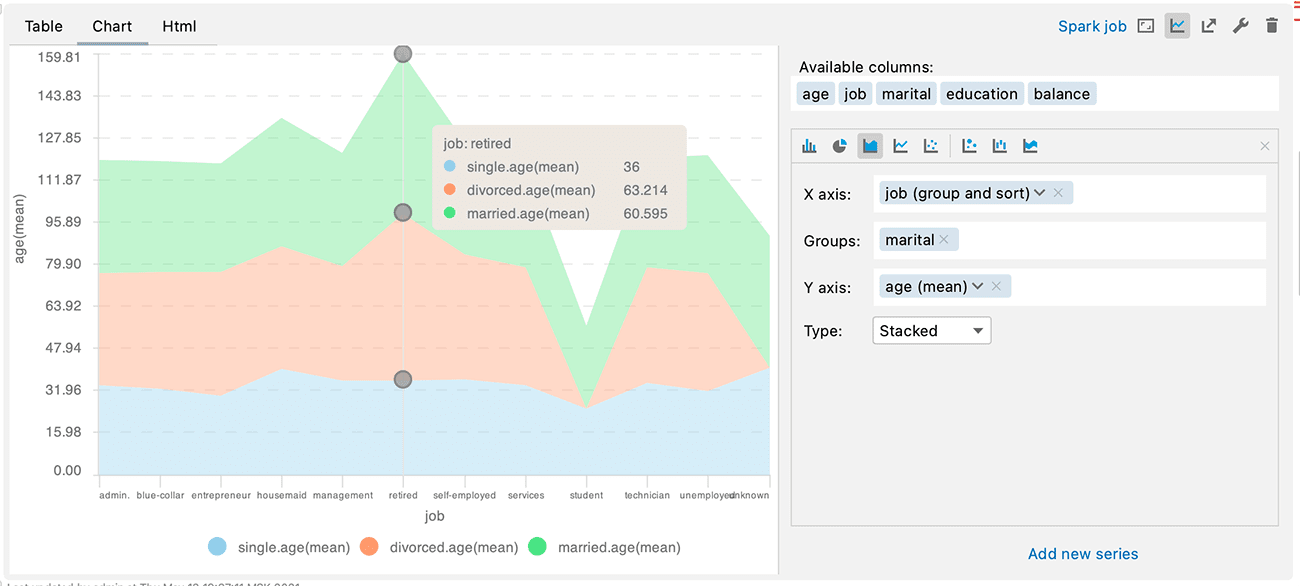
This not only gives you more information for your analysis but also looks beautiful!
Charts in Big Data Tools are synchronized with how they’re displayed in the Zeppelin web interface. They are very fast and accurate, have many settings, and you can always switch between a chart and a tabular view of the data. With the arrival of the grouping field, charts have become an even more useful analytical tool.
Improvements in Azure and S3 support
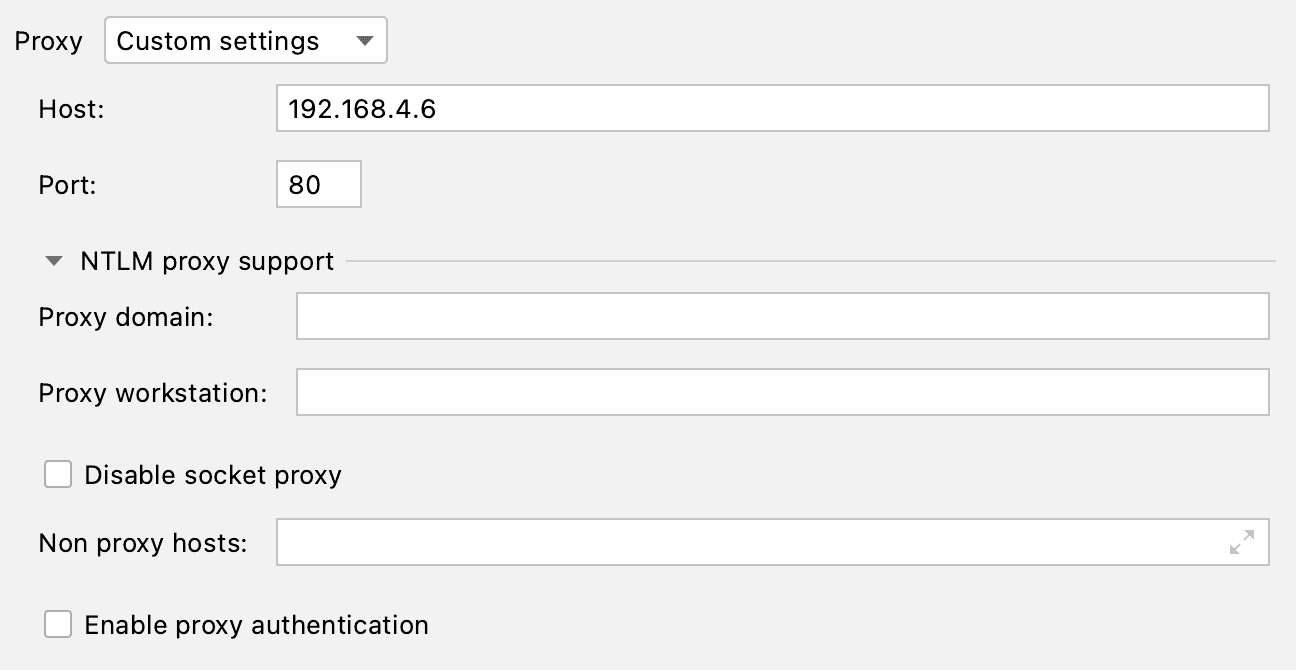
We added a new HTTP Proxy field in the S3 settings. You will probably appreciate this feature if you are located behind a corporate firewall or in some other network without direct access to the internet. Various NTLM settings are available, but SOCKS Proxy is not supported in this release.
For Azure, we implemented another nice optimization: now you can open directories faster. You don’t need to do anything to activate it; it just works.
File encoding switcher
You are probably used to seeing the file encoding indicator in the lower right-hand corner of the IDE window. It is both an indicator and a selector at the same time: you can click it to see a list of all possible encodings.
The same functionality is now available for tabular file views in Big Data Tools:
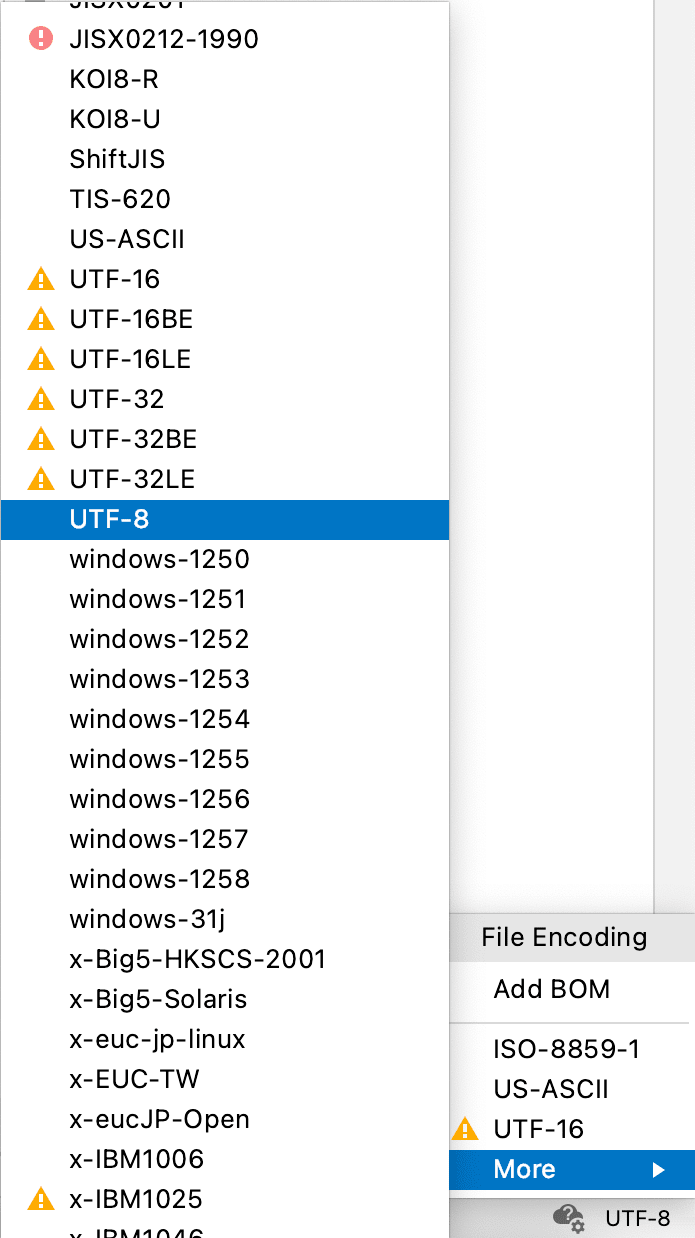
Now you might ask, won’t that corrupt the file on the cloud file system? No, it won’t. When you open a file for viewing on an external file system, of course, you do not get the entire file, but only a small sample from it. For example, about a thousand lines are fetched from CSV. For all the main formats (Parquet, Avro, ORC, and CSV), only the part needed to build the sample is downloaded over the network. The files can be gigantic, and the developer does not need to see all these gigabytes of data to analyze the file structure. For this small sample that you see in the IDE, it’s possible to convert it to the desired encoding. The transcoding function does not modify the file on your cloud file system and only works with a chunk of temporary data downloaded to your computer.
New settings for Spark Submit
In the previous release of Big Data Tools, it became possible to choose a Python interpreter for PySpark. Of course, this only works in a Python-enabled IDE – either PyCharm Professional or IntelliJ IDEA Ultimate with the Python plugin. This function is useful, but you can use it only once, the very first time you try to do something with PySpark. What about Spark Submit, where it’s also a good idea to specify the Python runtime?
Starting with Big Data Tools 1.1, you can do this from the Spark Submit configuration settings window:

In addition, in the Shell options section, you can now specify the Working directory where Spark Submit will run locally.
Bug fixes and improvements
We’re actively developing and enhancing the Big Data Tools plugin, doing our best to take into account all your feedback and fix as many bugs as possible.
For an overview of the recent key improvements, please visit the What’s New section of the plugin page, or check out the full report on YouTrack with just about all the release notes.
You can upgrade to the latest version from your browser, from the plugin page, or right in the IDE. On the plugin page, you’re very welcome to leave your feedback and suggestions. We are always eager to know what you think.
Documentation and social networks
Last but not least, if you’re looking for more info about how to use any of the plugin features, make sure to check out the IntelliJ IDEA, PyCharm, or DataGrip documentation. Need more help? Leave us a message here in the comments or on Twitter.
In version 1.1, we have not only fixed many of the annoying little problems but laid the foundation for new areas that will be developed in the future, including Kafka support and the New Project wizard. Hopefully, all of these improvements will be useful for you, allowing you to do more exciting things and in a more enjoyable way. Thank you for using the Big Data Tools plugin!
The Big Data Tools plugin team


