Datalore
Collaborative data science platform for teams
We Downloaded 10,000,000 Jupyter Notebooks From Github – This Is What We Learned
Here’s how we used the hundreds of thousands of publicly accessible repos on GitHub to learn more about the current state of data science.
Inspired by research carried out 2 years ago by the Design Lab team at UC San Diego, the JetBrains Datalore team decided to download all Jupyter notebooks accessible in October 2019 and October 2020 to gather statistics on the tools that the global DS community has been using in recent years.

2 years ago there were 1,230,000 Jupyter Notebooks published on GitHub. By October 2020 this number had grown 8 times, and we were able to download 9,720,000 notebooks. We made this dataset publicly available, and you can find the instructions for accessing it at the bottom of the post. Feel free to play with it and share your insights with us by mentioning @JBDatalore on Twitter, or write to us at contact@datalore.jetbrains.com.
All the statistics mentioned below were calculated using this notebook in Datalore, which is an online Jupyter notebook with smart coding assistance hosted by JetBrains.
Now let’s dive into the figures.
The language of data science
Despite the rapid growth in popularity of R and Julia in recent years, Python still remains the most commonly used language for writing code in Jupyter Notebooks by an enormous margin.
Other commonly used languages include Scala, Scilab, C++, Bash, MatLab, and Java.
The chart below illustrates how common various programming languages were in the sample of notebooks we studied.
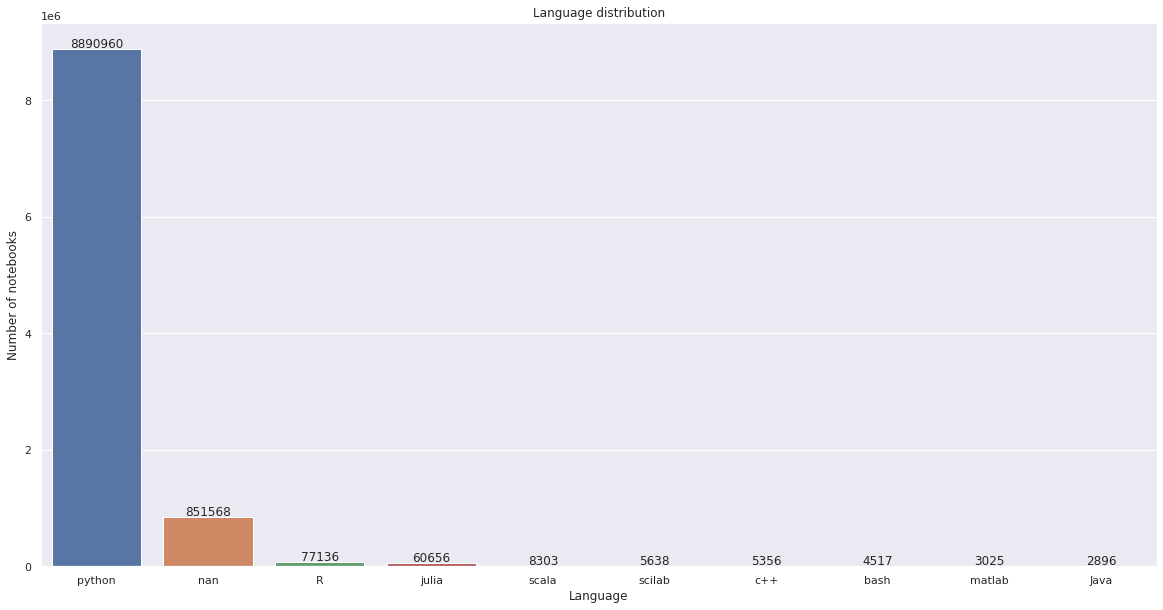
The “nan” value refers to notebooks for which the language metadata was not available.
The table below shows the change in percentage of notebooks using Python 2 and Python 3 between 2018 and 2020.
| Python 2 | Python 3 | Other languages | |
|---|---|---|---|
| 2018 research | 52.5% | 43.8% | 3.7% |
| 2019 research (JetBrains Datalore) | 18.1% (1029K total) | 72.6% (4128K total) | 9.3% (529K total) |
| 2020 research (JetBrains Datalore) | 11.8% (1154K total, +125K since 2019) | 79.3% (7710K total, +3582K since 2019) | 10.8% (1050K total, +521K since 2019) |
Since 2019 the number of Python 3 notebooks has grown by 87%, and the number of Python 2 notebooks has grown by 12%.
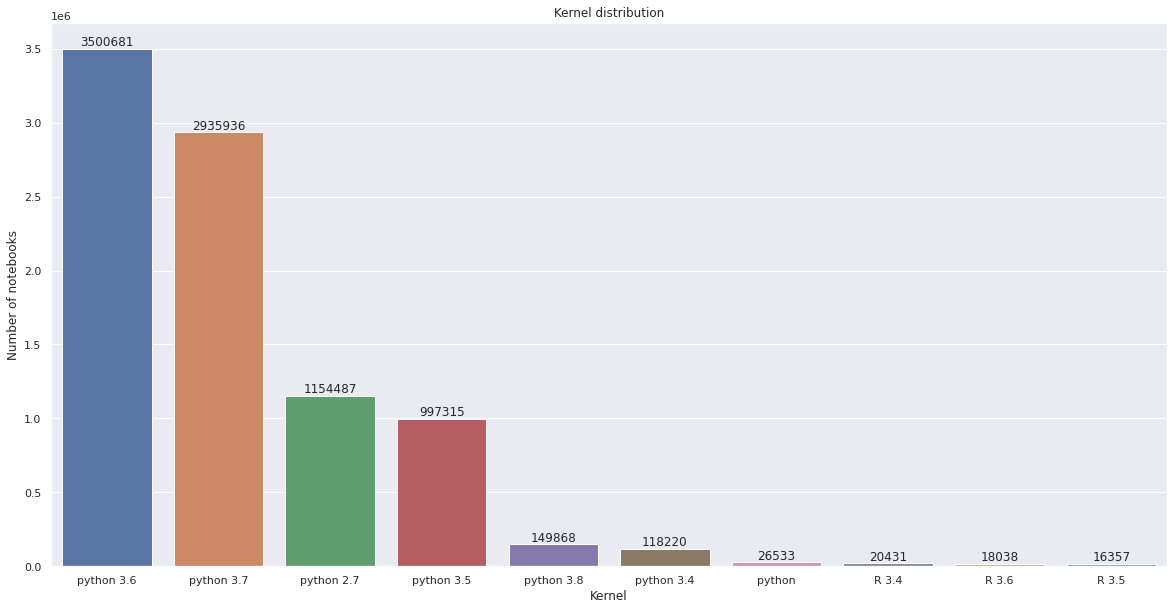
Below you can see the distribution of notebooks in Python and R divided according to their respective versions:
Top data science libraries
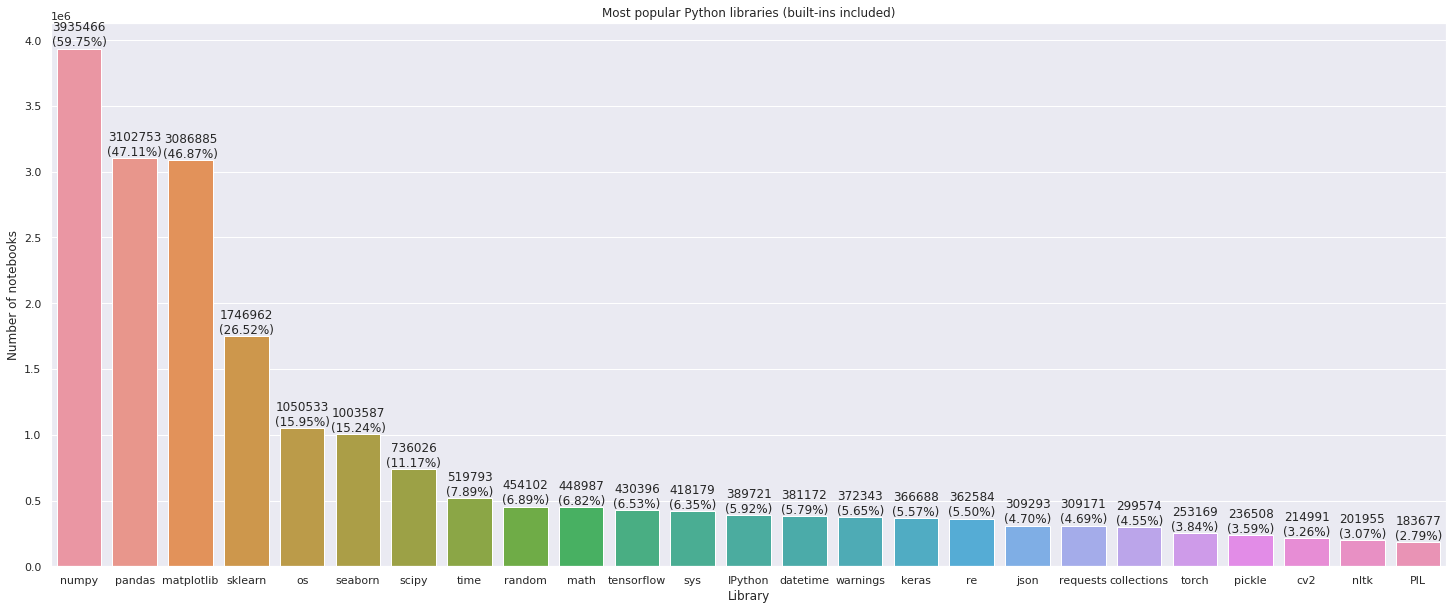
To help Datalore users get started quickly and easily, we decided to preinstall the commonly used Python packages. For this we calculated the stats on the most used library imports.
It was no surprise to discover that 60% of notebooks contain Numpy imports, 47% feature Pandas and Matplotlib imports.
The chart below illustrates the popularity of different packages in our notebook sample:
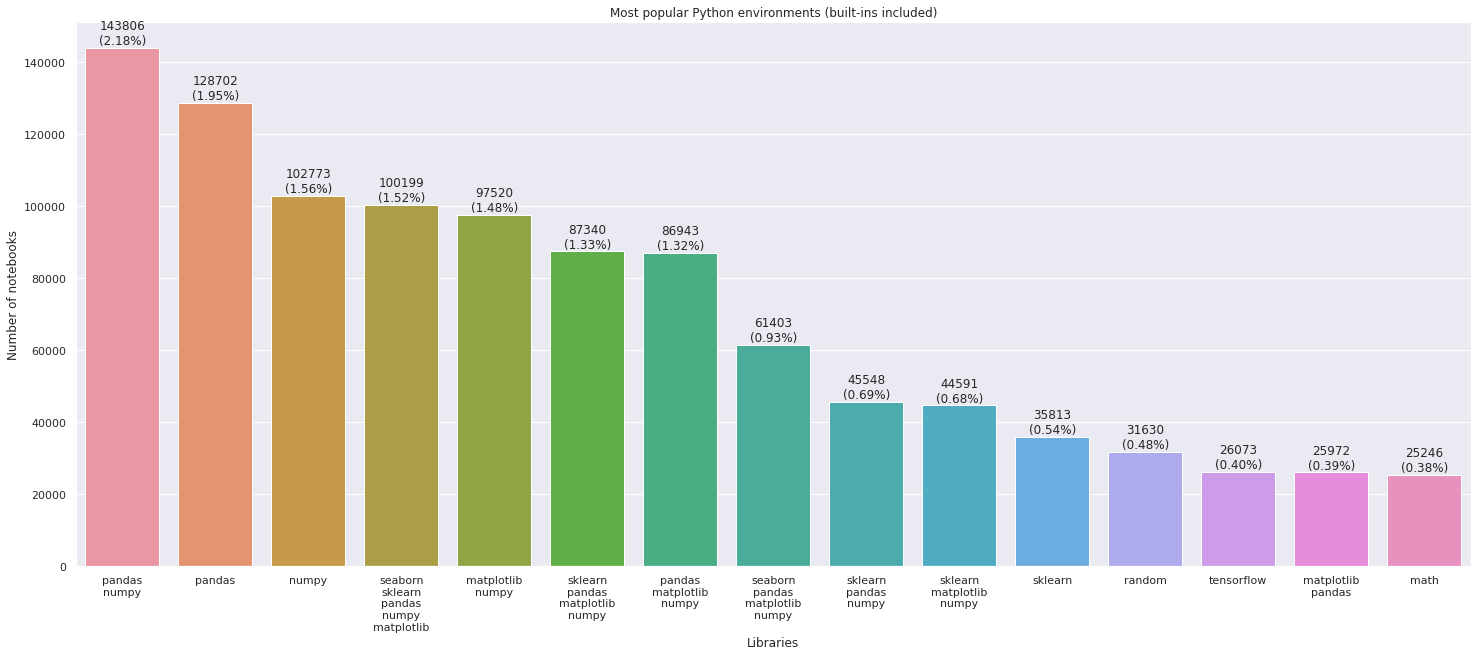
Most popular environments (combinations of packages):
TensorFlow vs PyTorch
Part of our team is especially interested in deep learning libraries, so we decided to take a look at the growth in use of PyTorch and TensorFlow libraries. From the numbers below, we can see that pure PyTorch is growing significantly faster than pure TensorFlow.
At the same time we should keep in mind that Keras library partially uses TensorFlow, and Fastai uses PyTorch. This means that the growth rate of TensorFlow is most likely higher, but we can’t say for sure which library was used in more new notebooks over the past year.
| Tensorflow | Keras | PyTorch | Fastai | |
|---|---|---|---|---|
| 2019 research | 321K | 231K | 110K | 19K |
| 2020 research | 430K (+34%) | 367K(+59%) | 253K(+130%) | 25K(+32%) |
Notebook cells and their contents
Some general statistics regarding notebook contents:
- 71.90% of notebooks contain markdown.
- 42.13% of notebooks contain image outputs (plots).
- 12.34% of notebooks contain LaTex.
- 19.77% of notebooks contain HTML.
- 20.63% of notebooks contain code inside Markdown.
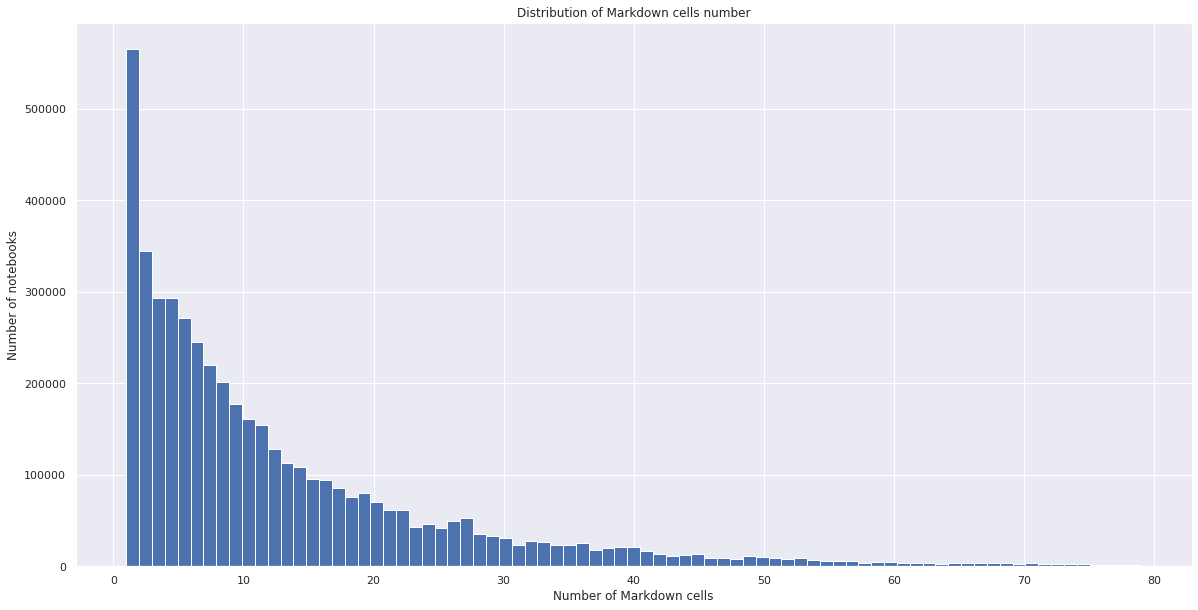
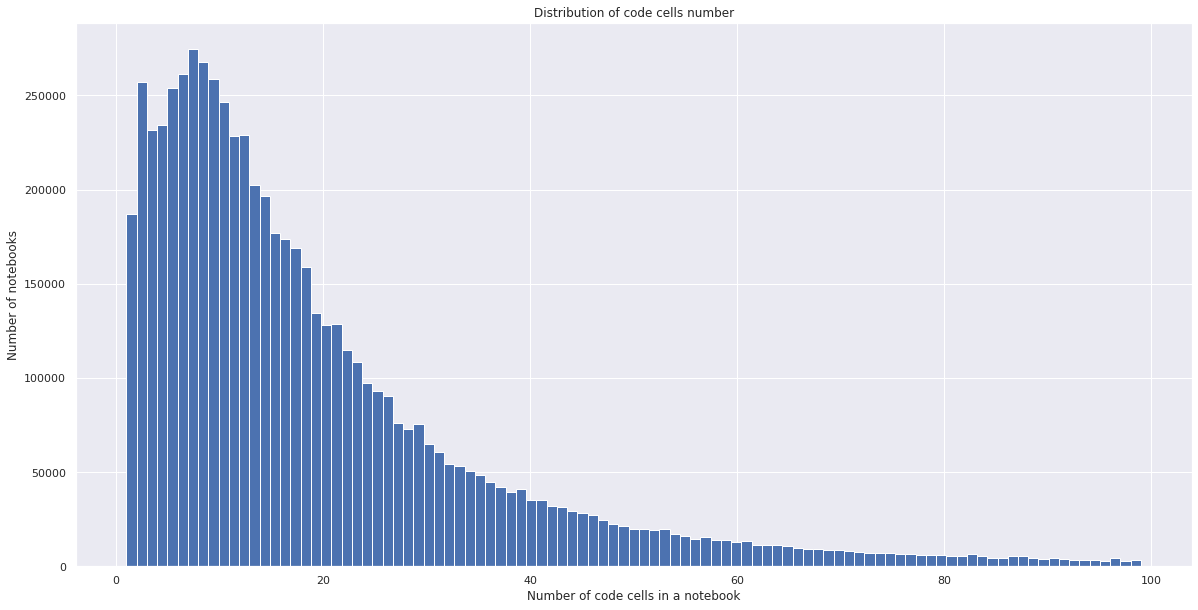
Markdown is extensively used in Notebooks. 50% of notebooks contain fewer than 4 Markdown cells and more than 66 code cells.
The charts below illustrate distribution of Markdown and code cells across notebooks:
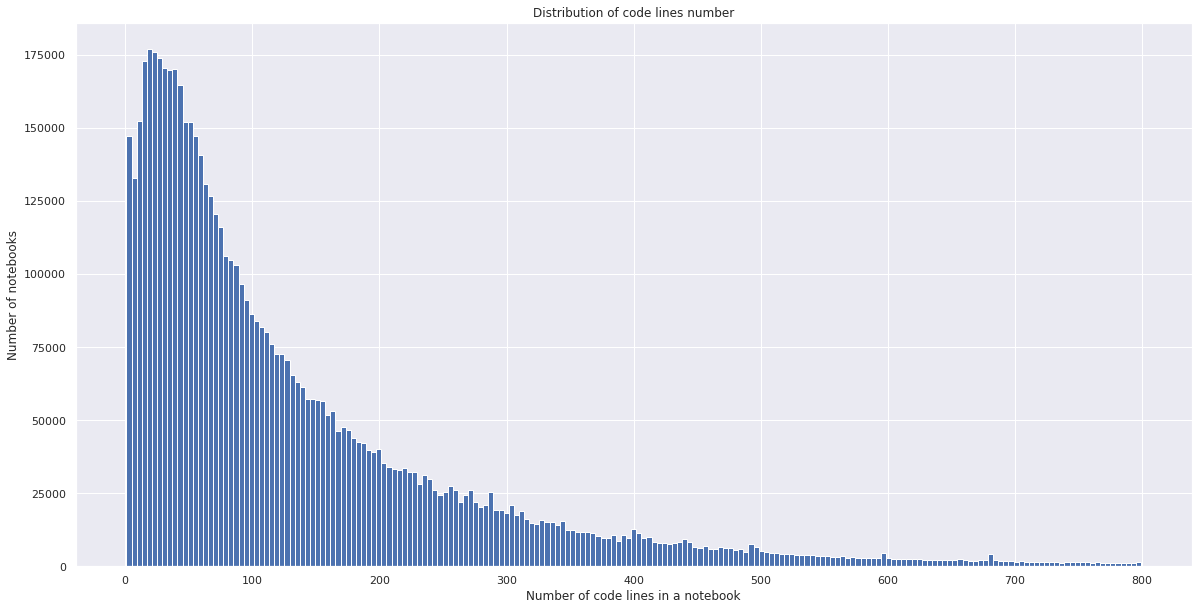
And here is the distribution of the number of code lines. Although there are some outliers, like notebooks with more than 25,000 code lines, 95% of the notebooks contain less than 465 lines of code.
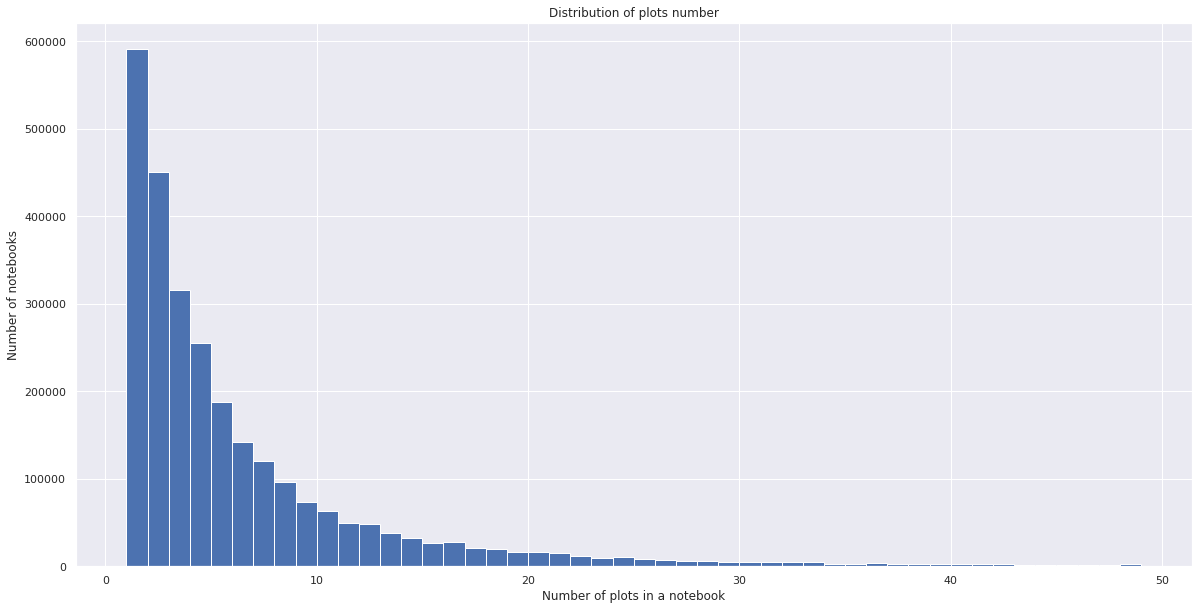
Plotting is also very popular. As we mentioned above, 42% of notebooks contain plots, and 10% of these notebooks contain more than 8 plots.
Consistency of notebooks
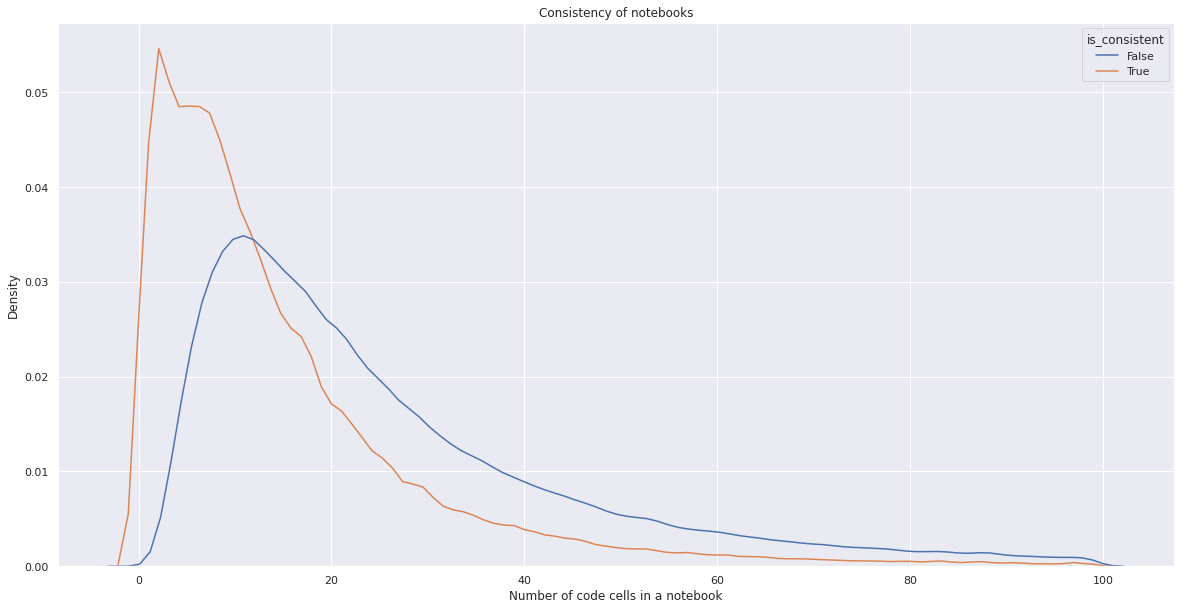
It’s a known problem for Jupyter Notebooks that not all the notebooks can be reproduced. We tried to investigate a part of this problem by taking a look at the order in which code cells were executed. If code cells were not originally executed in a linear order, we can’t be sure that the result of linear order execution will be the same.
We categorized notebooks that were executed in a non-linear order as “not consistent”, and it turns out that 36% of the notebooks we investigated fell into this category.
We looked at whether consistency depends on the number of markdown and code cells. Unsurprisingly, we found that the fewer code and Markdown cells a notebook has, the more it is likely to be consistent.
The number of notebooks created each year is growing extremely fast, and the .ipynb file format is increasing in popularity at a rate close to that of data science itself. We hope this research inspired you to conduct your own analysis. You can see how we calculated all the stats in this Datalore notebook and use the data for your own research!
Kind regards,
Datalore team
Links
- Previous research
- Datalore notebook with preprocessed data
- Dataset download instructions:
- Access original notebooks (10M files, 4.4 TB)
a. S3 bucket source: https://github-notebooks-update1.s3-eu-west-1.amazonaws.com/
b. Getting the list of all the files via AWS S3 API could take a while, so here is a JSON file with all the filenames: https://github-notebooks-samples.s3-eu-west-1.amazonaws.com/ntbs_list.json
c. Just append the filename from JSON to the bucket address to get a direct link to the file, e.g. https://github-notebooks-update1.s3-eu-west-1.amazonaws.com/0000036466ae1fe8f89eada0a7e55faa1773e7ed.ipynb - Or access the preprocessed data used in this research (3GB) from this Datalore notebook.
- Access original notebooks (10M files, 4.4 TB)
Subscribe to Datalore News and Updates

