

Datalore
Collaborative data science platform for teams
🚀 New in Datalore: Interactive Controls, Hidden Cells, Collapsing Inputs and Outputs, and Bug Fixes
Greetings from the Datalore Team!
We believe that Jupyter notebooks could become a great presentation and reporting tool. You can already showcase results with the power of Markdown and visualizations, but a lot of code cells can make it hard for business people to perceive the most important information.
Read on to learn how Datalore makes notebooks more friendly for non-tech people.
Interactive controls meet Reactive mode
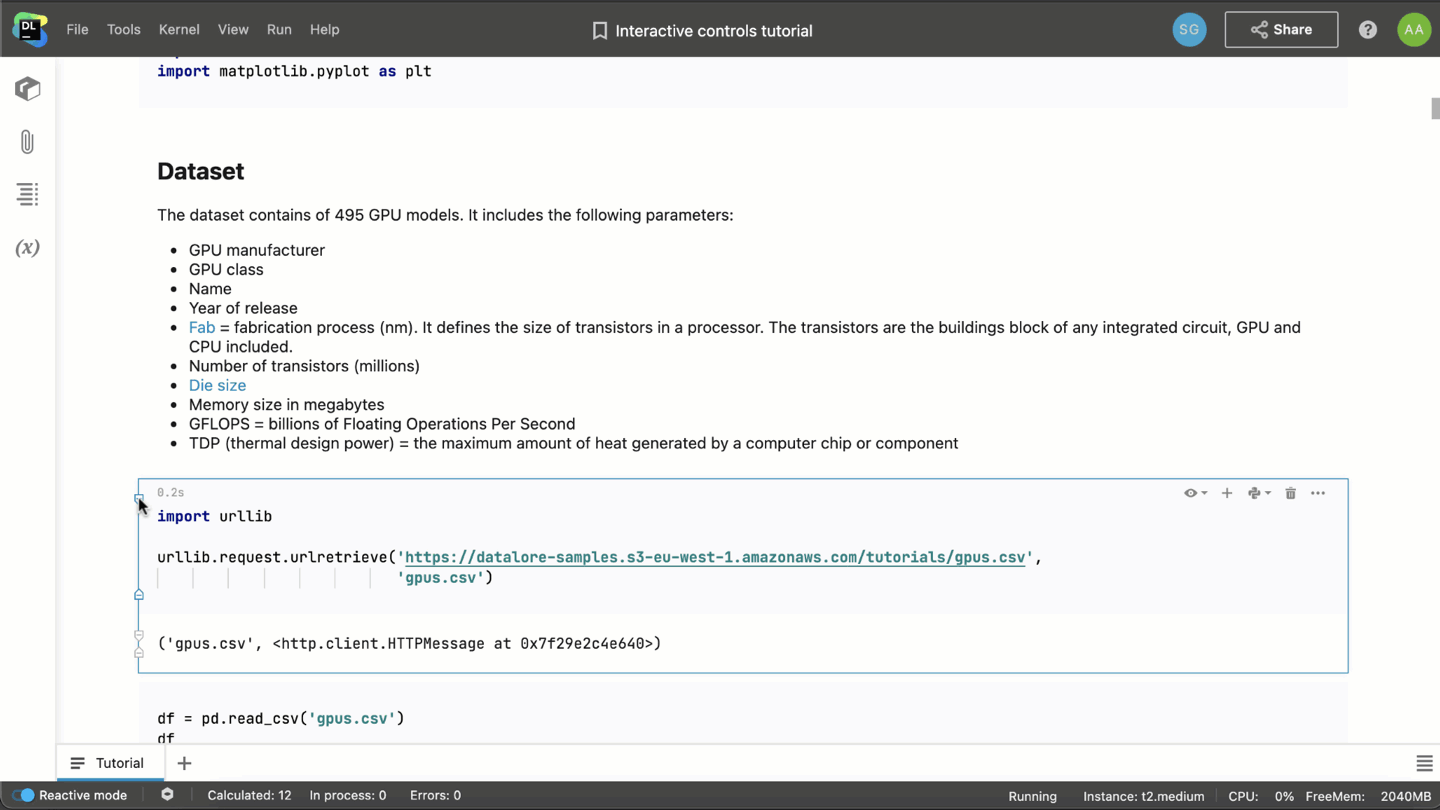
When presenting data analysis results, it might not be effective to rewrite or rerun code for slightly different parameters. The idea is to create a control cell that will help you quickly change the parameters and recompute the results.
A few solutions already exist, like the Ipywidgets library, a Python library that helps integrate sliders, dropdowns, and other control forms inside the code. Datalore supports Ipywidgets, but with Ipywidgets you still need to write a lot of complex code and recompute the following cells manually to get the updated results.
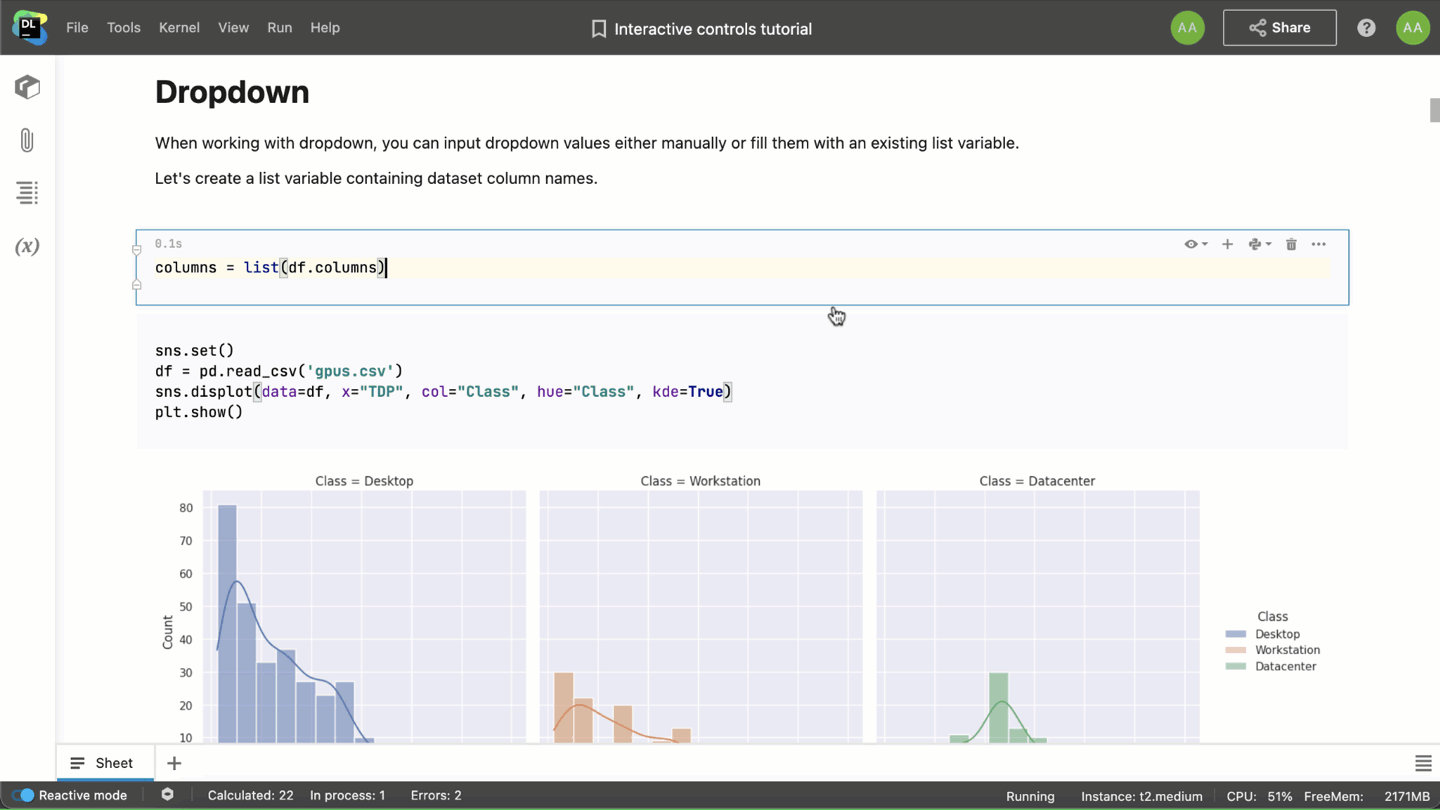
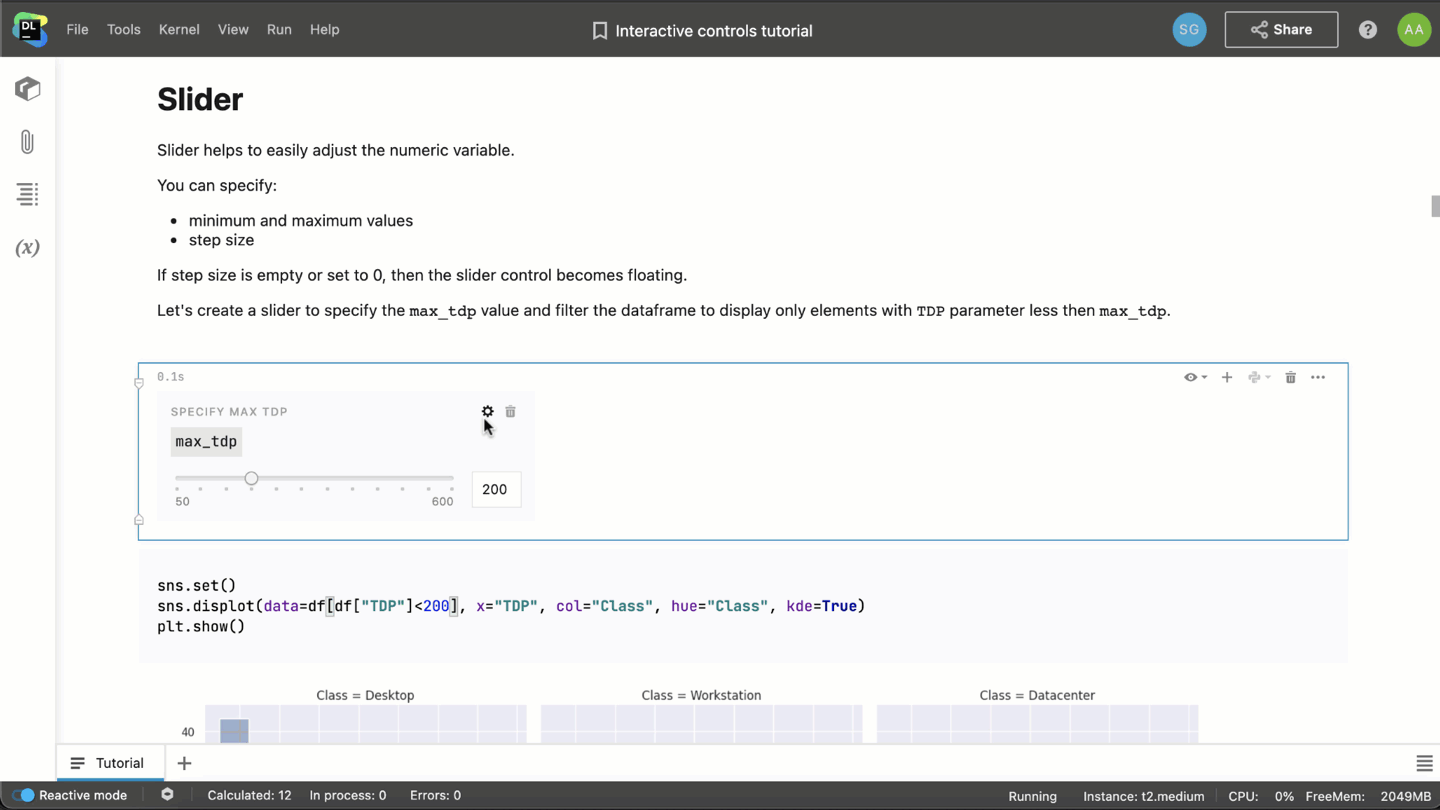
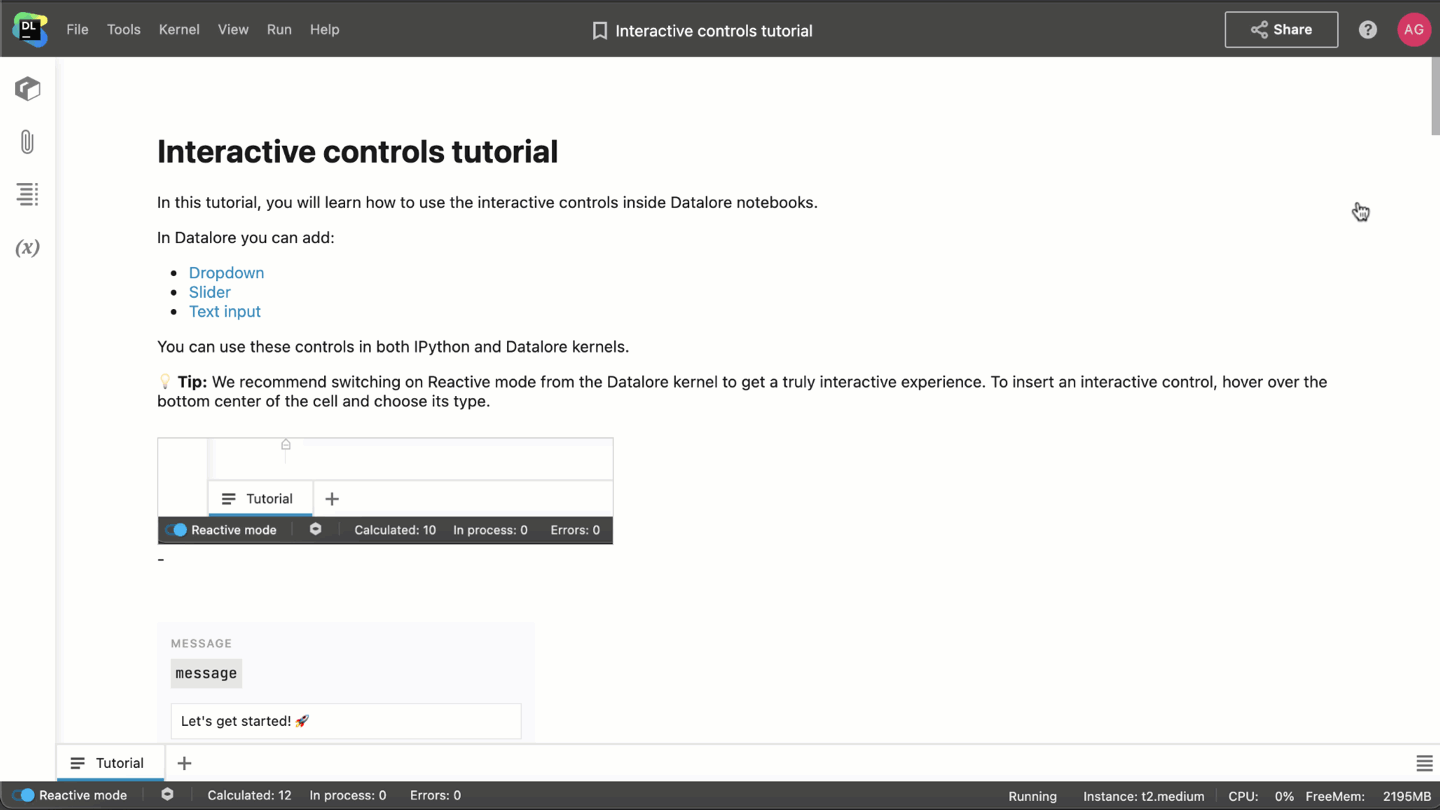
We went further and introduced interactive dropdowns, sliders, and text inputs available from the editor UI. To insert an interactive control, simply choose its type when adding a new cell. Each interactive control corresponds to a variable that you can then use in your code.
? Tip: Make sure to switch on the Reactive mode from the Datalore kernel. It will recompute all the dependent cells on the fly and you won’t have to click the run button when you change the control value.
Here are the options available for interactive controls:
- For dropdowns, you can either specify the list of values manually or choose an existing list variable.
- For sliders, you can specify the range and steps.
- For text inputs, you can set up the label.
When it’s time to share the interactive notebook with colleagues, you can create a link with editing access and send it to your team.
Follow this link and click Edit copy to play with the demo notebook for this feature!
? Tell us about your experience
If you are already creating reports using Jupyter notebooks, we’d like to learn about your experience and your use cases. Join our product team for a 30-minute interview and get 3 months of the Datalore Professional Plan for free! If you’re up for this, click here to schedule your meeting.
Hidden Cells
When sharing your notebooks with viewers or publishing static reports, you might want to completely hide specific information to make your notebooks look cleaner. There might be a lot of code cells or some intermediary steps that you still want to keep inside the notebook but don’t want to show to viewers.
We’ve added an ability to hide cells for this use case:
- To hide all inputs and outputs, go to the View menu tab.
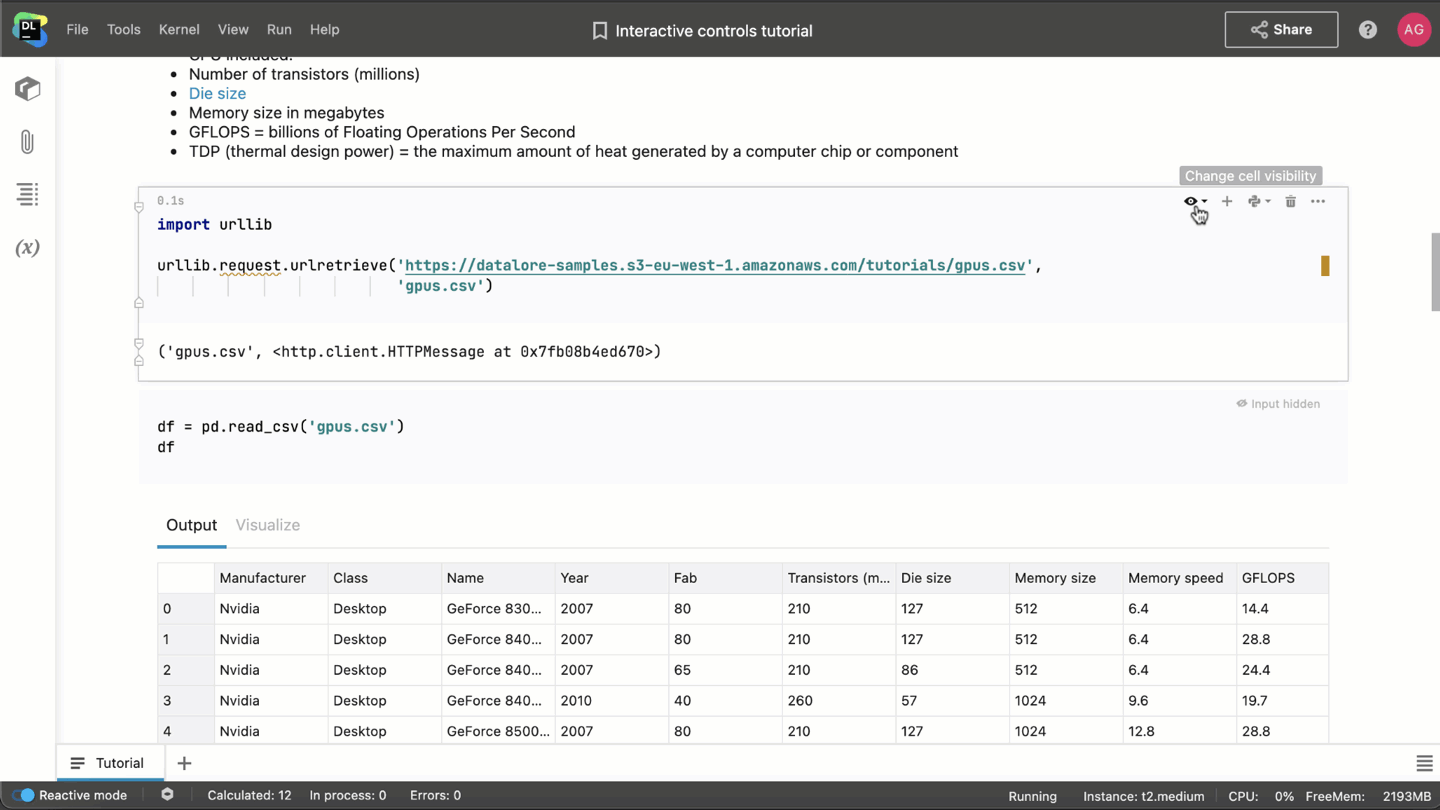
- To configure the visibility option for a specific cell, click on the eye button in the upper right corner of the cell.
Collaborators with edit access rights will still be able to see hidden cells.
Collapsing Inputs and Outputs
Notebooks can become huge, and even with the Table of contents, it can be hard to navigate through them. To make your notebooks look cleaner and to help you stay more focused while writing code, we’ve added the ability to collapse specific inputs and outputs.
Collapsing cells will only affect the way you see the notebook.
? Tip: For an even cleaner editor look, try out the distraction-free mode from the View menu tab.
Bug fixes
Before releasing Datalore Enterprise, we had a major quality marathon where we fixed a lot of bugs. Here are the highlights:
- Now you can import notebooks to shared workspaces.
- Outputs are not lost anymore when you clone a notebook.
- Images in Markdown cells no longer get lost when publishing a notebook.
- Reactive mode in the Datalore kernel is now synced for collaborators.
- File uploading is no longer interrupted when you upload another file.
That’s all for now. Follow us on Twitter @JBDatalore to keep up with our updates!
Happy data sciencing!
The Datalore team


