.NET Tools
Essential productivity kit for .NET and game developers
Advanced scenarios with dotCover Console Runner
In an earlier post, we saw how to use dotCover in simple scenarios, whereby we have a single unit test project for which we want to obtain coverage reports on. There are times however, when this is not the case; that is, we might have multiple tests projects. It is very common (and recommended practice) to separate Unit test projects from Integration test projects, allowing us to run the former more frequently during development and the latter during an Automated Continuous Integration setup. In these cases, running the dotCover analyse command, as shown in the previous post might not be ideal.
Fine tuning the coverage steps
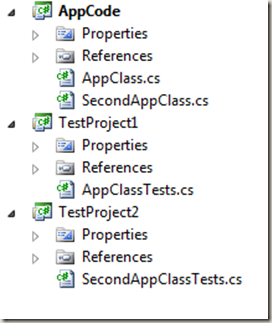
For the scenarios described, whereas we have multiple test projects, dotCover allows us to fine-tune the coverage process by offering us a series of commands that breakdown the coverage, merging and reporting into individual steps. Suppose we have the following Project Layout
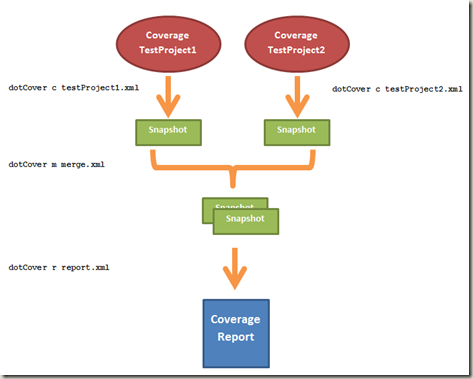
The AppCode is our application code that we want to run coverage for, and TestProject1 and TestProject2 are specific the test projects that cover AppCode. These can be Unit Test or Integration Test projects. The process we need to follow is shown in the figure below:
We run coverage on each of the tests projects by using the cover (c) command using the following configuration file (corresponds to testProject1.xml. testProject2.xml is similar)
<CoverageParams>
<Executable>
X:LibrariesnUnitnunit-console.exe
</Executable>
<Arguments>TestProject1.dll</Arguments>
<WorkingDir>TestProject1bindebug</WorkingDir>
<Output>output1.xml</Output>
<Filters>
<IncludeFilters>
<FilterEntry>
<ModuleMask>AppCode</ModuleMask>
<ClassMask>*</ClassMask>
<FunctionMask>*</FunctionMask>
</FilterEntry>
</IncludeFilters>
<ExcludeFilters>
</ExcludeFilters>
</Filters>
</CoverageParams>
[Command to execute: dotcover c testProject1.xml]
Executing this command generates a snapshot file with coverage data, the Coverage Results Descriptor (by default, unless specified in the configuration file using the TempDir element, the snapshots are saved in the User temporary folder). These snapshots are not the final XML report that we are after but intermediate information that dotCover uses to generate reports from. There is a correspondence between snapshots and processes, such that each process generates a single snapshot. In our case, since we are calling a unit testing framework to launch a single test project, there will only be one snapshot. However there are cases, for instance when running coverage report on an application, whereby the application can launch another process itself. In this case, multiple snapshots will be generated.
When we run this command, once for each Project, we end up with two snapshot files. We now need to merge the snapshots in order to generate the XML report. This is accomplished using the merge (m) command
<MergeParams>
<Source>
<string>output1.xml</string>
<string>output2.xml</string>
</Source>
<Output>output_merged.xml</Output>
</MergeParams>
[Command to execute: dotcover m merge.xml]
which takes the output of the two cover commands (output1.xml and output2.xml) and generates a single snapshot file. The only thing remaining is to generate an XML coverage report based off of this data, using the report command
<ReportParams>
<Source>output_merged.xml</Source>
<Output>results_merged.xml</Output>
</ReportParams>
[Command to execute: dotcover r report.xml]
providing us with the XML report containing coverage information (percentage of code covered, statements covered), which like in the previous post we can apply an XSLT to format into HTML or JSON.
Other Coverage Commands
dotCover provides two more commands:
- list
- delete
The list command simply obtains a list of all snapshot files given the coverage descriptors, that is, the output of the different cover commands. The configuration file lists these descriptors:
<ListParams>
<Source><!– Required. At least one child element expected. –>
<string><!– Coverage results descriptor 1 file name –></string>
<string><!– Coverage results descriptor 2 file name –></string>
<string><!– Coverage results descriptor N file name –></string>
</Source>
<Output><!– Required. Resulting file name. Stores plain list of all snapshot files. –></Output>
</ListParams>
The delete command deletes the list of given snapshots:
<DeleteParams>
<Source><!– Required. At least one child element expected. –>
<string><!– Coverage results descriptor 1 file name –></string>
<string><!– Coverage results descriptor 2 file name –></string>
<string><!– Coverage results descriptor N file name –></string>
</Source>
</DeleteParams>
Summary
As we can see, dotCover allows us to fine-tune the coverage process by letting us control the different steps. One question that might arise is why couldn’t we have done the same by running the analyse command twice, once for each Test Project. If we were to do that, we would get two independent reports, whereas here the results are all merged into a single report. The analyse command is a great fit for simple scenarios that only have a single project. Once we move onto more complex setups, having a finer control over the coverage process has its benefits.


