

.NET Tools
Essential productivity kit for .NET and game developers
Running Code Coverage from the Console with dotCover

As of the beta* of dotCover, we included a Console runner to run coverage using the command line, allowing for instance, setup of dotCover in a Continuous Integration environment. Let’s see how it works.
*To get all these features in this post, you need to download the latest nightly build
Console Runner
The Console runner is located under the installation folder (%Program Files%JetBrainsdotCoverv1.0bindotCover.exe). The best option is to add it to the system path so as to be able to run it from anywhere. The runner accepts several commands based on the operation we want to perform. Each of these commands in turn takes one parameter, which is an XML configuration file. The commands are:
- cover: Coverage of specified application
- merge: Merges snapshots
- report: Creates an XML report of the coverage results
- list: Lists snapshots
- delete: Deletes snapshots
- analyse: Provides an all-in-one analysis and output
We can also obtain a list of commands by typing dotCover.exe help on the command line:
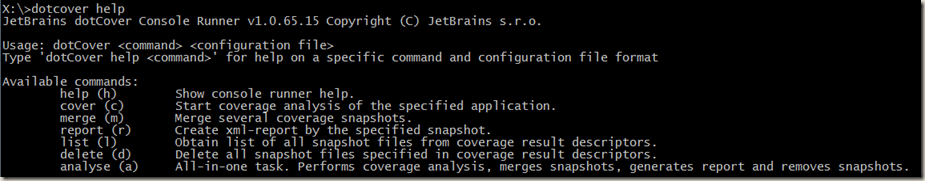
As shown in the figure above, we can find out more about each command by typing help followed by the command. All commands (including help) have corresponding shortcuts. For instance, to get information about analyse, we can type:
dotCover.exe help analyse
or
dotCover.exe h a
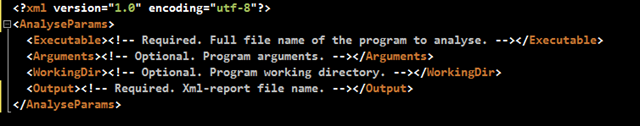
Since all commands take as parameter an XML file, when requesting help, all they do is generate a sample XML with comments indicating what each element means. The previous command would therefore output:
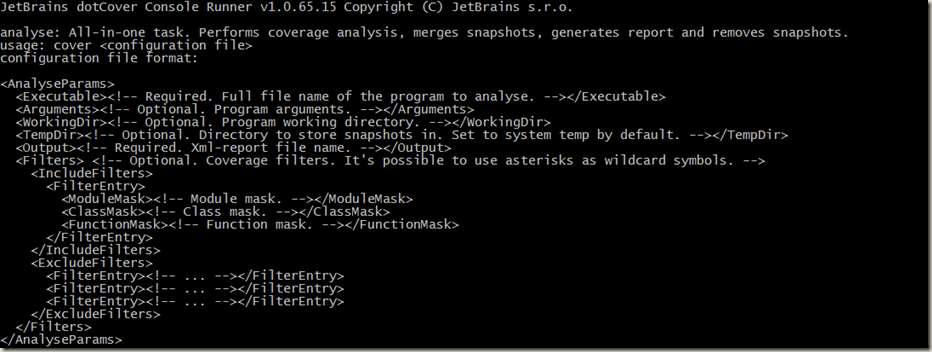
The obvious advantage to this is that we can easily get a new configuration file setup by just asking for help and piping the output to some file. In fact, adding a third filename parameter, dotCover will do this for us, without us having to touch up the output (remove headers, etc.).
Coverage in one command
The dotCover console runner is flexible in that it complies with most common requirements in a Continuous Integration setup. Normally in projects, we have multiple test projects we need to cover. We might then want to see the results separately or merge them as one report. dotCover allows for this kind of flexibility. However, in many cases, all we want to do is run coverage on a single test project and see the results. We’ll see how to do that in a single step in this blog post and in a future post we’ll get into the details or merging, listing, etc.
Let’s see how to do this step by step. I’ll be using a sample app that I’ve prepared for this blog post (using MSpec). You can adjust the parameters to your own project paths and unit testing framework as required.
- Type dotcover help analyse coverage.xml on the command line. I’m doing this in the root folder of my solution.
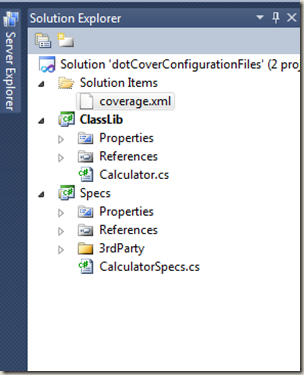
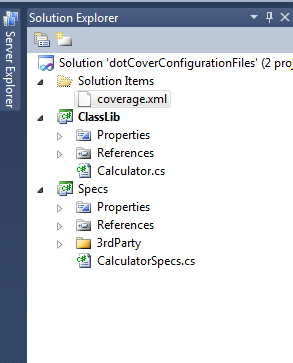
- Add coverage.xml to the Solution and open it up in Visual Studio
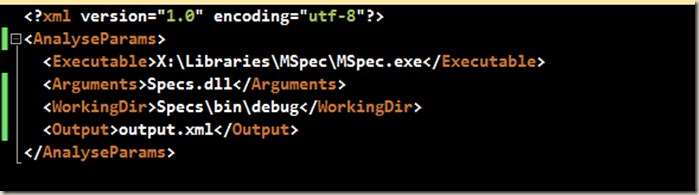
- Eliminate all elements except the following
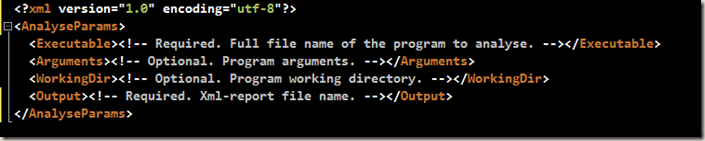
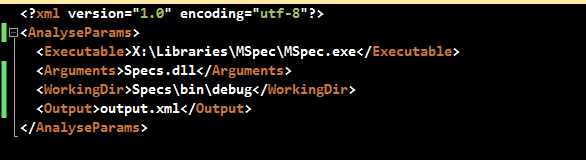
- Fill in the elements with the corresponding values:Executable: Is the path to the unit testing framework runner (in this case mspec.exe)
Arguments: Arguments passed to the runner, the test assemblies (specs.dll)
WorkingDir: Optional path to the working folder (provide this to not have to fully qualify test assemblies)
Output: XML Report containing coverage information. Relative to the coverage.xml path (output.xml)
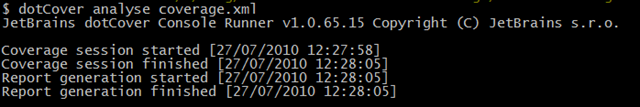
- That’s it in terms of configuration. Now all we need to do is run it by typing dotCover analyse coverage.xml. If all is configured correctly, we should see the following output:
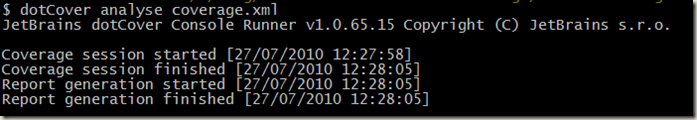
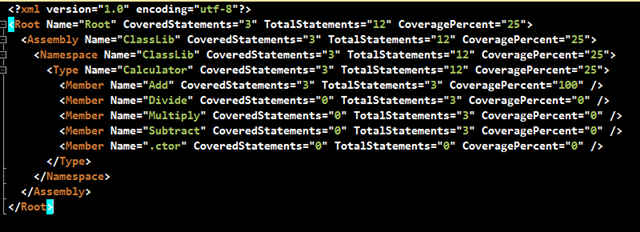
and there should be an output.xml file located in the same folder. Opening it up we can see the coverage results
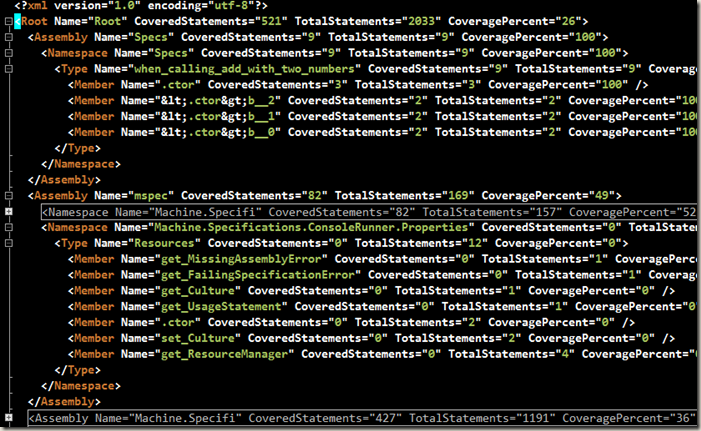

Filtering from the Console
Looking at the results, we can see that there is a lot of noise, that is, assemblies that we’re not interested in such as the tests, MSpec assemblies, etc. In a previous blog post, we saw how to filter these out using dotCover GUI. Let’s see how we can do this via the command line. If we generate the default coverage configuration, we can see that there is a filter section:
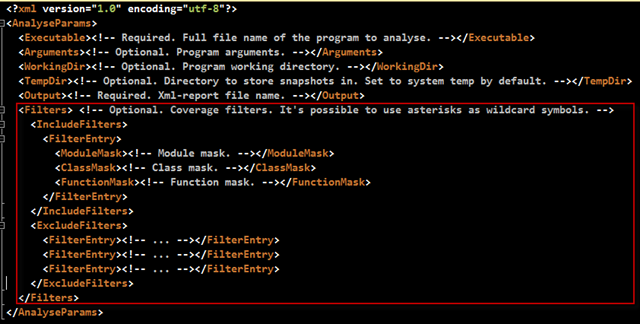
These are used to filter assemblies. We can indicate which assemblies we want covered and which we don’t. In order to filter out all assemblies and concentrate only on our actual code (ClassLib), we can do one of two things:
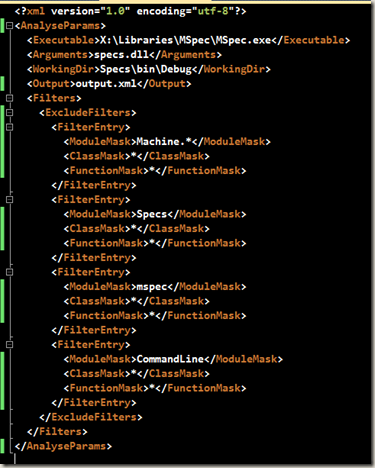
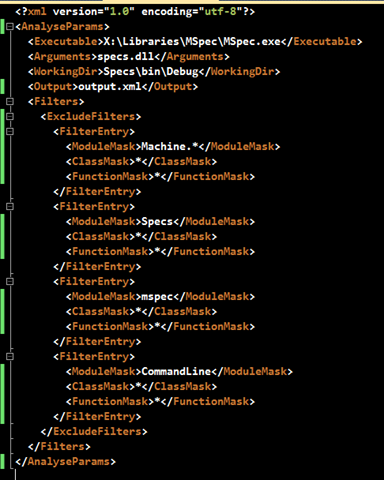
- Filter out all non-required assemblies individually by adding them to the ExcludeFilters section, as in:
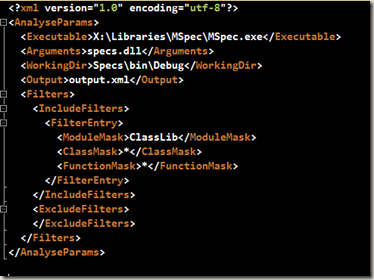
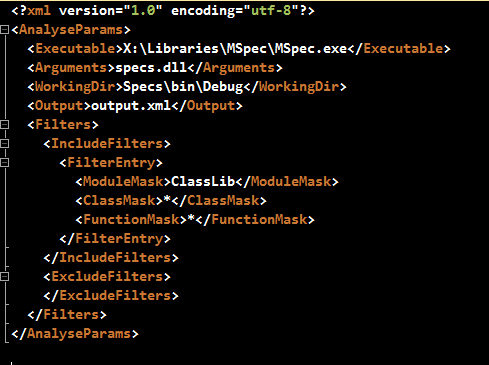
- Exclude everything that’s not specifically in the Include section. This is done by leaving an ExcludeFilter section blank and placing what we want covered in the IncludeFilter:
Based on the needs and depending on which of the two lists (Include or Exclude) are smaller, we can opt for option 1 or 2. The ouput should now be filtered:
Giving it some style
Only thing left to do is to format the output so that it can be viewed nicely inside a browser. This can be done easily using XSLT and some appropriate design skills (something I lack).
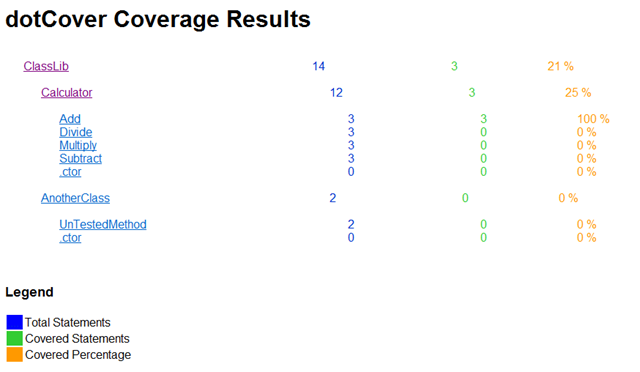
Included in the project you have an XSLT to create some HTML as well as one to covert the XML to JSON. Having JSON output allows us to combine it with something like jQuery to display a nice treeview or grid with the results.


