.NET Tools
Essential productivity kit for .NET and game developers
Using NuGet to simplify remote profiling with dotTrace
IMPORTANT: The information in this post is relevant only for dotTrace 5.2 and 5.3. For the later dotTrace versions, SDK is available only as a zip archive with SDK assemblies.
We’ve all been there, someone calls you about the fact that the application is slow. No matter how hard you try, it’s impossible to reproduce the issue on your development machine: the issue only occurs in production. What do you do?
dotTrace makes it really easy to attach a profiler to a remote application. We’re now providing a NuGet package which makes it even easier to get your production application profiled.
Step 1: Install-Package dotTrace.Performance.Remote
Using the Package Manager Console or by using the Manage NuGet Packages dialog, you will be able to install the dotTrace Performance NuGet package into your project.
This NuGet package will verify if you have dotTrace installed on your system. If that’s not the case, it will ask you if you want to download a trial version from the JetBrains website.
The NuGet Package generates the files required for remote profiling from the instance of dotTrace installed on the computer, which varies based on the version. All this is done automatically, but it does require that you have dotTrace installed. Note that the NuGet package currently works with dotTrace Performance 5.2 and 5.3 EAP.
Step 2: Enable-DotTrace
In the Package Manager Console within Visual Studio, we’re adding two commands:
- Enable-DotTrace, which configures your application for profiling with dotTrace
- Disable-DotTrace, which removes the profiler assemblies from your application
To profile your application, simply invoke Enable-DotTrace:
After invoking this command, you will see some assemblies being added to your project. You can now deploy this application to production and start profiling.
Step 3: Profile application
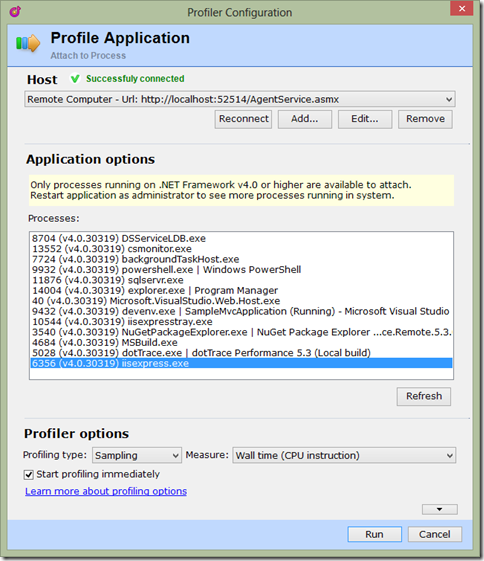
Once you’ve deployed your application, it’s easy to attach dotTrace Performance to it remotely. The only thing you need is the URL where it lives. Simply attach to a remote application and specify the URL, e.g. http://myapp.prod.example.org/AgentService.asmx.
After connecting to the remote profiler, simply attach dotTrace Performance to the process you wish to profile.
Once attached to the remote process, you can work with dotTrace the way you are used to working with it: get a snapshot and analyze the results. After determining the root cause and deploying a fix, you can repeat the process to collect another snapshot and verify that you have resolved the performance problem.


