.NET Tools
Essential productivity kit for .NET and game developers
TeamCity plugin for Visual Studio
When working with TeamCity and Visual Studio, we can do a lot of things right from within our IDE. We can trigger a remote run, fetch dotCover code coverage information from the server, view changes and builds from a tool window, navigate to unit tests and a lot more. In this post, we’ll be looking at some of these features. But first things first: let’s install this nifty tool!
Installing the plugin
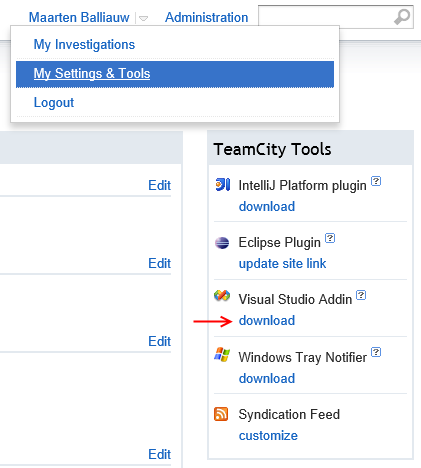
Every TeamCity installation ships with several tools for IDE integration (with our IntelliJ IDEA based tools as well as with Visual Studio). We can find the plugin on every TeamCity server under the My Settings & Tools page. We can download the plugin right there!
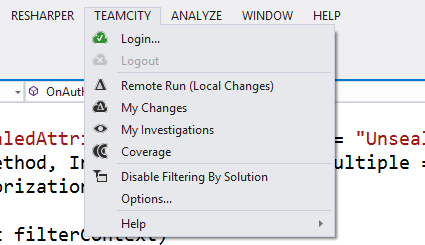
After downloading and installing the plugin, we can find a new menu item in our Visual Studio.
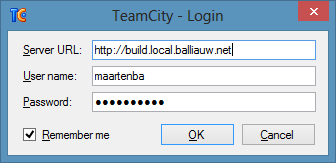
From this menu, we can connect to our TeamCity server using the Login… menu item. After entering the URL to our TeamCity server and providing the correct credentials, we can start exploring.
Remote run from Visual Studio
When developing a project in Visual Studio, we can initiate a personal build using the TeamCity plugin for Visual Studio. We call this a “remote run” because the build that is triggered runs on a TeamCity build agent, not on the developer’s machine. The interesting thing here is that this remote build uses the current version control repository sources plus the changed files in the developer’s IDE. All steps from the build configuration are executed for this personal build as well.
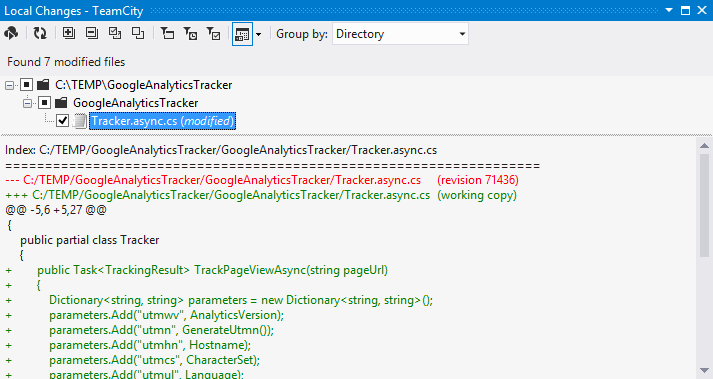
After changing some files locally, we can use the TeamCity | Remote Run (Local Changes) menu to trigger a remote build. In the dialog that opens, we can select the changes we made locally that should be included in this personal build. We can select all changes or cherry-pick just the changes we want to verify on the build server.
Note that we’re using Subversion as the source control system here. Remote Run is available for TFS, Subversion and Perforce. When using Git or Mercurial, the workflow is slightly different. Check the documentation on branch remote run for more information.
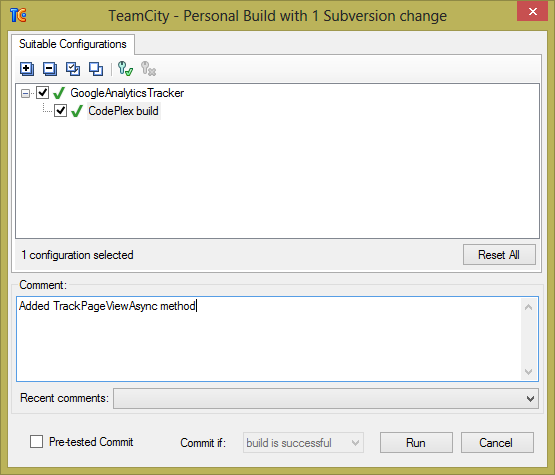
When we click the Configure personal build… icon in the toolbar, we have to make some other decisions. First of all, we must select the build configuration we want to use for the personal build. Next, we can provide a comment for this personal build. This comment will be shown in the TeamCity web UI afterwards to describe the personal build.
One interesting option is the Pre-tested Commit checkbox and its related commit if setting. Using this, submitted code changes first go through testing. If all tests pass, TeamCity will automatically commit the changes to version control and integrate it in the next build. When tests fail, the code is not committed and the developer who made the change is notified about this. Here’s a chart of the pre-tested commit workflow.
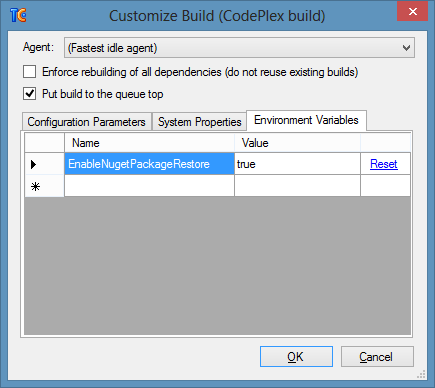
We can even customize our build: put it at the top of the queue or add additional build parameters.
After clicking the Run button, TeamCity will run the selected build configuration for the included changes. We can see the results in the TeamCity web UI, consult the build log, check unit test results and so on.
My Changes
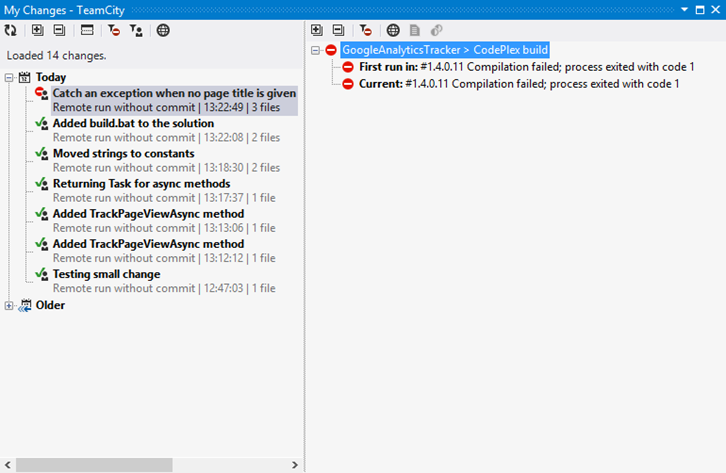
Since this post is about the TeamCity plugin for Visual Studio, we can also verify the status of builds triggered because of our changes by using the TeamCity | My Changes menu.
Build log
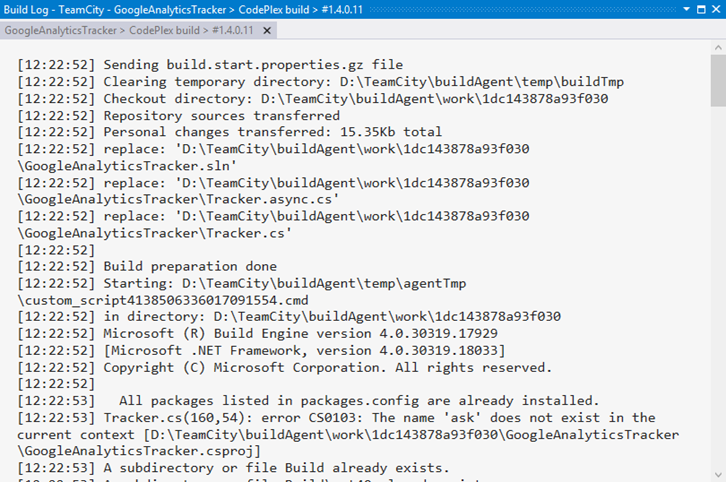
From the toolbar, we can consult the build log for every personal build listed in the My Changes window. Clicking the Show Build Log icon (or right-clicking the build and selecting the appropriate context menu) will instruct the TeamCity plugin for Visual Studio to download the build log directly from TeamCity.
Open Failed Tests
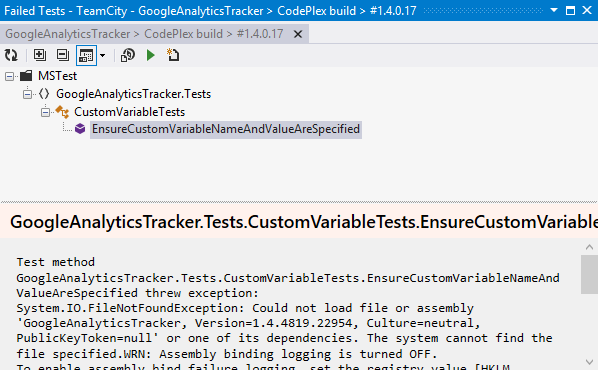
Did your changes cause a unit test to fail? No worries: we can use the Open Failed Tests context menu from the My Changes window in order to see what is going on. From the window that opens we can re-run the failing tests locally using the ReSharper test runner.
Code Coverage
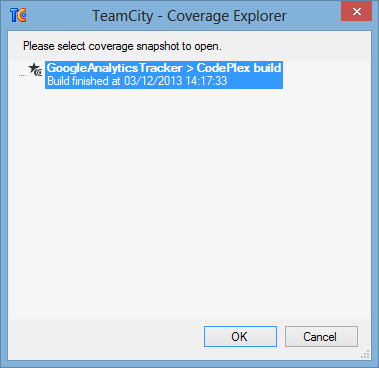
When you have dotCover installed on your machine, the TeamCity plugin for Visual Studio enables us to view code coverage results. Using the TeamCity | Coverage menu item we can select a code coverage snapshot to open.
After selecting and opening a snapshot, we get dotCover’s test runner showing code coverage. We can even double-click a class from the snapshot shown and explore code coverage at the statement level.
Investigate a build
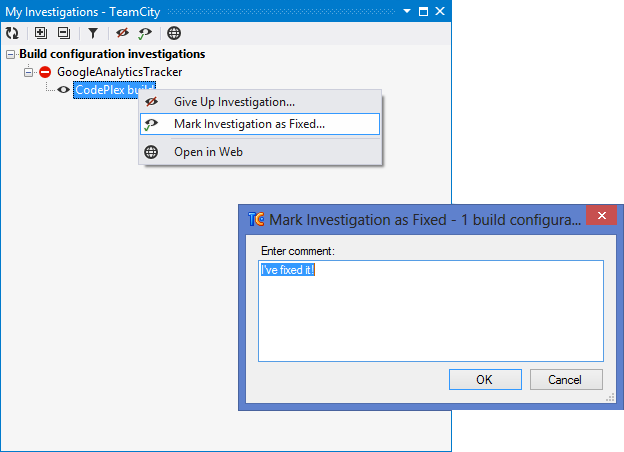
Whenever a build fails, we can volunteer to fix the build by starting an investigation. From the TeamCity | My Investigations menu, we can manage our investigations and take action on open investigations by either fixing it or giving up (when working in developer teams in Belgium, that last option typically results in having to bring pastries for the team).
Open in IDE
The TeamCity web UI features an Open in IDE button on many places. For example, when inspecting changes that were included in a build, we can open the file that was built in our IDE by clicking the IDE icon.
We can open tests in the IDE as well, again using the Open in IDE function. When working with tests, this will trigger Visual Studio to open the ReSharper test runner and display the selected test.
Give the TeamCity plugin for Visual Studio a go and let us know what you think!

