Architecture Tools in ReSharper 8

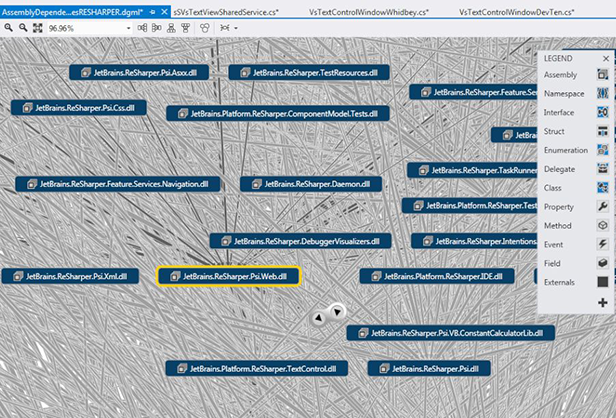
Like many people with very large Visual Studio projects, we in the ReSharper team wanted to get an overview of the 300+ project dependencies for ReSharper itself. Unfortunately, VS Ultimate gave us a representation that was rather difficult to interpret:
What we ended up doing is building our own tool for viewing project dependencies as well as comparing architectural snapshots as the solution continues to change and evolve.
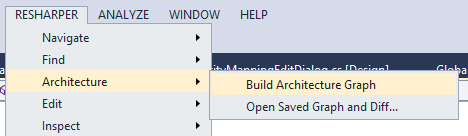
Here’s how it works. First of all, with your solution open, go to ReSharper|Architecture|Build Architecture Graph:
ReSharper then goes through your solution and, without compiling anything, presents a dependency diagram of all the projects in the solution:
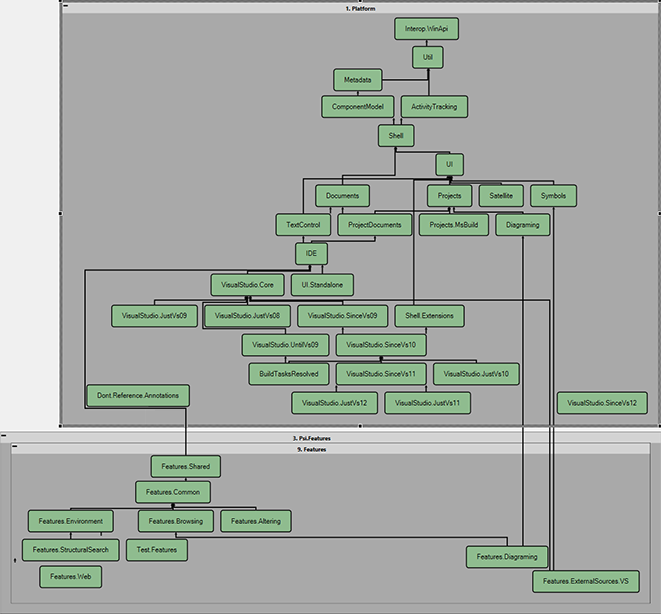
The great thing about the way R# does it is the fact that layout is calculated automatically to present an optimal illustration of dependencies between elements. ReSharper builds the dependency graph, and if the Show Code Metrics option is on (it is on by default) then reference analysis happens asynchronously — ReSharper analyzes the whole solution and indicates the strength of coupling between projects. This all happens on the background thread, so you can continue editing code, navigating etc. while ReSharper does its work.
There are two arrows linking the projects: black arrows show project references wheras grey arrows show unused references that can be safely removed without breaking the build.
The architecture diagram gets rendered for the scope you’ve selected in Solution Explorer: if you select just a folder with several projects, only those projects will be included. However, there is always a way to fine-tune which projects are represented by checking the appropriate boxes:
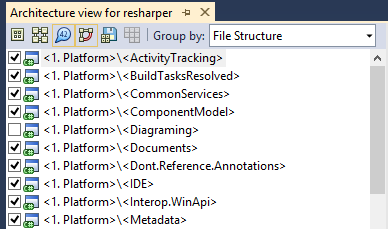
Ticking each of the boxes shows or hides the appropriate elements on the diagram. This allows us to instantly update the representation of connections between different subsystems as soon as they are checked or unchecked in the list on the left.
The toolbar shown above has several options for how information is presented on the graph. First of all, there are several ways of grouping information:
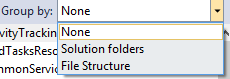
The above options are None (meaning no grouping is done), Solution folders for grouping by solution folder, and File structure for groupings based on actual directory structure and the projects’ position therein.
The following toolbar buttons are also available:
-
Collapse Graph and Expand Graph buttons let you collapse or expand an area where a grouping is used. A collapsed group looks simply like this:

As an alternative, one can simply double-click the + or - button on the group to expand or collapse it. -
The Show/Hide Code Metrics button lets you show and hide metrics associated with the code. These metrics show used and unused references (black and grey arrows respectively) and also show the number of references from one project to another:

You can also select the indicator, right-click it and use Show Usages… to find out where these referencing calls actually occur.
-
Show Transitive References shows not only direct references but actually all transit references, so in addition to showing A → B → C, it will also show A → C on the diagram. This can lead to a very rich, circuit-like representation:

-
Save Architecture Graph lets you save the graph to a file.
-
Show Diff shows you a difference between two architecture graphs. In fact, you can also invoke this function (even without having a solution open) from the top-level menu:

The ability to save architecture graphs to a file allows the user to look at the difference between the architectural layout of the solution as it continues to evolve. The following illustrates the changes that have been made to a solution:
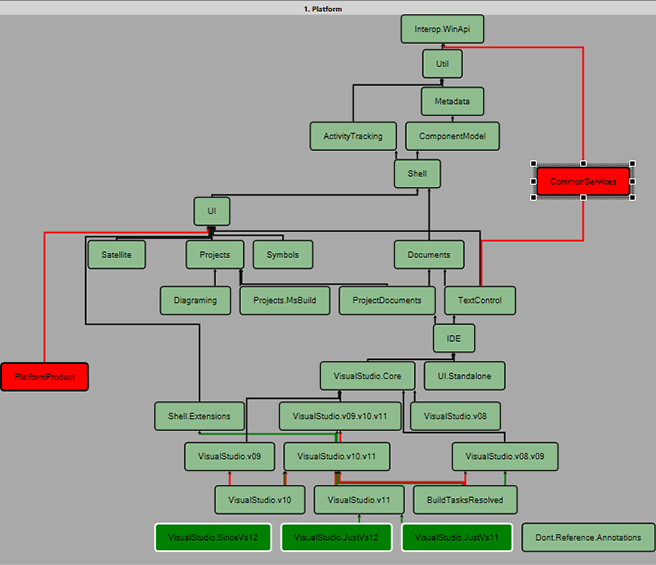
The above is an illustration of the evolution in one of ReSharper’s subsystems. Red boxes indicate parts that have been removed, whereas dark green ones indicate new parts that have been added. The same color scheme is also applied to references.
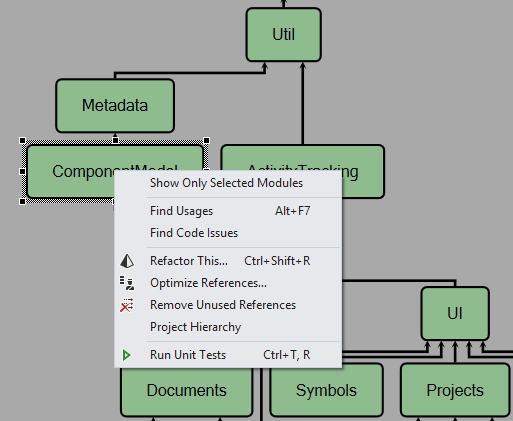
Lastly, keep in mind that project-level menus which can be invoked in Solution Explorer can be invoked on Architecture View nodes in the same manner:
As always, we hope that you find this feature useful — it is already in the latest EAP, so if you want to see it today, you know what to do. Keep in mind that this is a very fresh tool that we’ve built, and one that we’ll be sure to augment with additional architecture-related features in future releases.
Subscribe to a monthly digest curated from the .NET Tools blog:


