.NET Tools
Essential productivity kit for .NET and game developers
Boost Code Quality with Qodana and GitHub Actions

It’s been roughly half a year since we introduced Qodana to .NET in our blog post about how to elevate your C# code quality with Qodana. Since then, we’ve been quite busy! Qodana went out of preview and into GA. Furthermore, we greatly improved the integration with our IDEs, providing an effortless Try Qodana experience directly on your local machine. We’ve also released a plugin for Visual Studio Code. And lastly, we’ve taken your feedback on board and started to discuss custom On-Premises plans with interested teams.
Still haven’t heard about Qodana? Our new code quality platform helps various stakeholders in your company improve code quality, comply with license requirements, spot security issues, and deliver a better product! In the realm of open source, Qodana has already proven to ensure and encourage qualitative pull requests.
In this blog post, we will dive deeper into the topic of integrating Qodana with your GitHub Actions infrastructure to maintain your team’s software engineering standards.
Setting up a Qodana Project
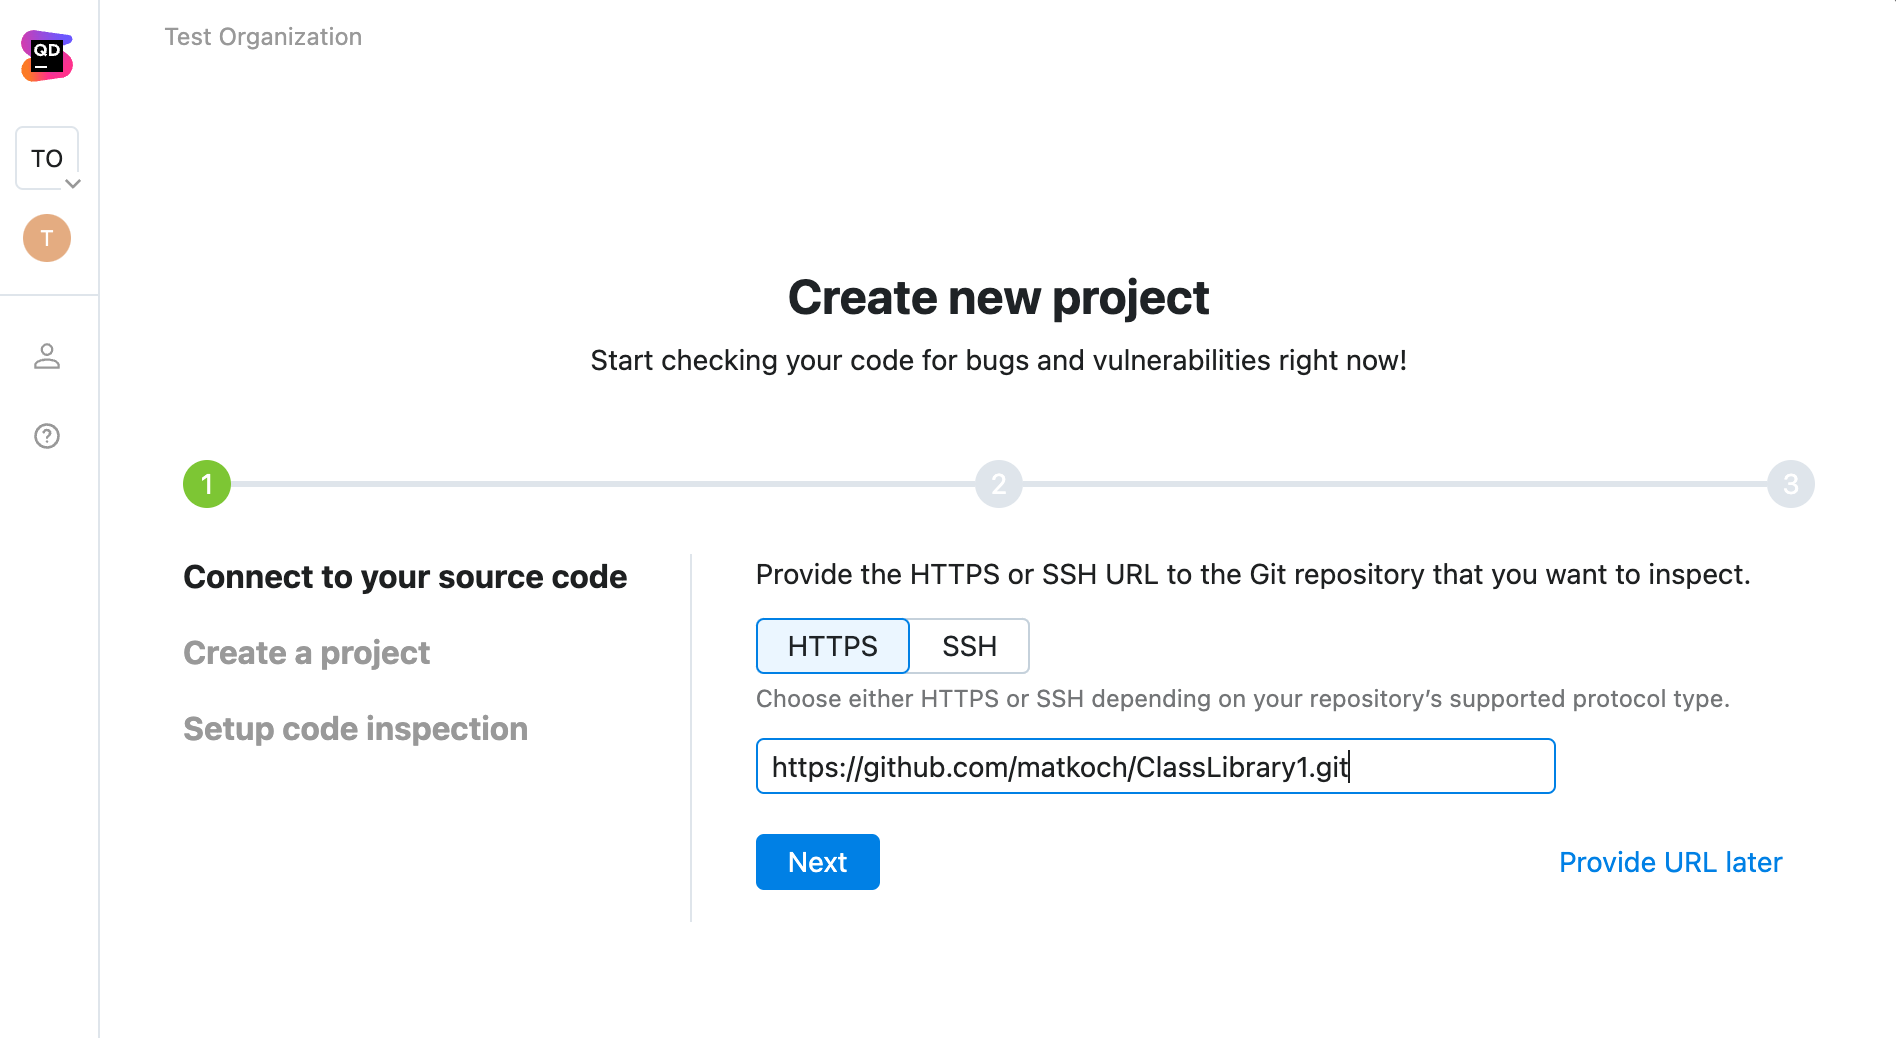
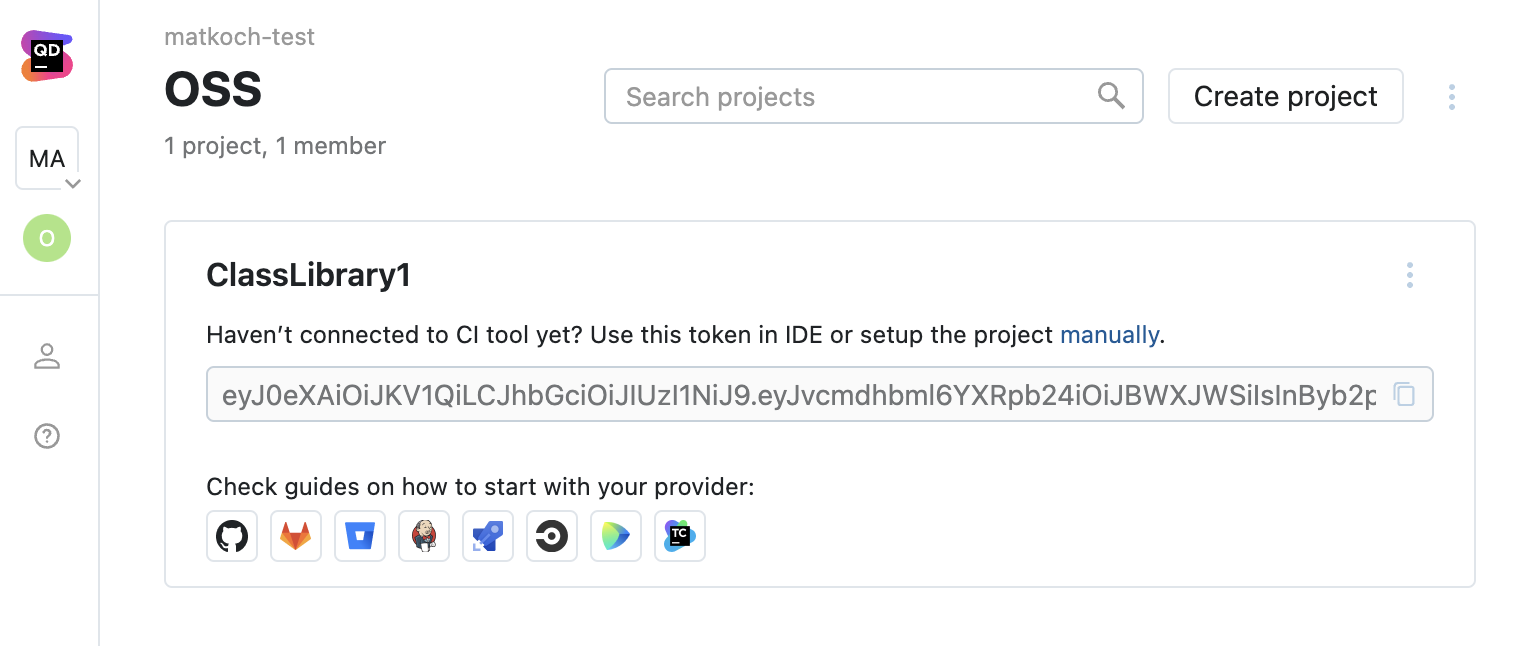
Head over to Qodana Cloud or your On-Premises solution, and create a new project that links to one of your GitHub repositories:
Once you’ve gone through all the setup steps, Qodana will present your personal access token:
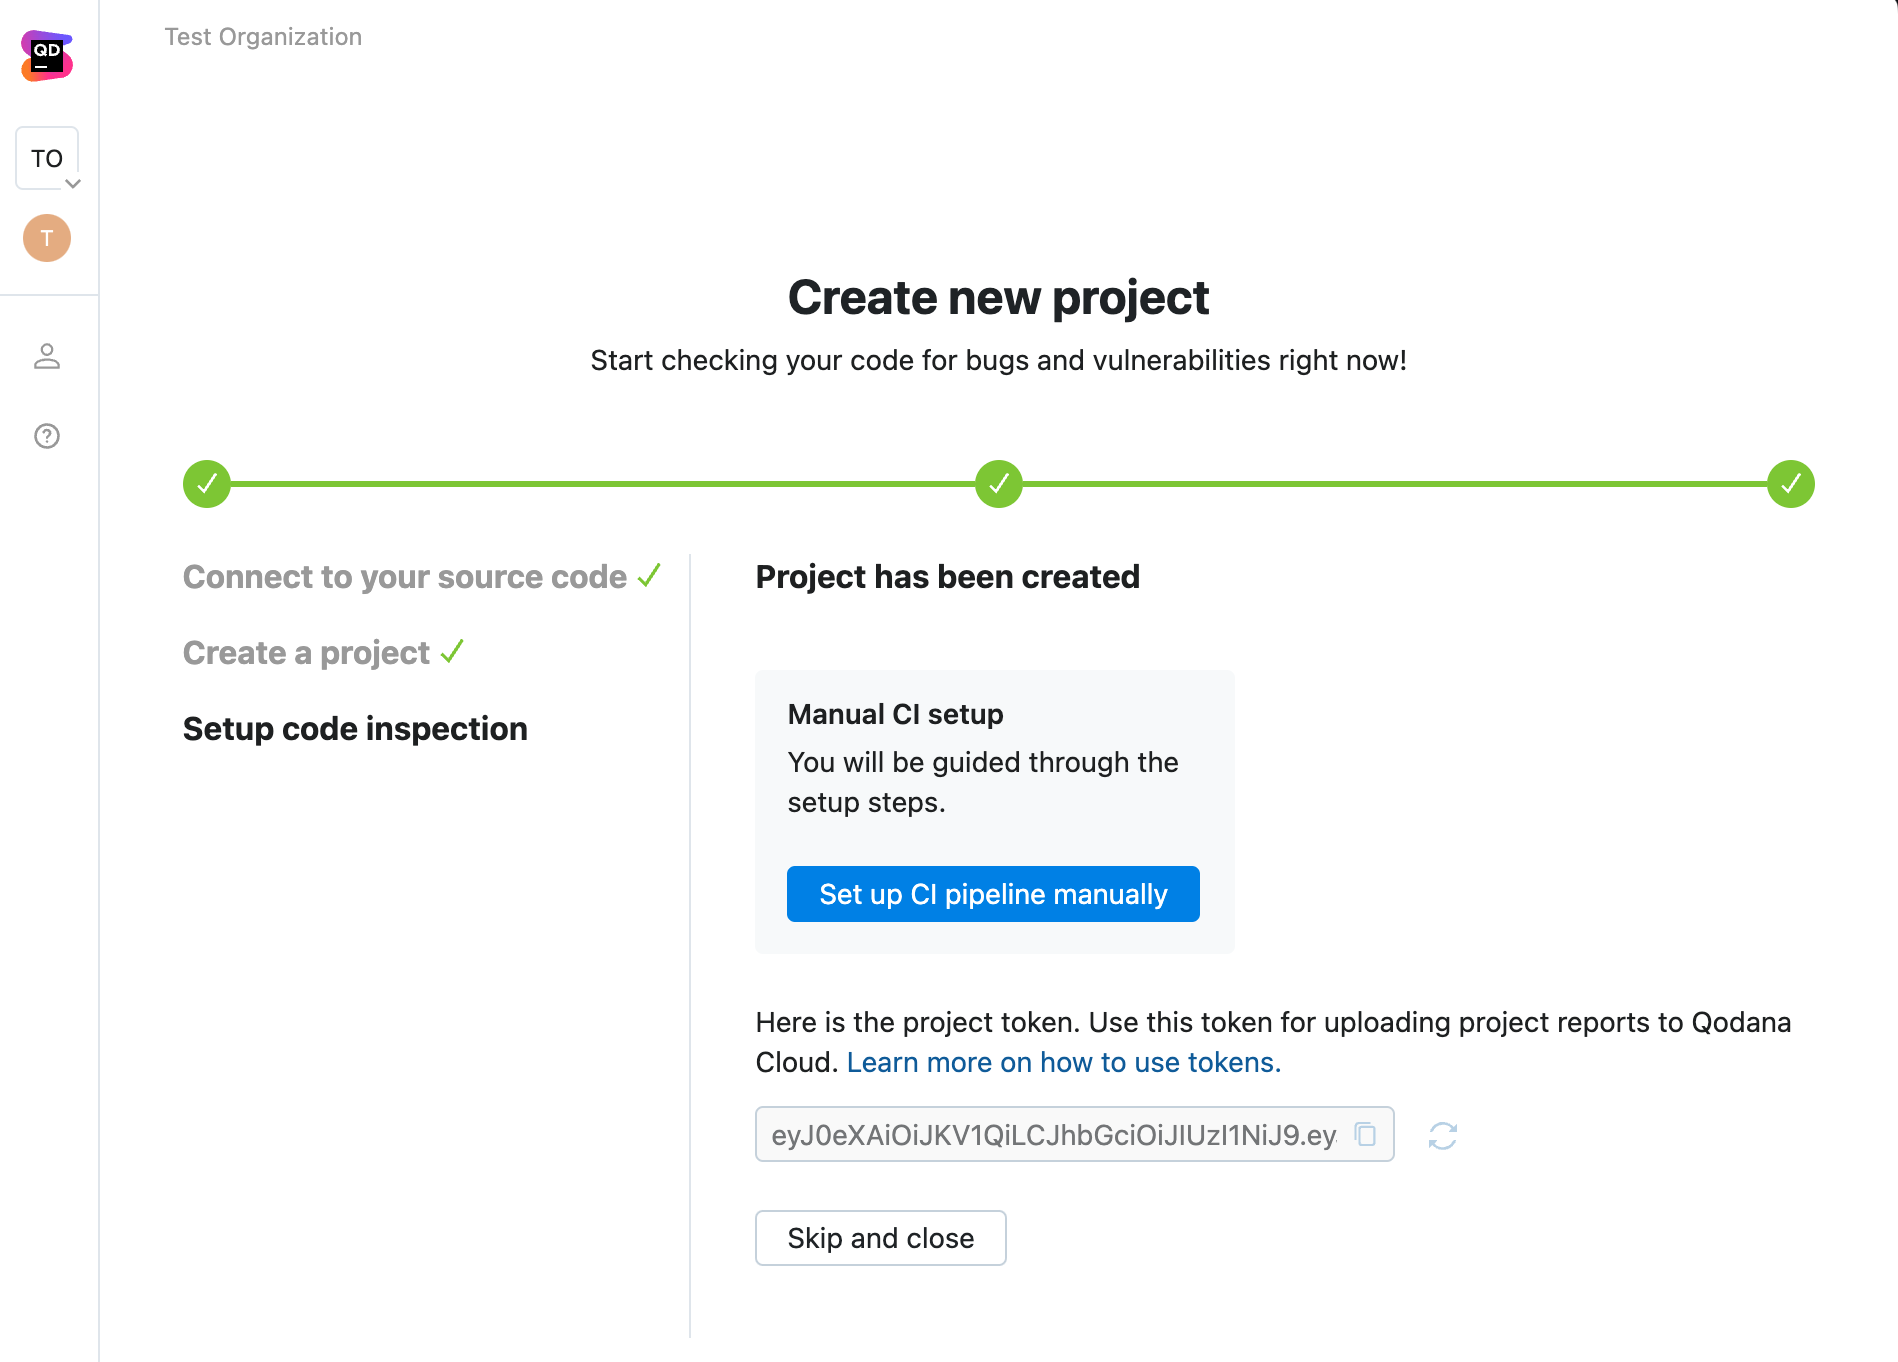
You can copy the Qodana token right away, but you’ll also get another chance while we’re setting up the configuration and workflow files in the next step!
Adding a GitHub Actions workflow file
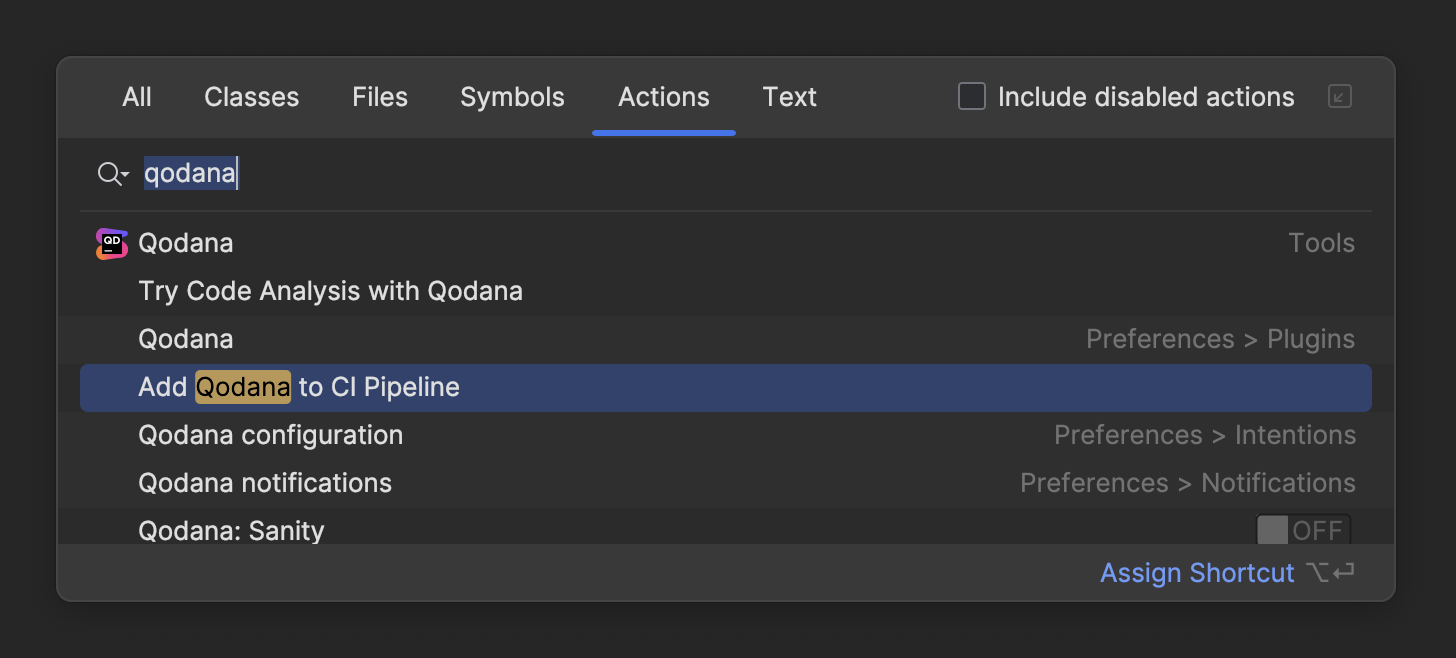
As already mentioned, our Qodana team has put a lot of effort into IDE integration and your first-time experience. Bring up the Search Everything popup and search for the Add Qodana to CI Pipeline action:
Assuming you haven’t tried Qodana yet, the dialog will first prompt you to add a qodana.yml file based on a template with standard defaults for your .NET solution:
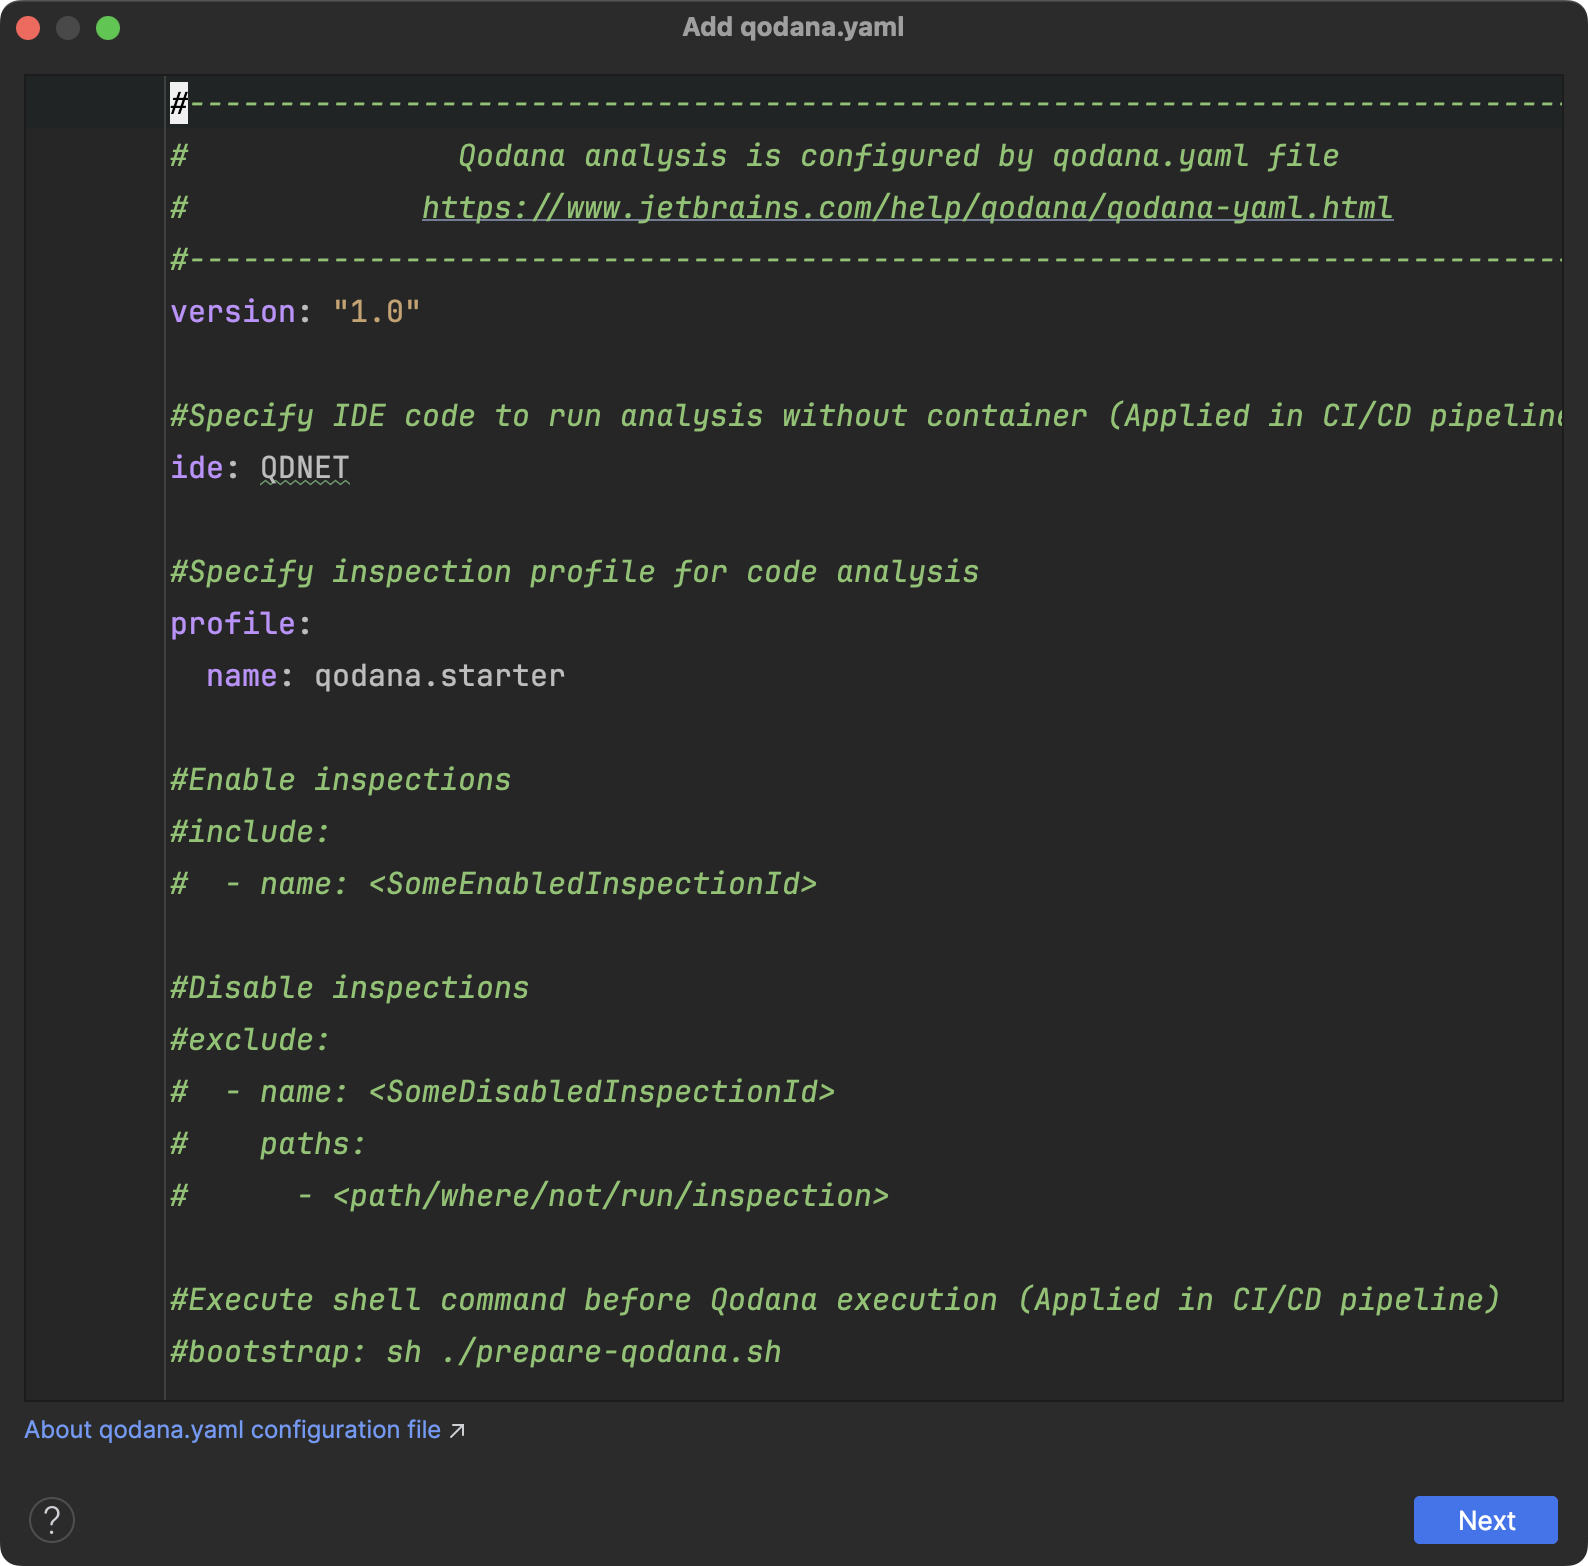
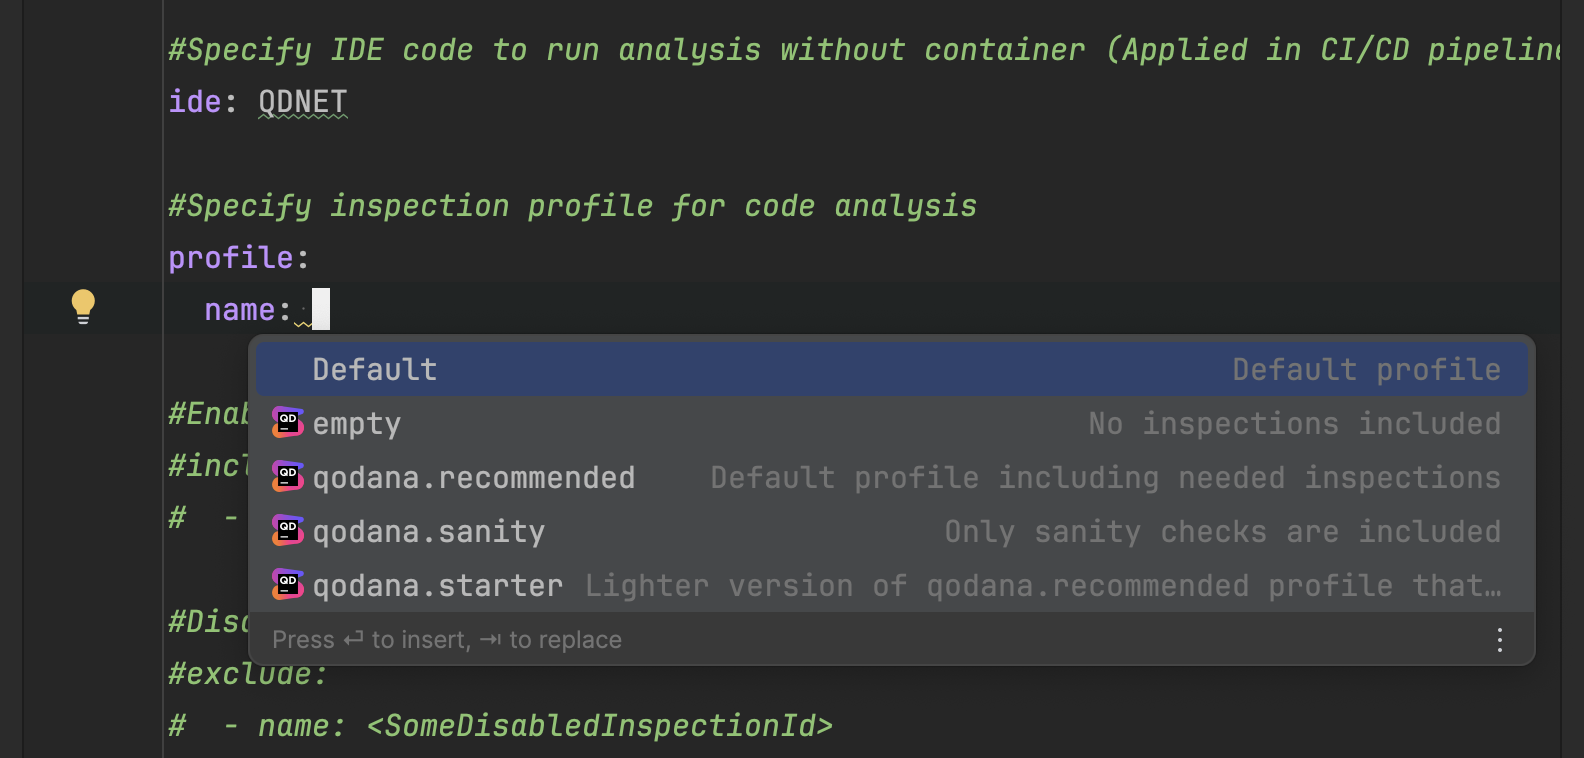
qodana.yml configuration fileFrom the colorization, you might have guessed it already, but this is not just a simple multiline textbox but rather an embedded editor with full YAML support! So you can take advantage of code completion, formatting, and validation when editing the file. For instance, you can see which inspection profiles are included out of the box:
qodana.ymlOnce you confirm the qodana.yml file, the wizard will continue with a list of all the major CI/CD services and tools. As you may have gathered, we’ll be focusing on Qodana’s integration with GitHub Actions in this blog post. The workflow template comes with all the most important bits, including when to trigger the analysis, how to checkout the repository (do not shallow clone!), the actual analysis invocation through qodana-action, and the QODANA_TOKEN as an environment variable:
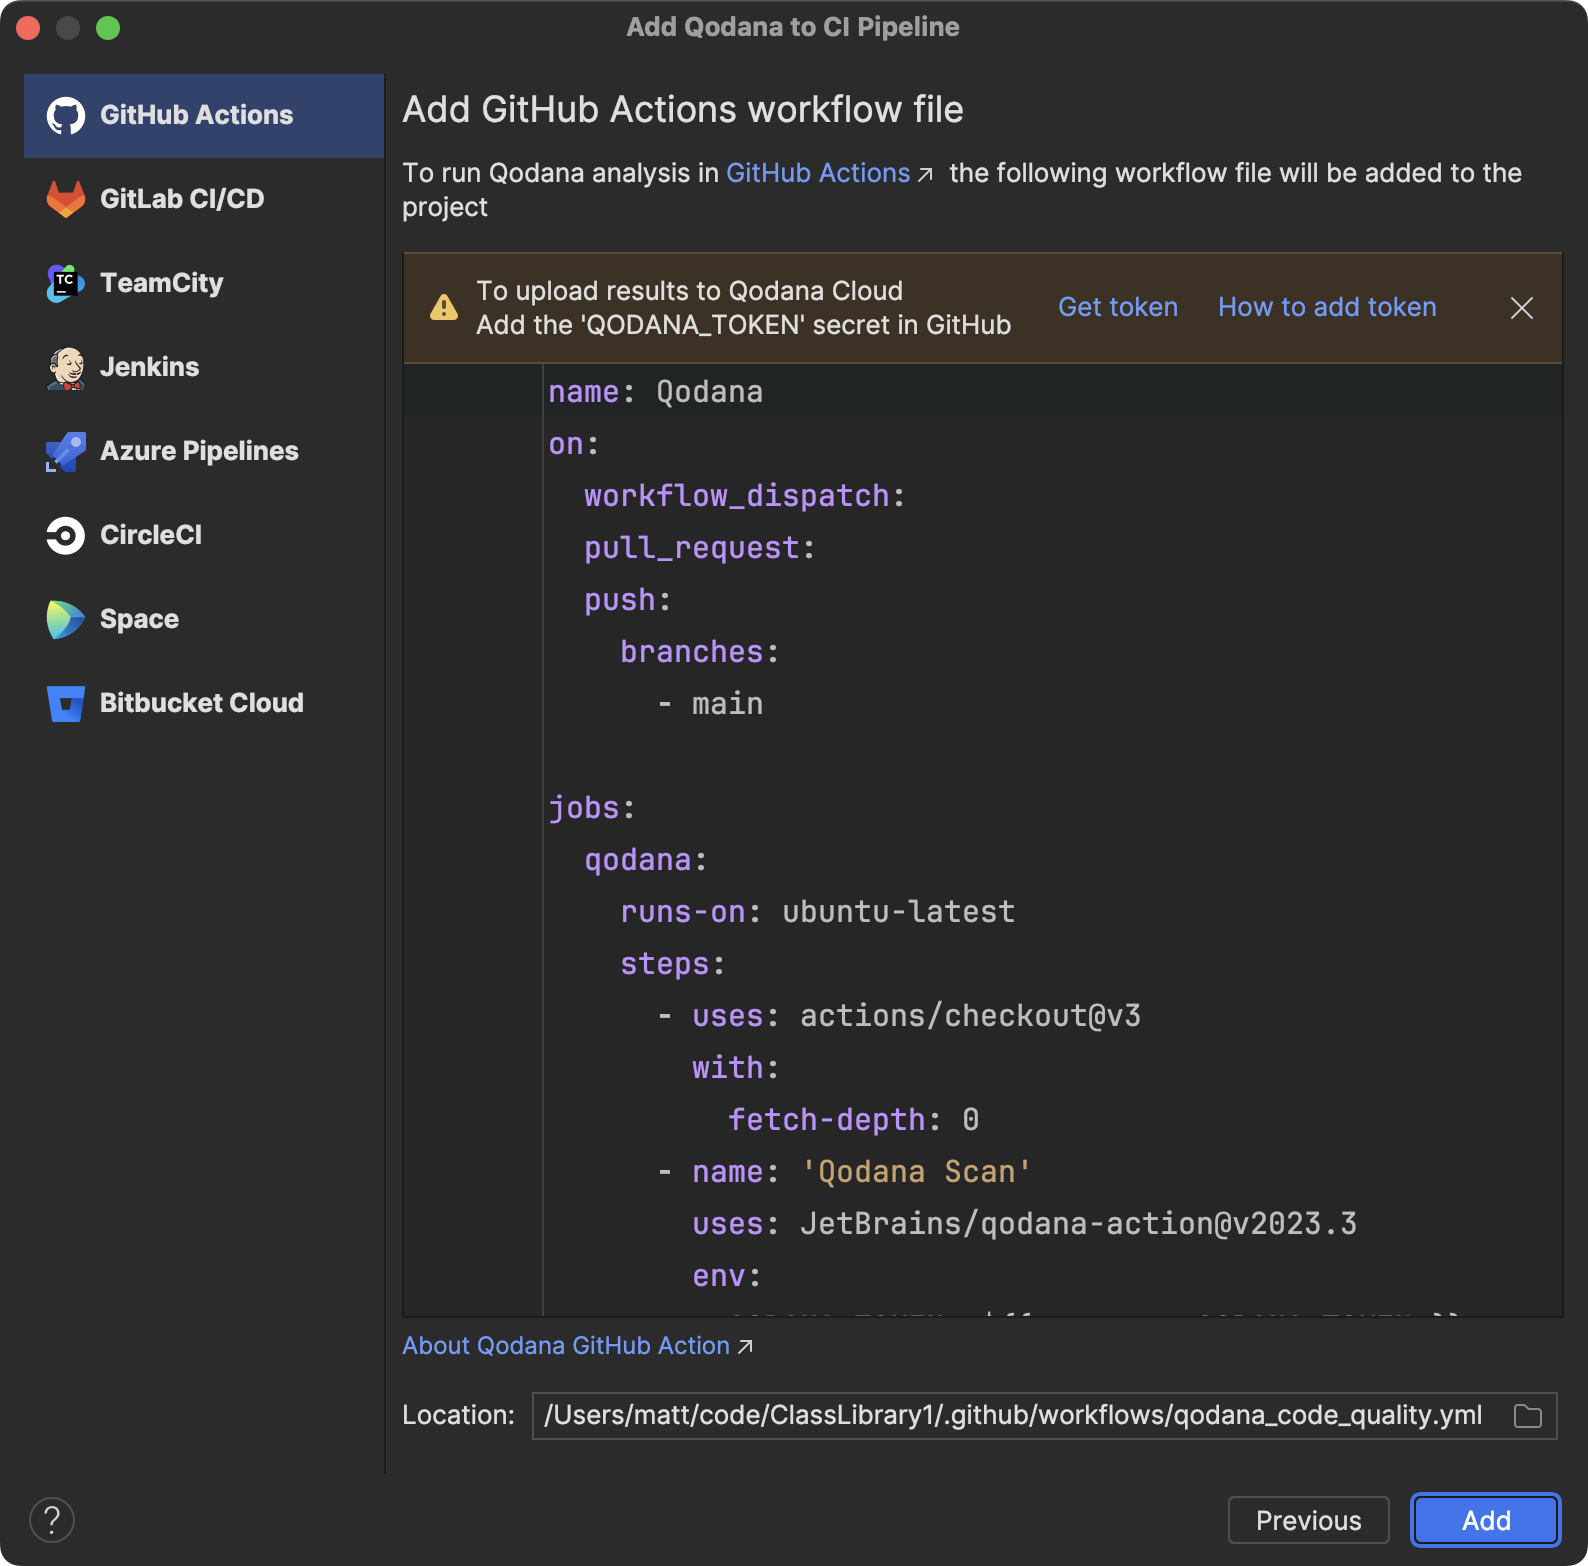
By default, the action will use the same version as the current version of your IDE. You can also change it to JetBrains/qodana-action@main to always use the latest version.
Before you confirm to add the qodana.yaml and workflow file to your repository, it’s a good idea to click the Get token link and grab the Qodana token for your project:
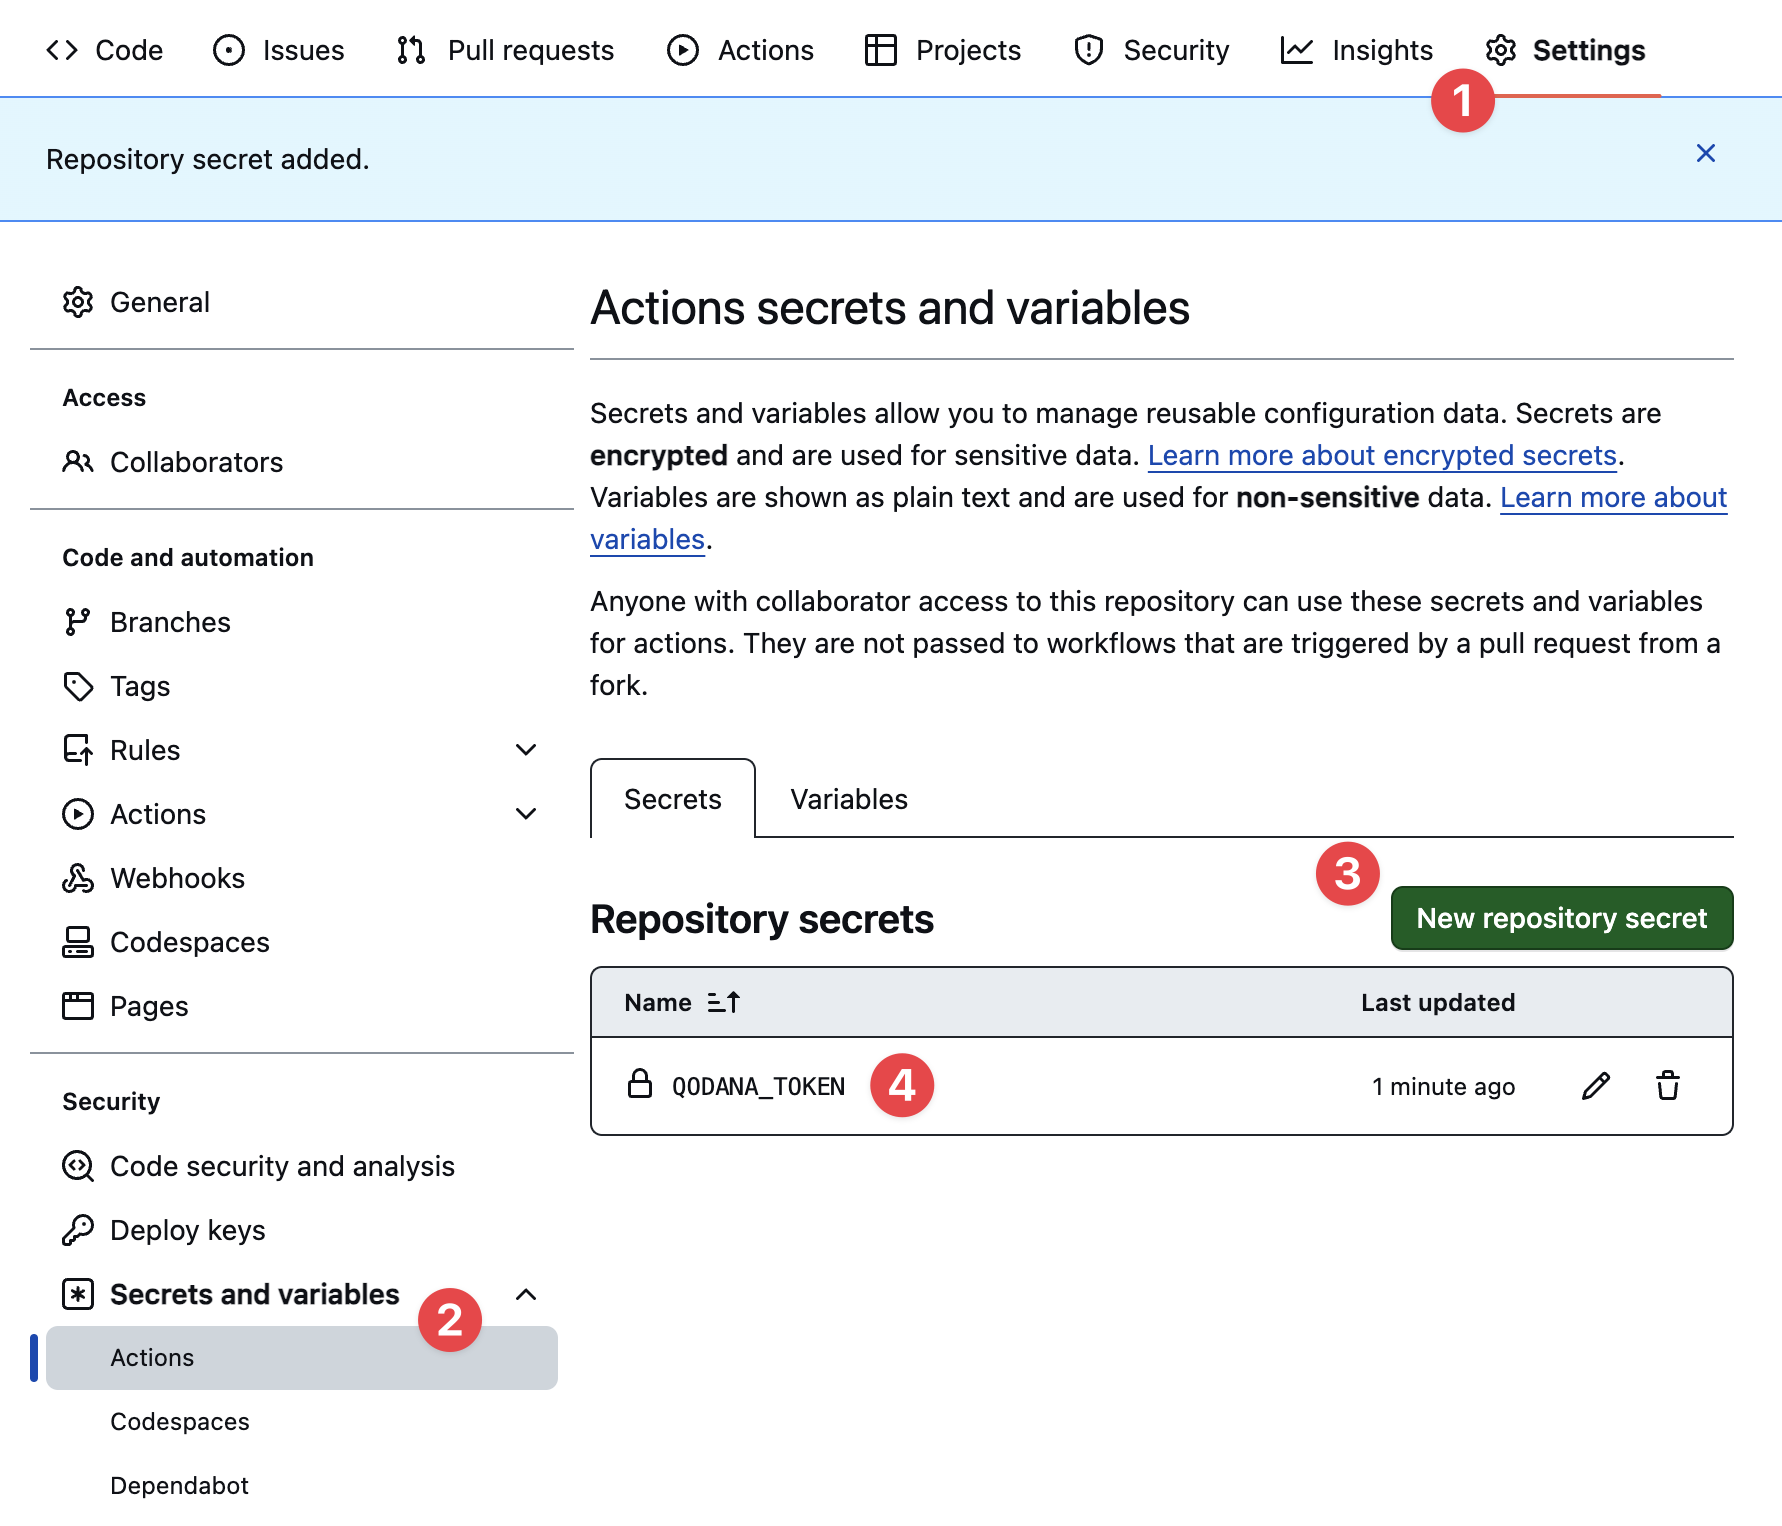
This QODANA_TOKEN needs to be added as a secret to your GitHub repository so that Qodana can upload analysis results to your Qodana Cloud or On-Premises solution:
Now you can finally confirm the Qodana wizard and push the qodana.yml and GitHub Actions workflow file to your repository:
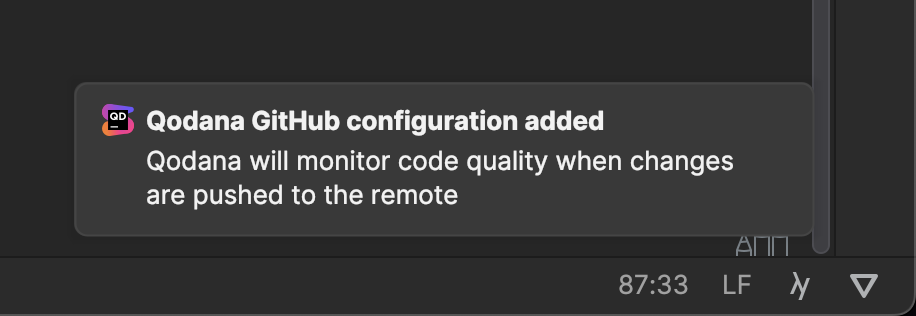
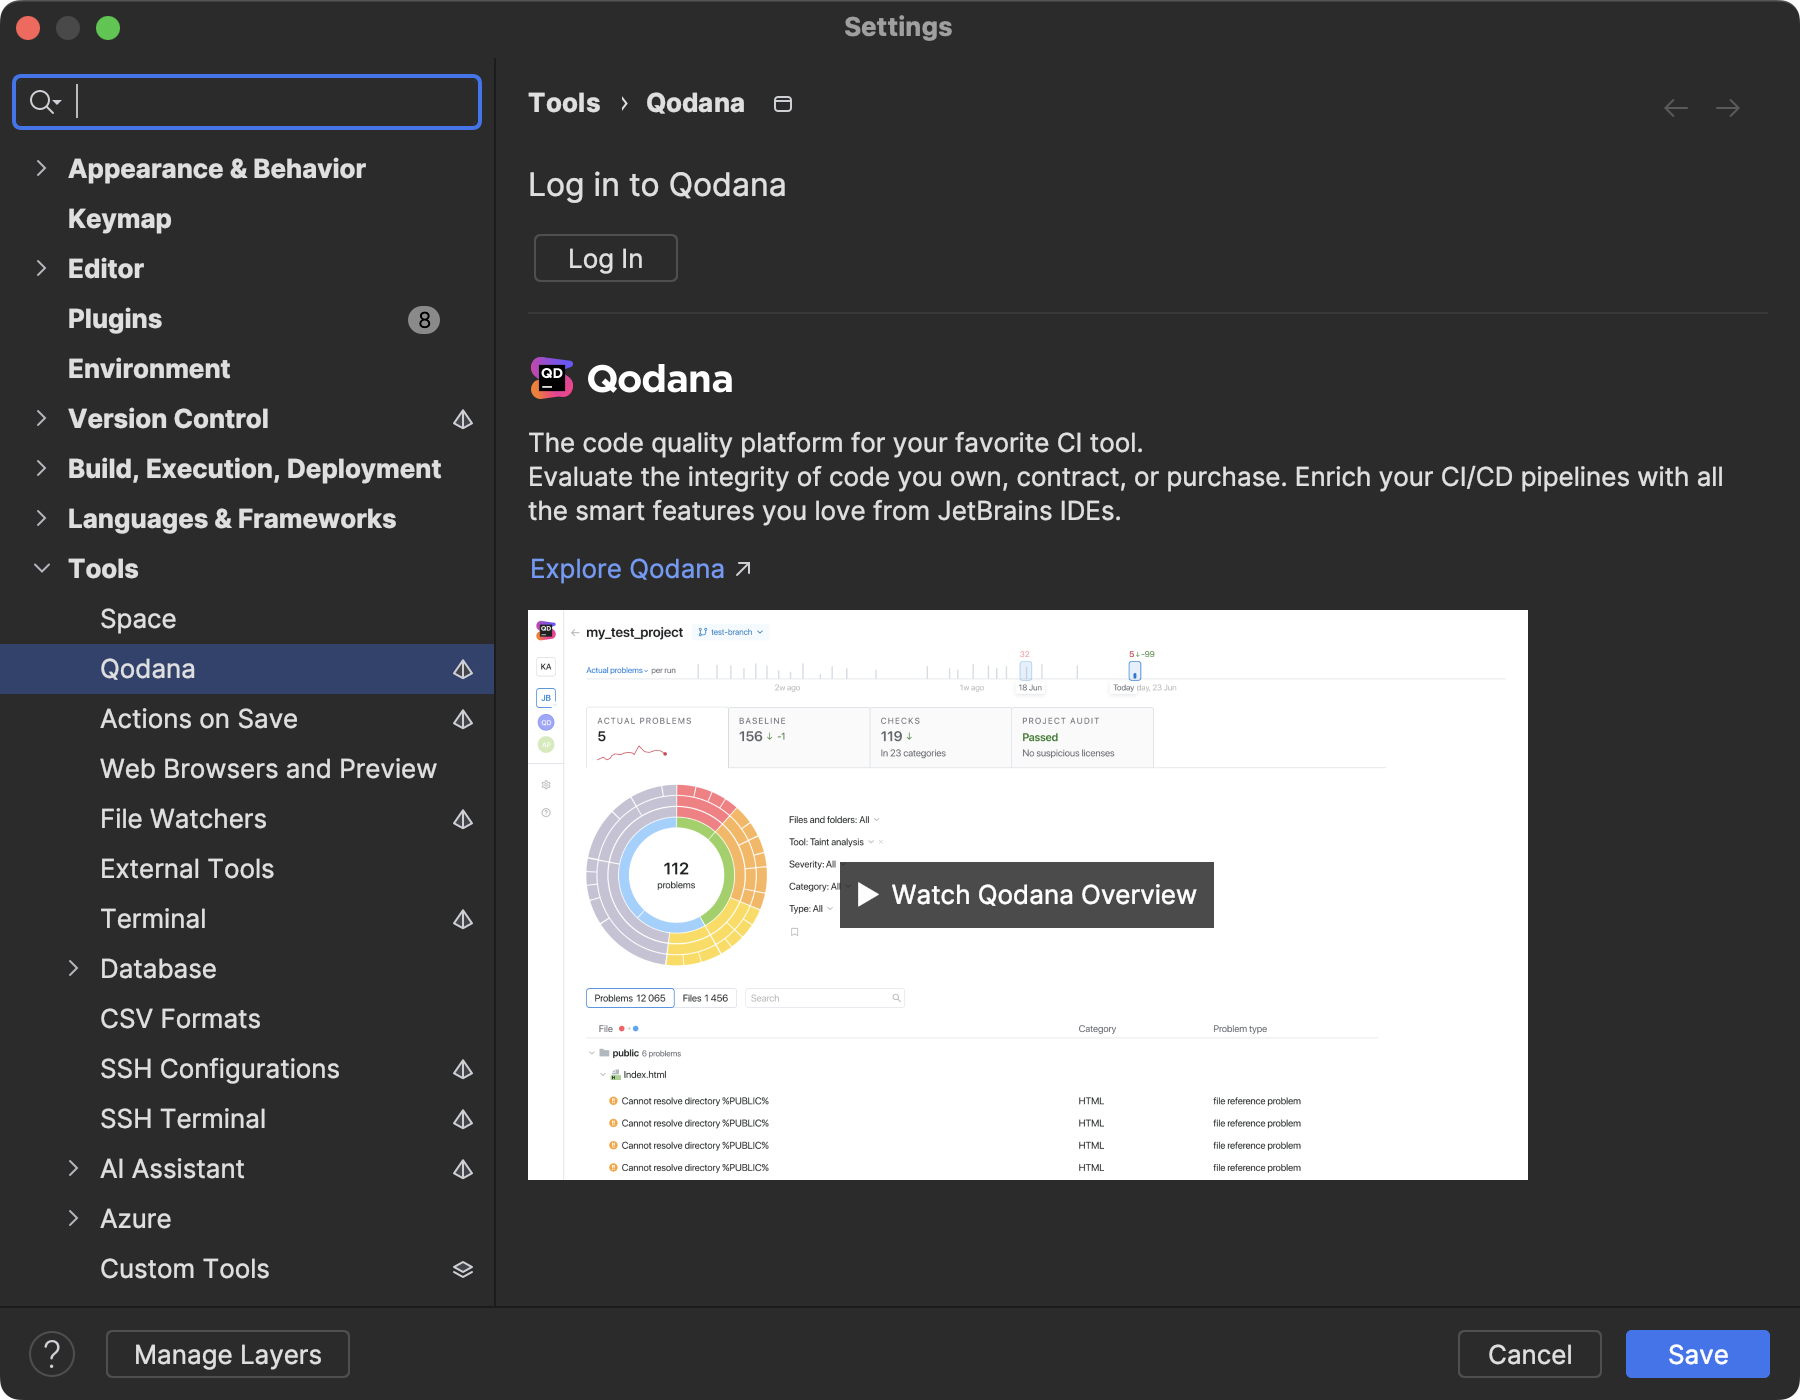
Your GitHub repository will take it from here and run the workflow through GitHub Actions. In the meantime, you might want to log in to Qodana in your IDE under Settings | Tools | Qodana so that we can download and inspect analysis results in the next part:
Get ready, we’re about to enter the really interesting part!
Inspecting Qodana results for GitHub Actions
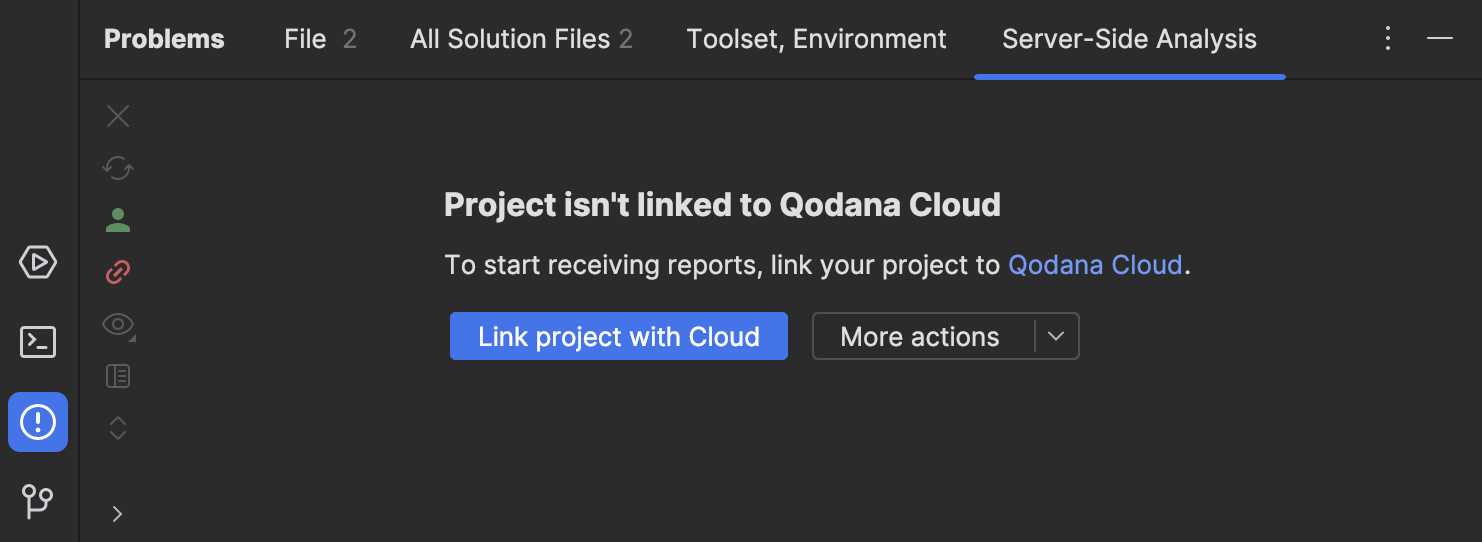
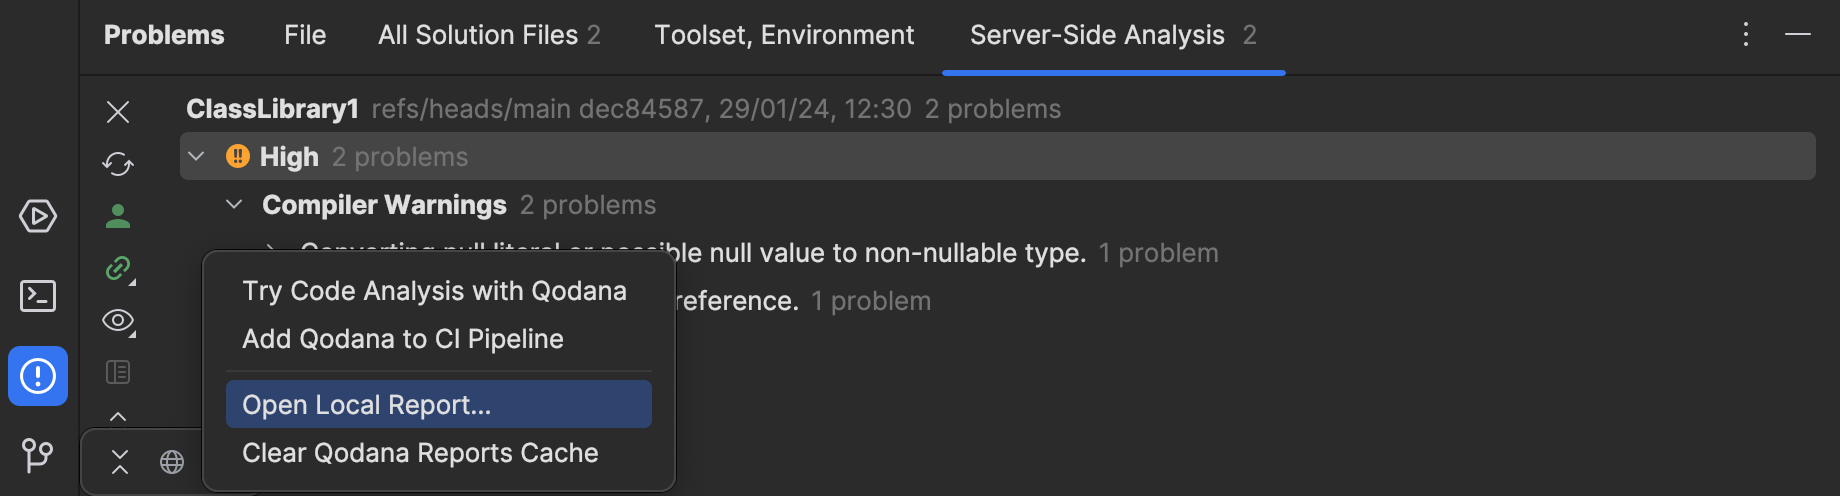
Before inspecting your first run results, you need to link the local repository to the Qodana project. Under the Problems tool window, you can find the Server-Side Analysis tab. If Qodana hasn’t linked your project automatically yet, you can perform this step manually from here:
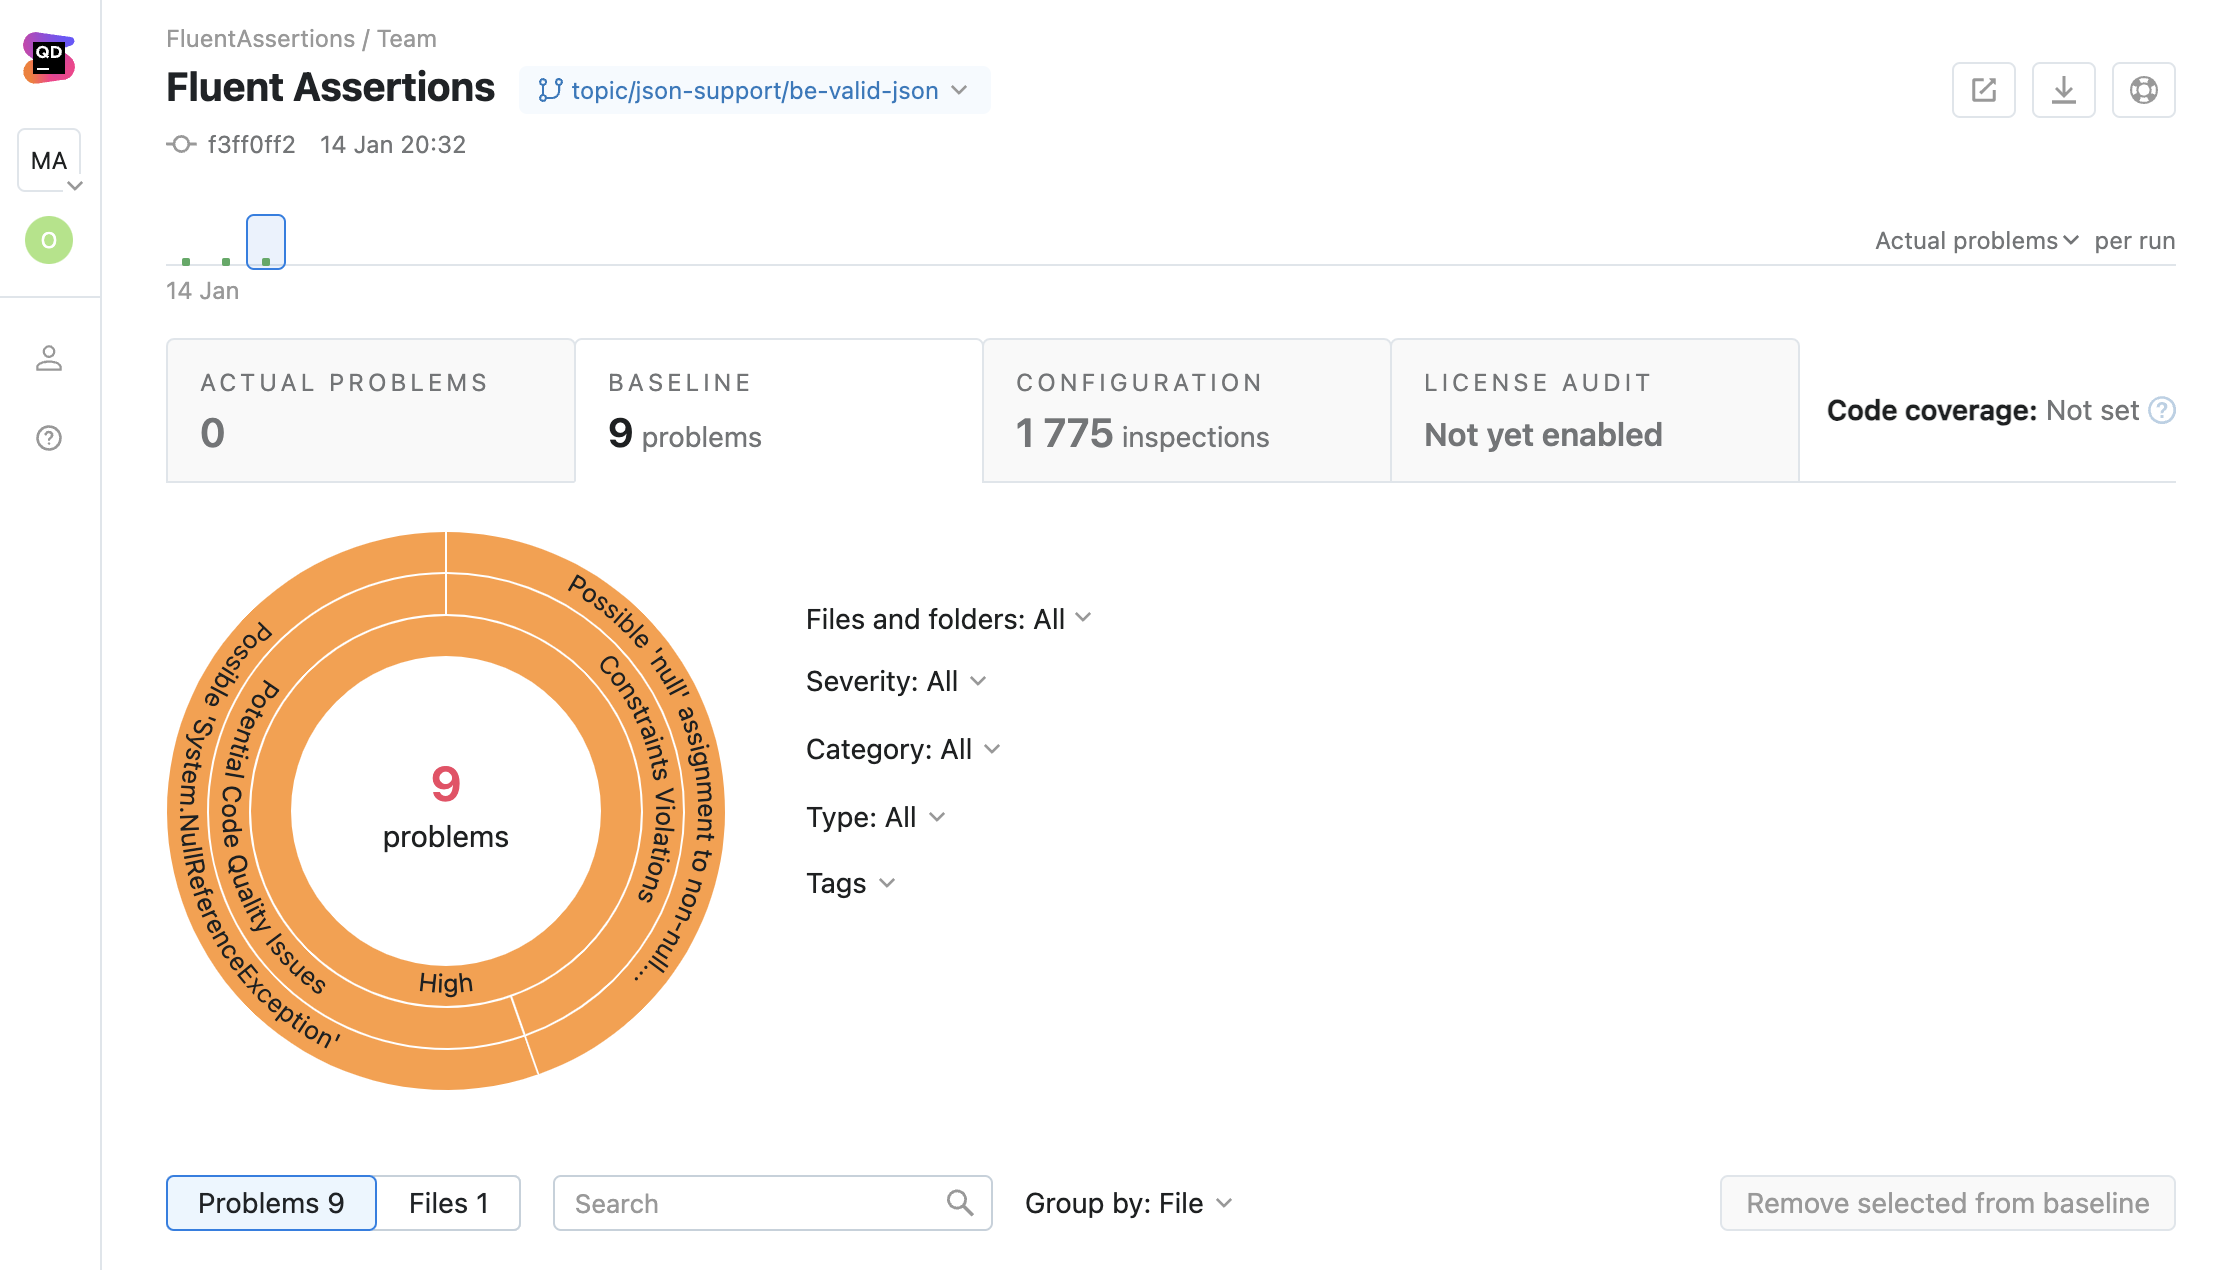
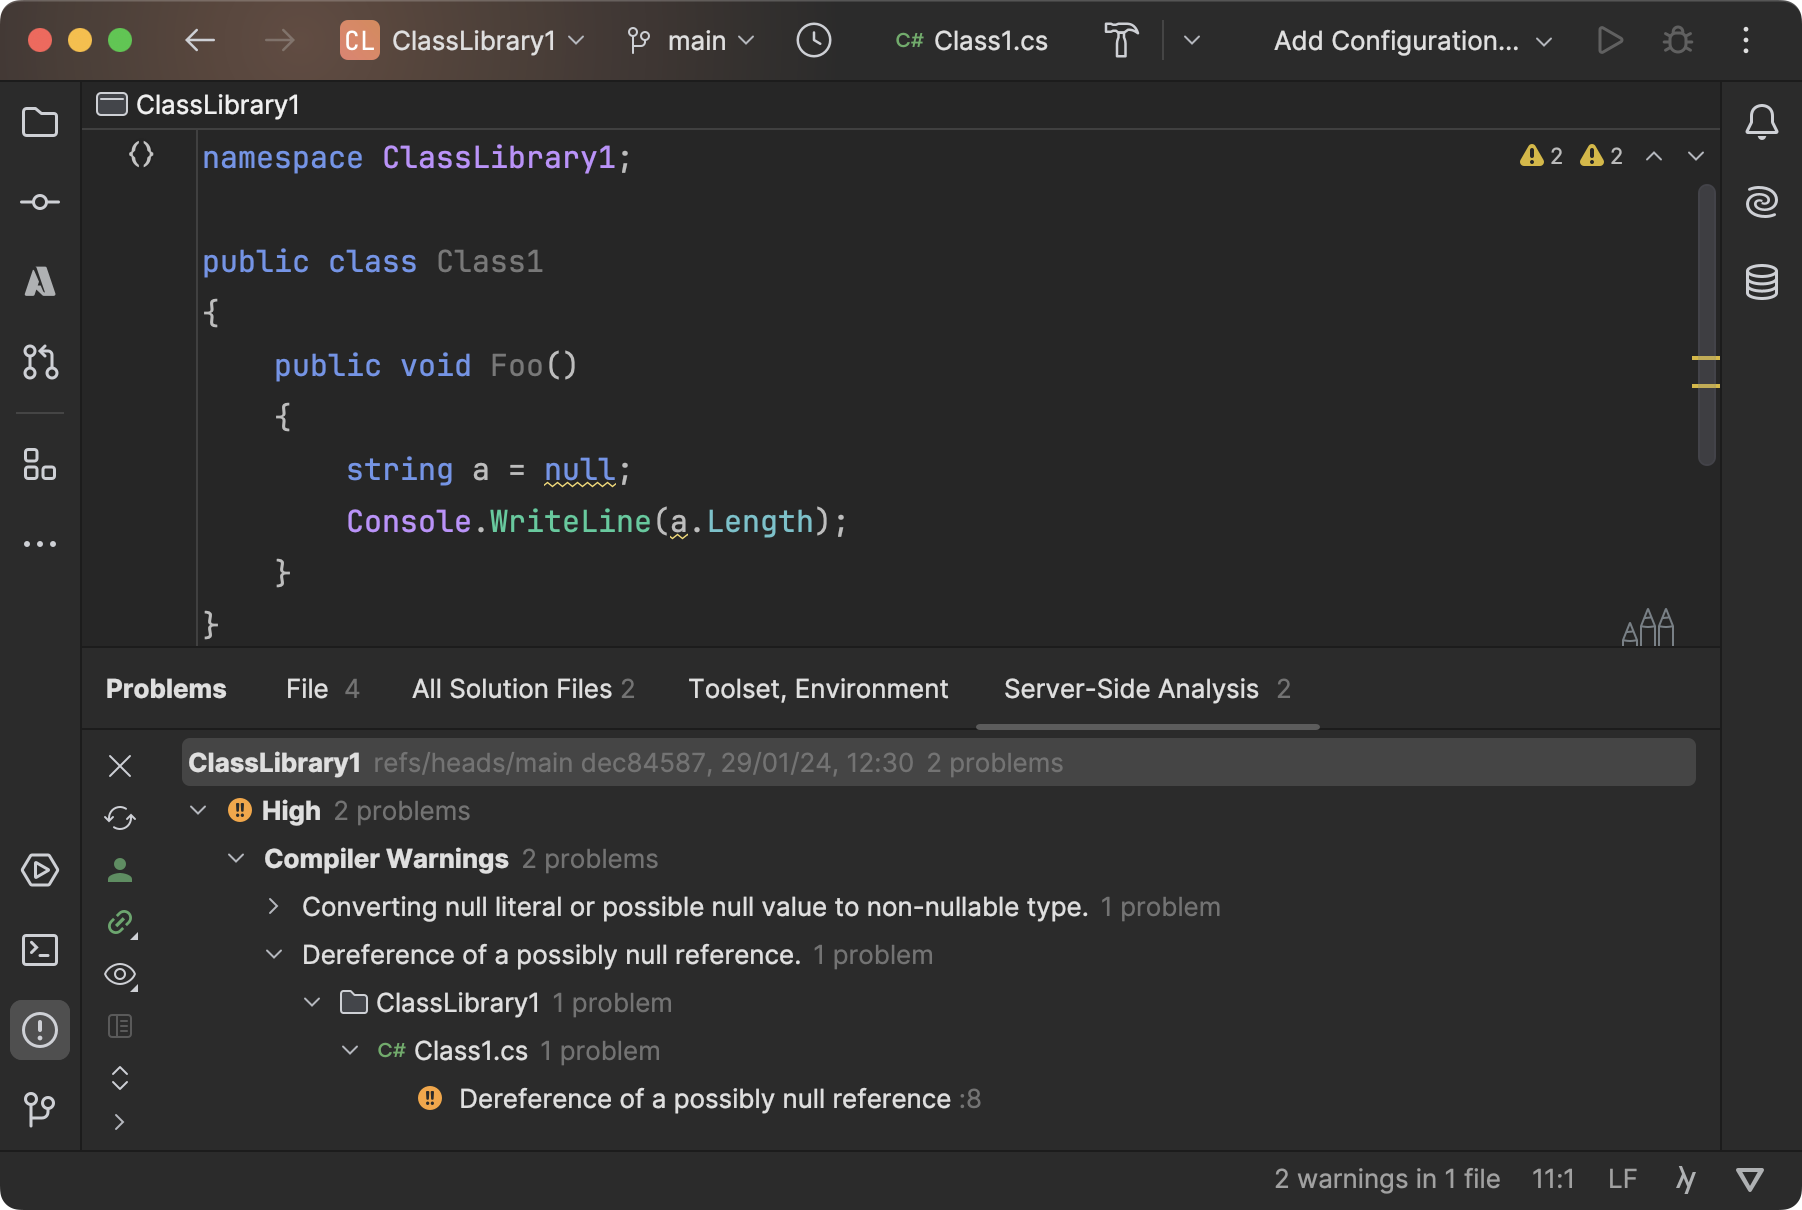
Once the project is linked, you will see the first analysis results inside your IDE. The report includes all important information about the workflow run, branch, number of issues, their classifications, and severities:
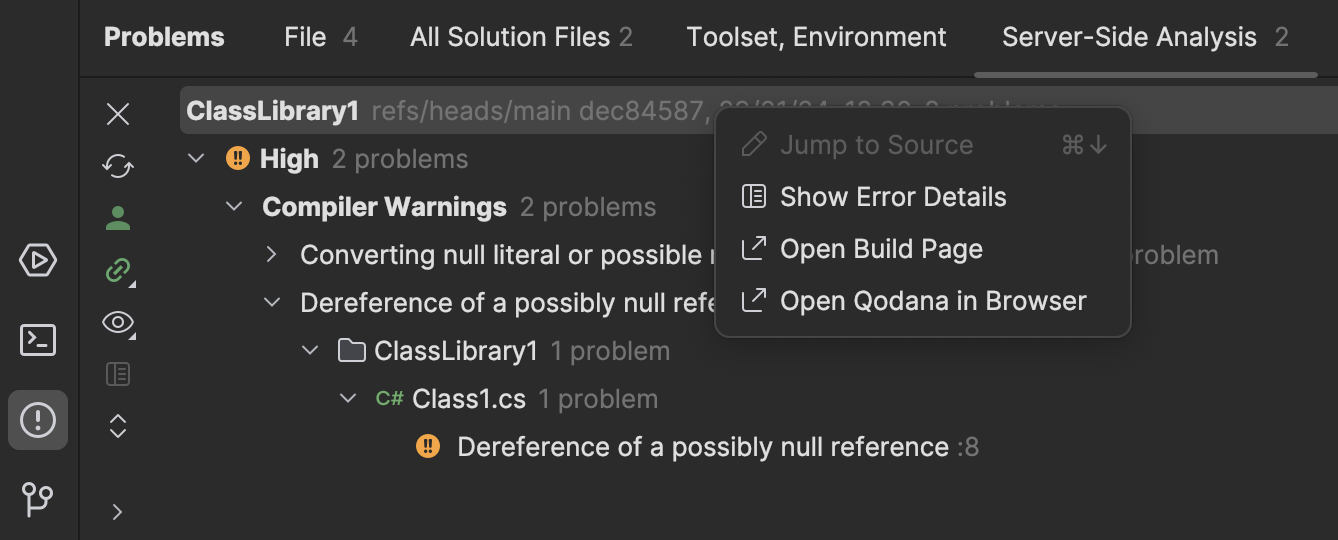
Double-clicking an issue quickly navigates you to the location in your repository. It’s also worth noting that from the context menu, not only can you navigate to the report in Qodana Cloud but also to the workflow run in GitHub Actions:
Another great strength of Qodana is that it doesn’t just provide its analysis results through our IDEs and Qodana web interface but also directly through both annotations and job summaries under workflow runs. That means even contributors who don’t use JetBrains IDEs or don’t have access to your Qodana project can take advantage of Qodana’s first-class analysis reports:
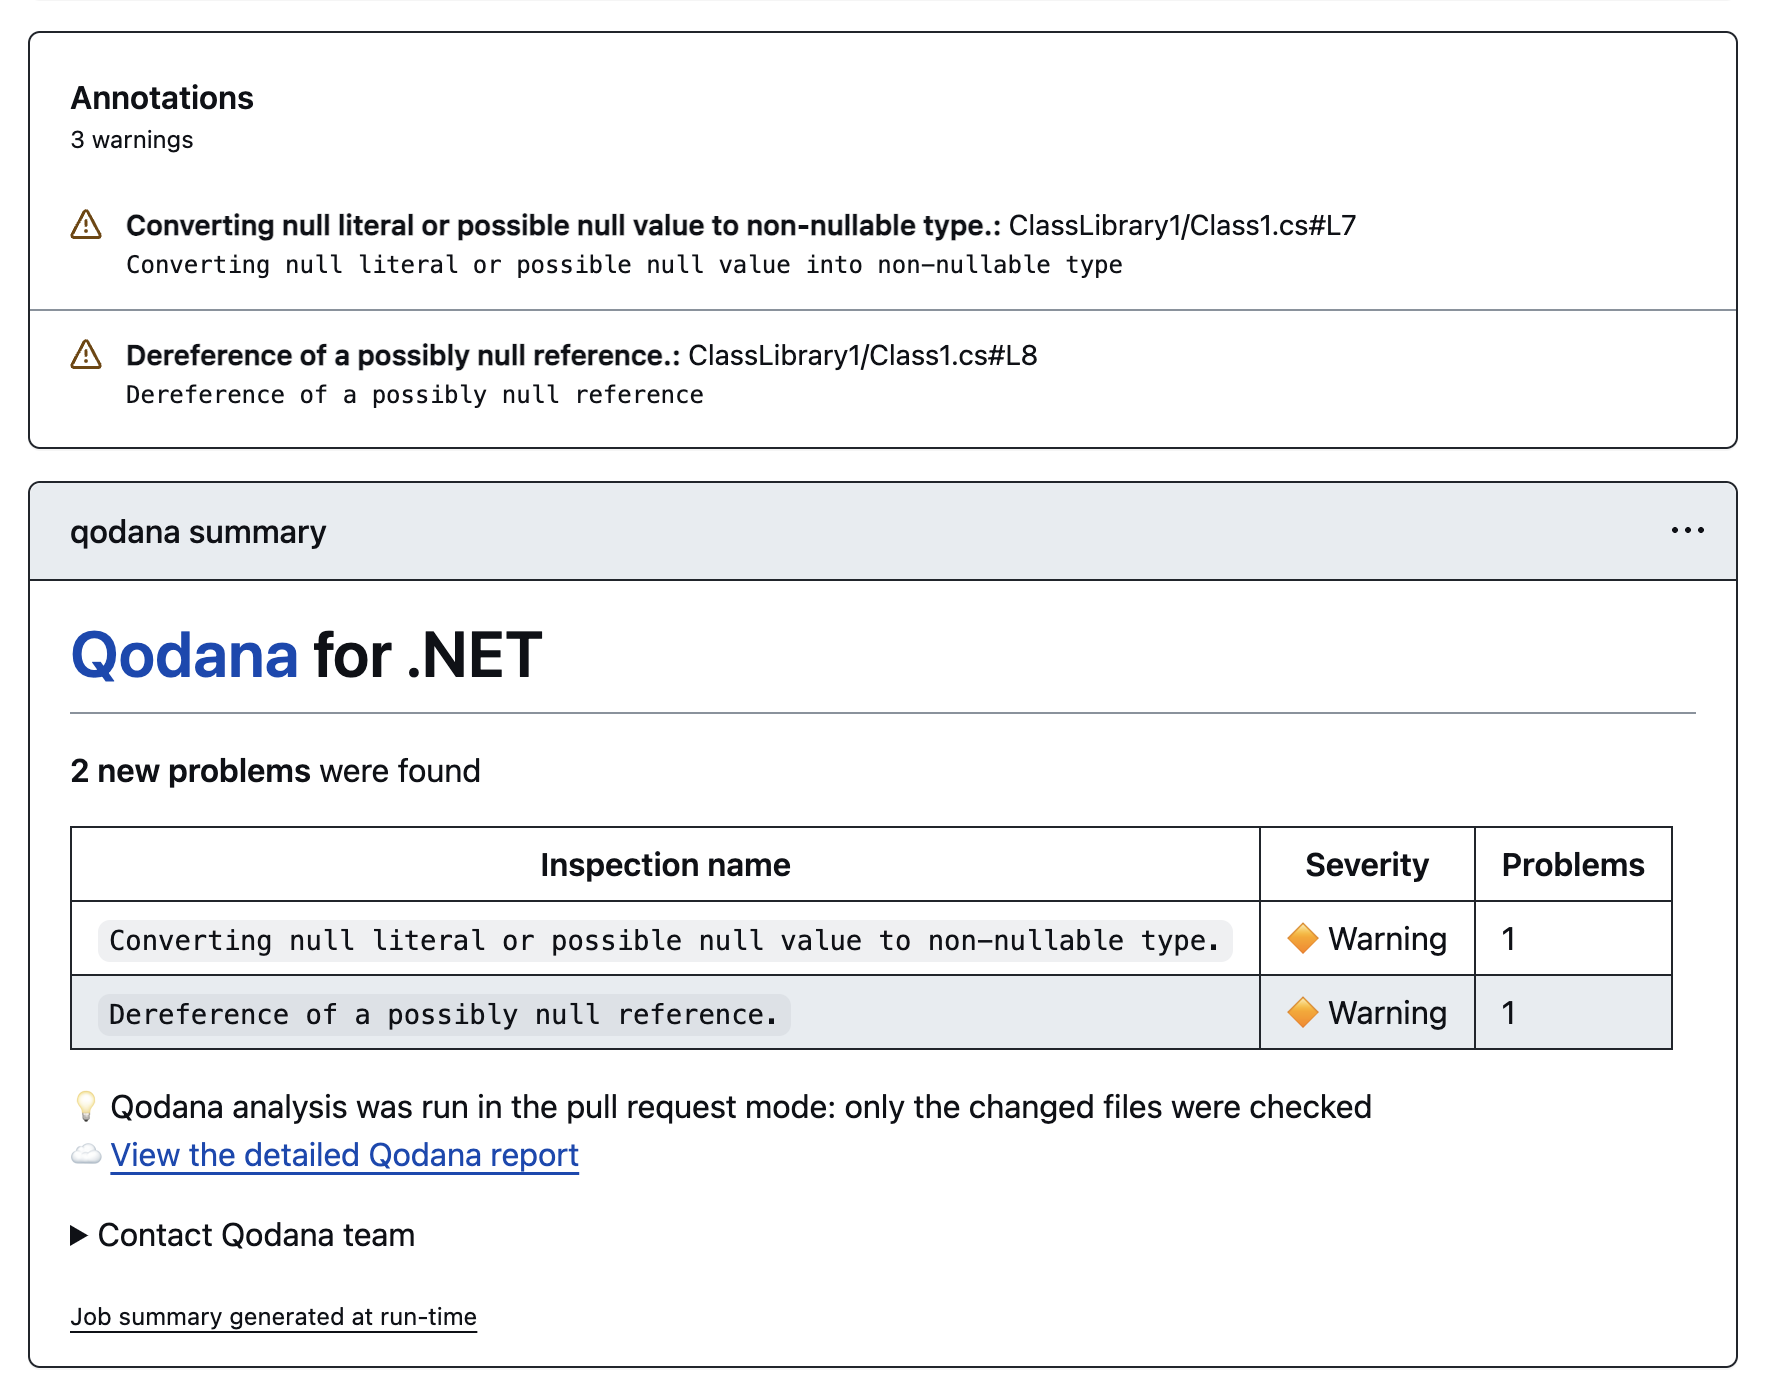
This is a little reminder that we also built an extension for Visual Studio Code.
In case you don’t want to see any annotations, you can opt out via the use-annotations property:
- name: Qodana Scan
  uses: JetBrains/qodana-action@main
	with:
	  use-annotations: false
In contrast to our demo project in this blog post, your solution might show significantly more code inspections and problems. This is expected, and you shouldn’t feel discouraged by it. Our goal with Qodana is to help you improve your code quality in an incremental and flexible way, which can be achieved by moving existing problems to the baseline and configuring a fail threshold as a quality gate.
In the following sections, we’ll dive into the GitHub-specific aspects of Qodana.
Qodana results in GitHub Pull Requests
In order to make Qodana work properly with pull requests, you need to set the ref and fetch-depth properties on the checkout action as follows:
- uses: actions/checkout@v4
  with:
    ref: ${{ github.event.pull_request.merge_commit_sha }}
    fetch-depth: 0
Without any additional effort, Qodana can post analysis results on GitHub pull requests. This enables contributors to react promptly to potential bugs and quality degradation. At the same time, it gives repository owners more confidence when it comes to merging pull requests:
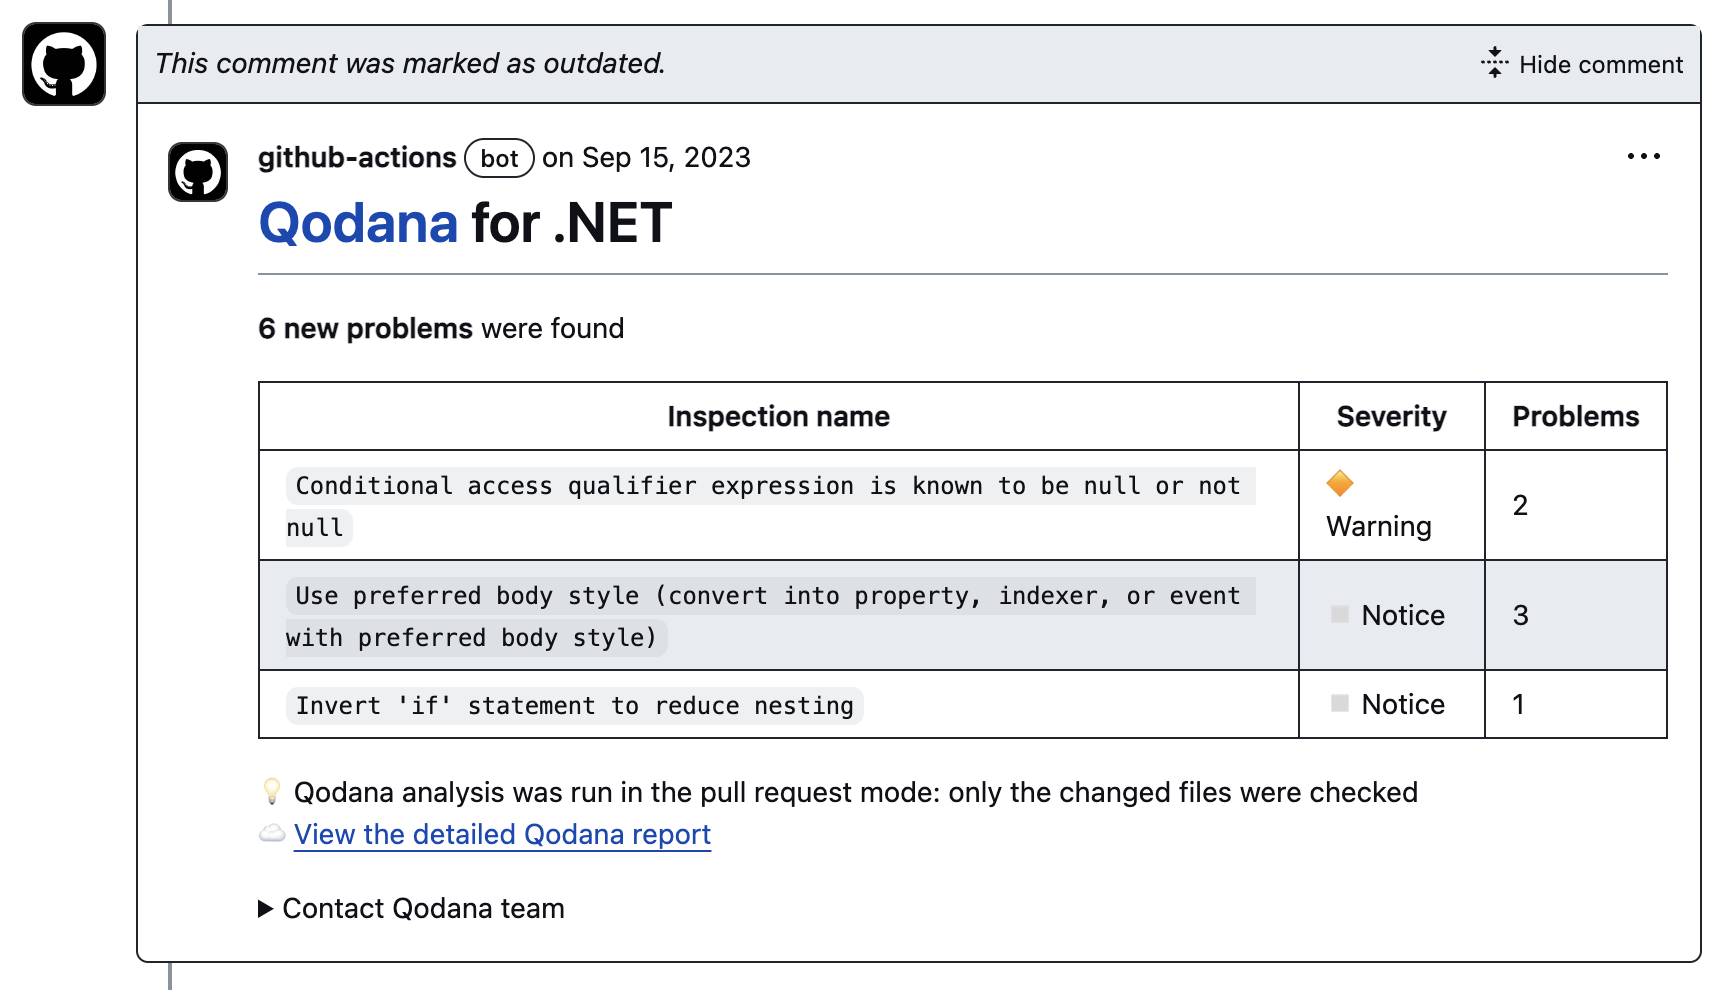
This analysis report is updated as more commits are pushed to the branch.
If you prefer not to post any updates on pull requests, you can opt out via the post-pr-comment property:
- name: Qodana Scan
  uses: JetBrains/qodana-action@main
	with:
	  post-pr-comment: false
Uploading Qodana results as artifacts
By default, Qodana will upload analysis results only to Qodana Cloud. Under certain circumstances, you might also want to upload them as artifacts. This could be to update the qodana.sarif.json baseline file by simply downloading and replacing it in your repository or to allow contributors to investigate a report directly in their IDE without having to link the project:
In order to opt into uploading the Qodana report as an artifact, you can use the upload-result and artifact-name properties:
- name: Qodana Scan
  uses: JetBrains/qodana-action@main
	with:
	  upload-result: ${{ github.ref_name == 'main' }}
		artifact-name: qodana-report
Adding a Qodana status badge
After all that work of integrating Qodana into your repository, what could be better than adding a lovely little badge to show that it’s in good shape? Just head over to one of the workflow runs and grab it from the menu in the upper right-hand corner:
Conclusion
Over recent months, Qodana has made significant strides in seamlessly integrating with your GitHub repositories, diligently monitoring code quality with each commit and pull request. Through this integration, maintainers and contributors can swiftly pinpoint defects, whether within their IDEs/editors or directly within the GitHub UI. Register on Qodana Cloud today and experience the enhancement of code quality in GitHub firsthand!
As always, let us know what you think and what features you’d like to see in the future!
Image credits: Andy Hermawan