.NET Tools
Essential productivity kit for .NET and game developers
Heap Allocations Viewer plugin

When we first launched ReSharper 8 back in July last year, there was a very nice little feature hidden in internal mode. This was being used by the dev team to help keep an eye on performance. It was a little checkbox that said “Show allocations (delegates, closures, hidden allocations, boxing)”.
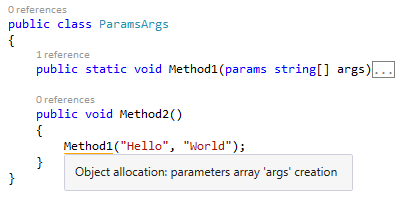
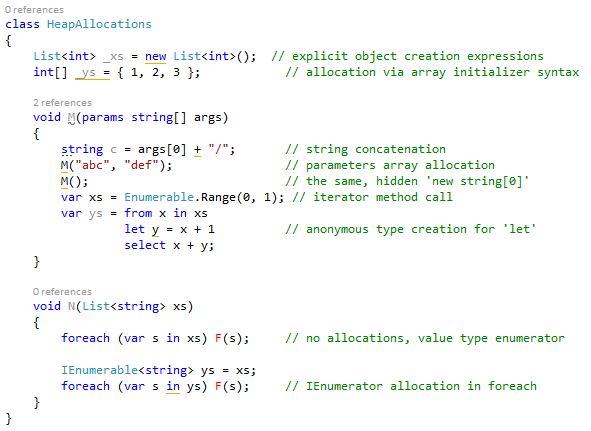
It added highlights to your code, as you type, indicating where memory is being allocated. It’s very eye-opening to see how frequently memory is allocated, and often in places you don’t expect. Take this call to a function with “params” arguments. Note the orange highlight, telling us that .net will allocate an array for the parameters, for each call:
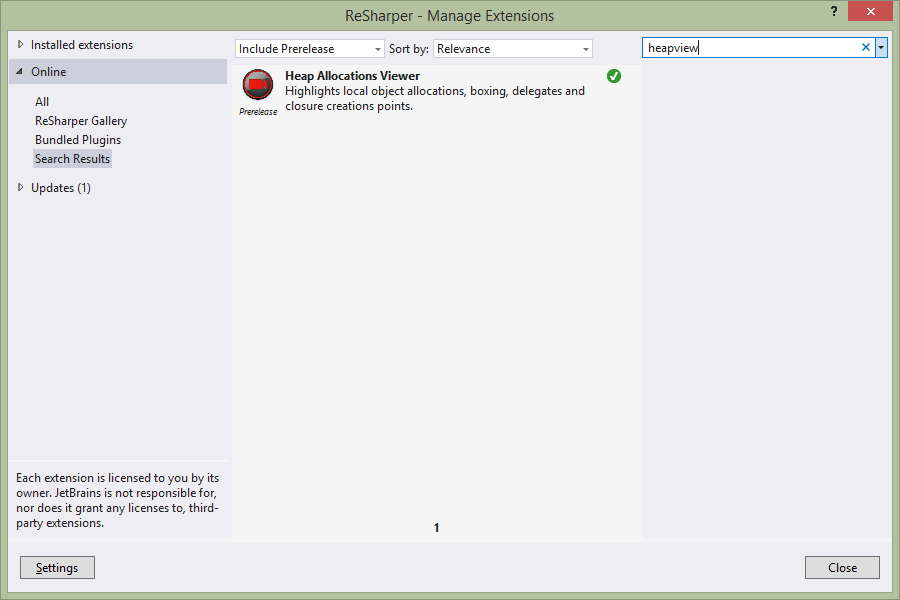
But alas, features hidden in our internal mode are not very discoverable. So the developer behind the feature, Alexander Shvedov, made a few changes, fixed a few issues and pulled it out into an extension, which is now available to download from the extension manager, by searching for “heapview“. A stable version 0.9.1 is available, but you can always live on the edge by installing a prerelease version.
WARNING: Before we go any further, it must be said: BEWARE OF PREMATURE OPTIMISATION.
This plugin will tell you when an allocation is made, but it does not tell you how much memory is being allocated, or how frequently. It does not tell you if you have memory problems with your application. It simply shows where allocations are going to occur. You should still use a memory profiler such as dotMemory to measure your application and decide if your memory usage is causing you issues.
But of course, the plugin is still very useful. It’s always good to know what your code is doing, and having that visible can help you to make more informed design decisions. It’s also very helpful when you know you need to write code that should avoid excessive allocations. For example, the dev team use this to keep an eye on memory allocations made during performance critical code paths, such as as-you-type analysis. These code paths are called very frequently, every time you edit a document, and obviously need to be fast. Memory churn can have a huge impact on performance especially if it causes garbage collection, so even a small amount of allocations in these circumstances can have a knock on effect on performance.
And of course, it’s simply a very interesting view into what your code is doing!
So what does it highlight?
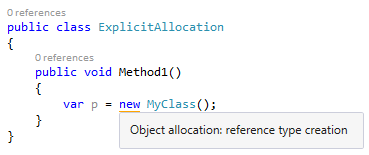
Obviously, it handles explicit allocation, with the new keyword:
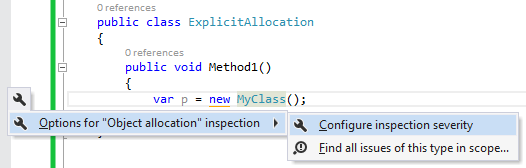
And it also supports the standard ReSharper functionality of changing the severity of the highlight (so you can disable it if you’re not interested in that particular highlight) and allows you to find all similar highlights in the project or solution.
Other heap allocations:
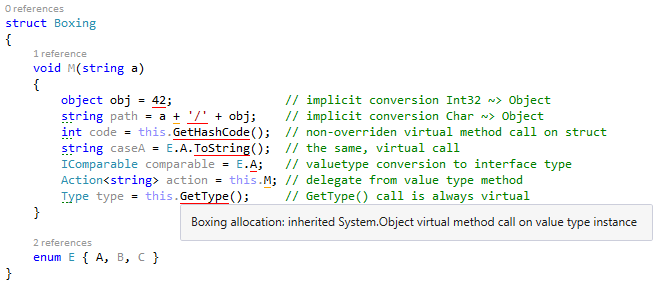
The plugin will highlight allocations made due to boxing:
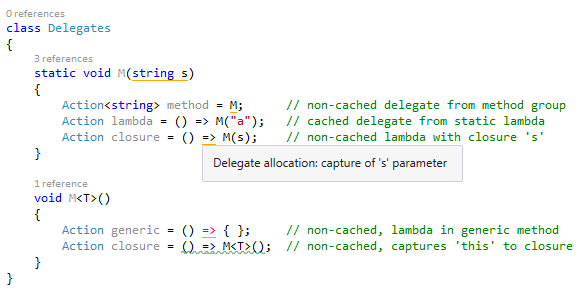
Delegate creation, even listing local scope variables that are captured in closures:
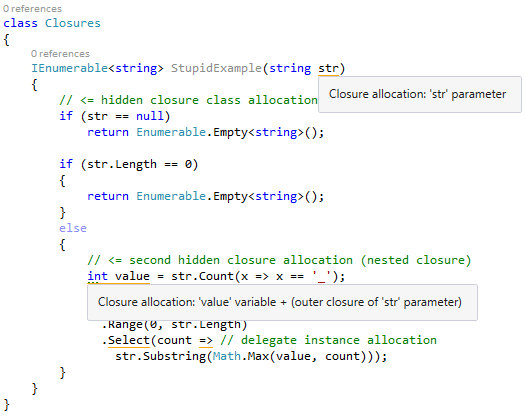
It will even show you the points where the classes used to capture closure variables are created:
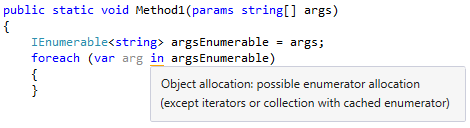
You can use this plugin in combination with a full profiler, such as dotMemory. Here’s an example where the plugin reports a possible enumerator allocation:
When profiling this code using dotMemory and capturing memory allocations, we can see that the plugin is right: generic array enumerators are being allocated (of type SZArrayHelper+SZGenericArrayEnumerator<String>) and collected all the time, potentially triggering garbage collections! The backtrace also shows us that these allocations originate from Method1:
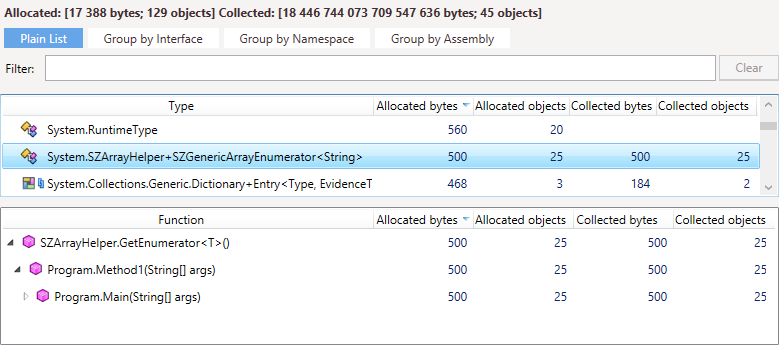
Our code would be more performant and less heavy on memory traffic if we just enumerated the args array instead of casting it to an IEnumerable<string>.
As we can see, once you’ve found your allocation hotspots with the profiler, the plugin will make it obvious where in the method the memory is being allocated, whether it be explicitly, or through hidden allocations such as boxing or capturing closure information.
And of course, it’s Open Source. If you’re interested to see how it’s written, or want to report issues, or perhaps even contribute, please check it out.

Subscribe to a monthly digest curated from the .NET Tools blog: