.NET Tools
Essential productivity kit for .NET and game developers
New code coverage highlighting in dotCover 2016.3
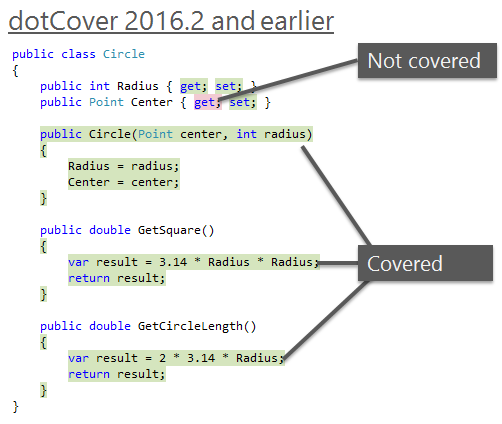
After we released the initial continuous testing support in dotCover, the most popular response was “Cool, but this could be a lot more useful if highlighting was able to indicate test results.” Indeed, before 2016.3, dotCover’s highlighting was used only to indicate code coverage:
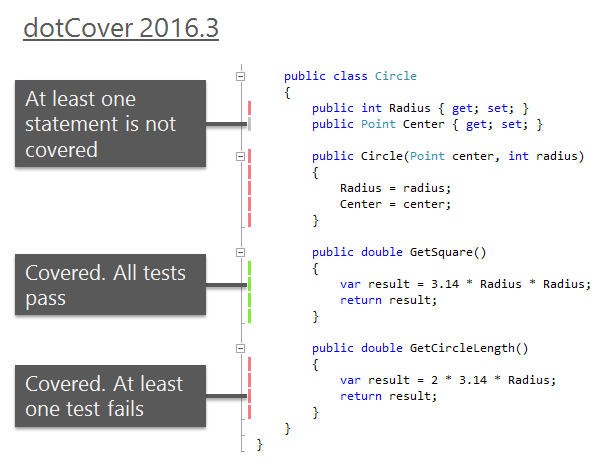
dotCover 2016.3 finally addresses the issue. First, we got rid of colored backgrounds. Now, we use a small colored marker in the left gutter. Second and most important, we’ve completely changed the highlighting logic. Now, it not only shows whether a statement is covered by tests but also indicates test results.
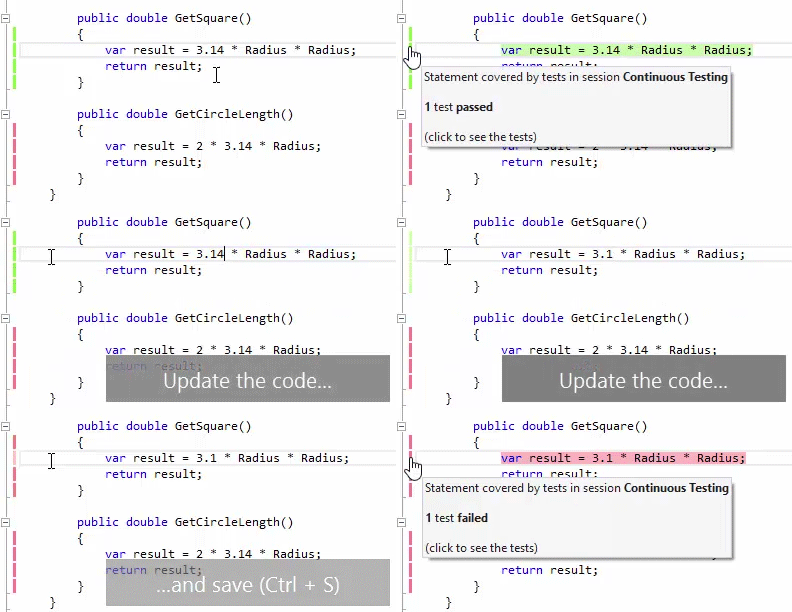
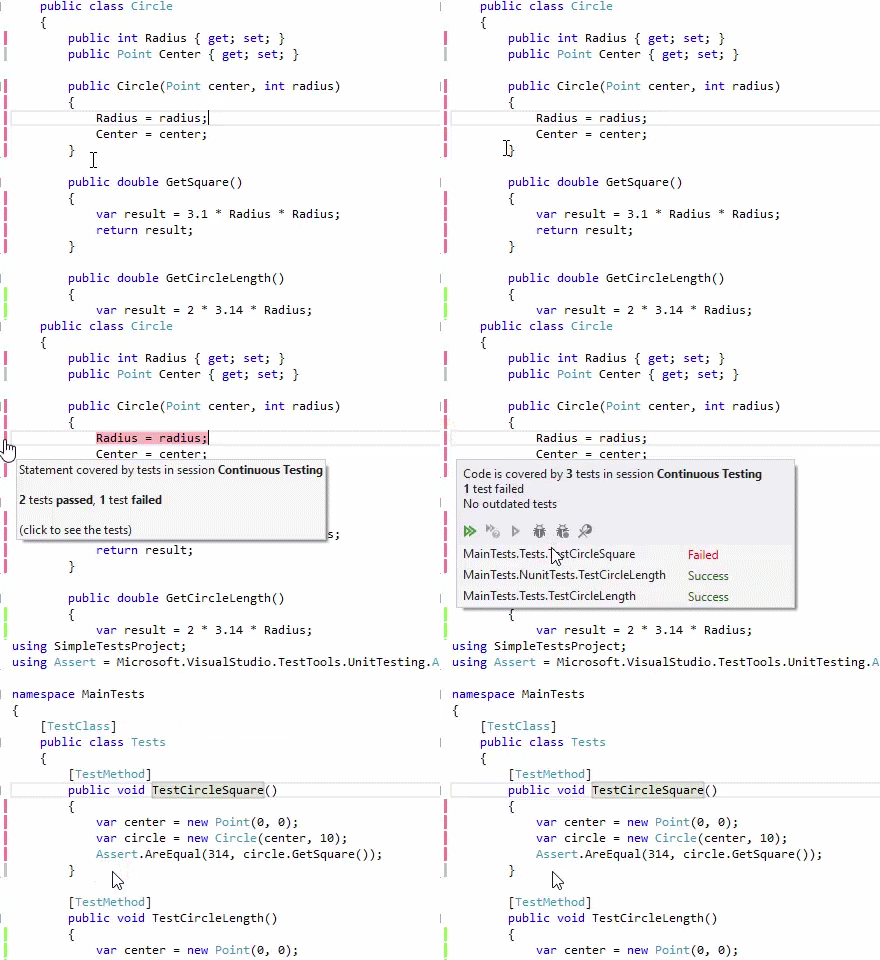
The new highlighting is especially useful for continuous testing. You no longer need to keep the Continuous Testing Session window open: you run tests and see results instantly, right in the code:
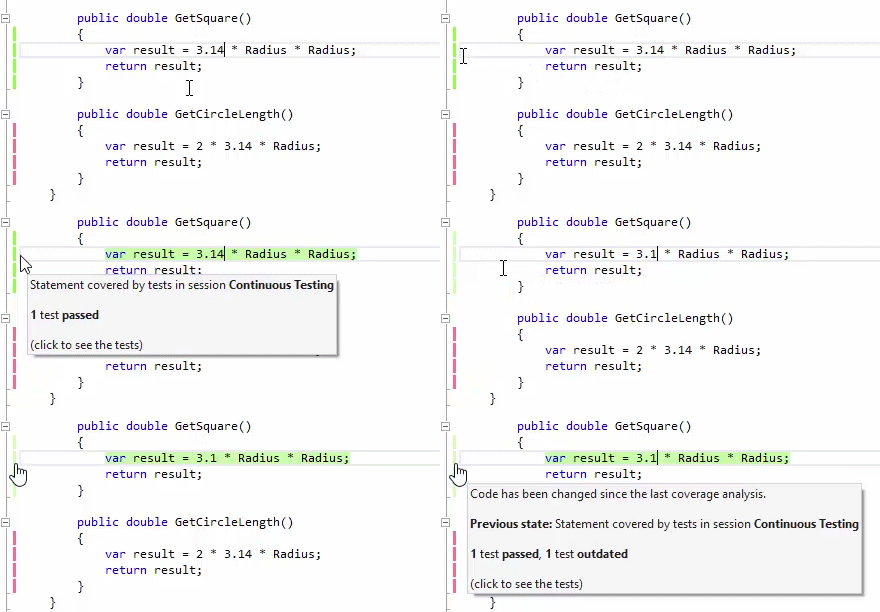
Each marker’s tooltip shows you details on the number of tests, their state, and coverage session. Note that as soon as you change the code in any way, test results become outdated. In this case, a marker keeps its color but it becomes lighter. The marker’s tooltip continues to show details about the previous state:
How to quickly navigate to covering tests?
Just use the Ctrl+Alt+K,T shortcut. Alternatively,
- Click on a marker to see tests. The list with covering tests will appear.
- Double click on a particular test to navigate.
How to quickly debug failed tests?
Using the same tests list that appears by click on a marker!
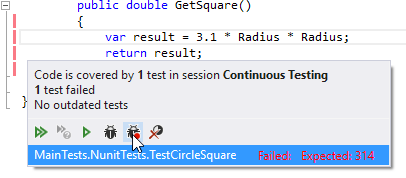
First, you can quickly get stack trace data for any failed test:
You can also instantly set a breakpoint for any statement that is covered by a failing test and then launch debugging:
What if there are multiple statements in a line?
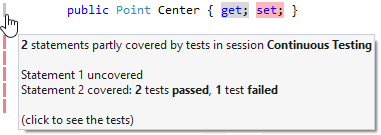
If a line of code includes several statements with different coverage results, dotCover will highlight the line taking into account only the ‘worst’ result. For example, if tests pass for the first statement, but fail for the second, dotCover will highlight the line with red. If one statement is covered by some failing tests and another statement is not covered at all, the highlighting will be gray:
How to enable code coverage highlighting?
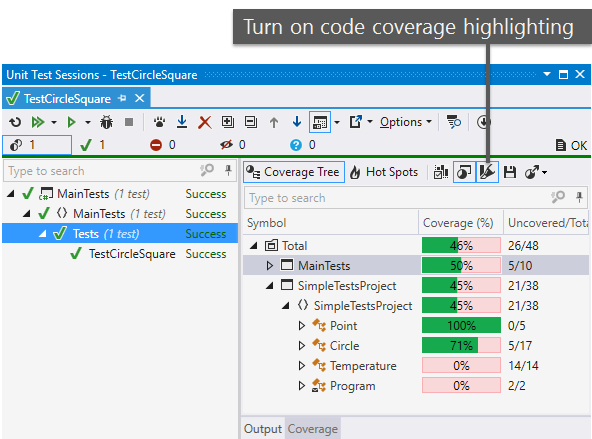
Nothing has changed in this regard. As usual, you can enable/disable the highlighting in the Unit Test Sessions window (Coverage tab) using the Highlight code button or the Ctrl+Alt+K,H shortcut.
As usual, we invite you to try this new feature on your own. Download ReSharper Ultimate 2016.3 and let us know how it works for you.


