After we released the initial continuous testing support in dotCover, the most popular response was “Cool, but this could be a lot more useful if highlighting was able to indicate test results.” Indeed, before 2016.3, dotCover’s highlighting was used only to indicate code coverage:
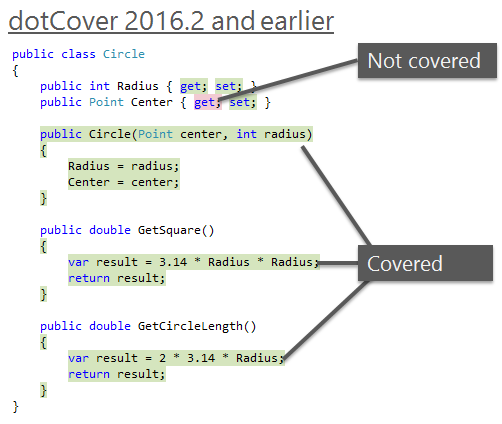
dotCover 2016.3 finally addresses the issue. First, we got rid of colored backgrounds. Now, we use a small colored marker in the left gutter. Second and most important, we’ve completely changed the highlighting logic. Now, it not only shows whether a statement is covered by tests but also indicates test results.
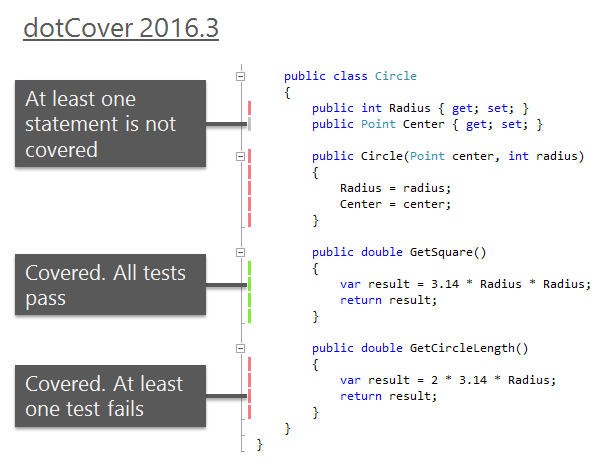
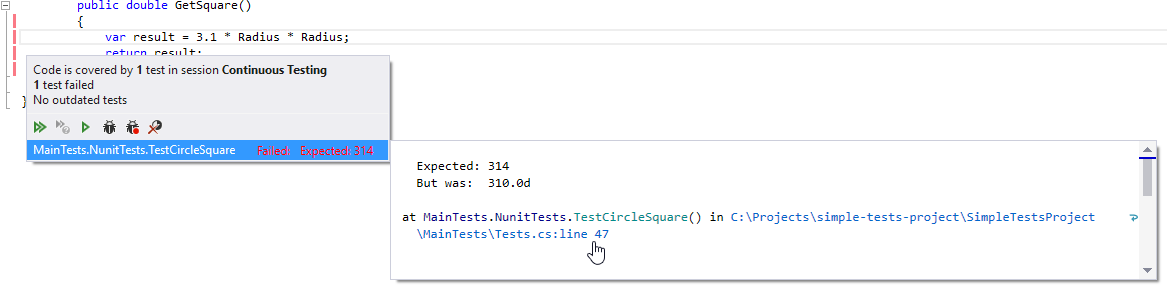
The new highlighting is especially useful for continuous testing. You no longer need to keep the Continuous Testing Session window open: you run tests and see results instantly, right in the code:
Each marker’s tooltip shows you details on the number of tests, their state, and coverage session. Note that as soon as you change the code in any way, test results become outdated. In this case, a marker keeps its color but it becomes lighter. The marker’s tooltip continues to show details about the previous state:
How to quickly navigate to covering tests?
Just use the Ctrl+Alt+K,T shortcut. Alternatively,
- Click on a marker to see tests. The list with covering tests will appear.
- Double click on a particular test to navigate.
How to quickly debug failed tests?
Using the same tests list that appears by click on a marker!
First, you can quickly get stack trace data for any failed test:
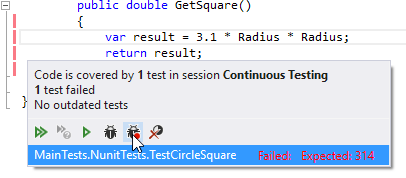
You can also instantly set a breakpoint for any statement that is covered by a failing test and then launch debugging:
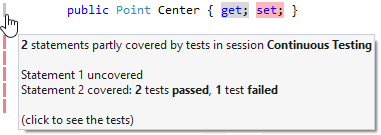
What if there are multiple statements in a line?
If a line of code includes several statements with different coverage results, dotCover will highlight the line taking into account only the ‘worst’ result. For example, if tests pass for the first statement, but fail for the second, dotCover will highlight the line with red. If one statement is covered by some failing tests and another statement is not covered at all, the highlighting will be gray:
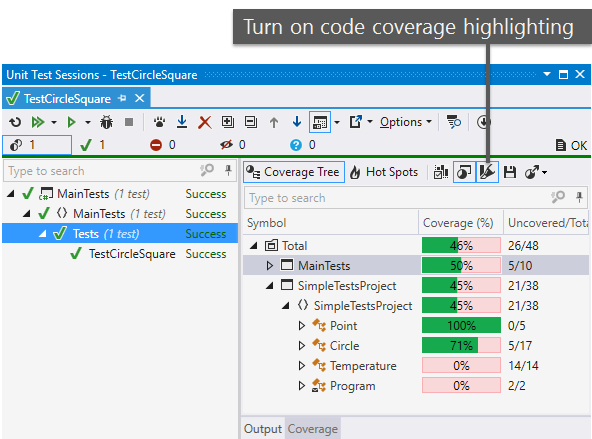
How to enable code coverage highlighting?
Nothing has changed in this regard. As usual, you can enable/disable the highlighting in the Unit Test Sessions window (Coverage tab) using the Highlight code button or the Ctrl+Alt+K,H shortcut.
As usual, we invite you to try this new feature on your own. Download ReSharper Ultimate 2016.3 and let us know how it works for you.
When you do a diff on a file prior to checking in can you see the code coverage indicators? I always find this important as you should be able to see that every modified line you check in is covered by a passing test. Some of the code coverage tools don’t show up when doing a diff in visual studio.
Yes, dotCover shows code coverage in the diff window.
Pingback: Dew Drop - January 19, 2017 (#2405) - Morning Dew
Nice functional features, but is there an option to get the old background highlighting back? I like that better.
No, there’s no such option in 2016.3 (probably, future releases will get it). Currently, you can only turn back on the “old” highlighting logic (it’s still will be shown with markers in the gutter): red – not covered, green – covered. To do this, disable the option “ReSharper | Options | dotCover | Highlighting | Use highlighting to show unit test results”.
Vote here, Greg:
https://youtrack.jetbrains.com/issue/DCVR-8548
Hi,
I installed ReSharper Ultimate 2016.3.2 on Visual Studio Ultimate 2013 12.0.40629.00 Update 5 with .NET 4.6.01055, opened a small solution and covered all tests. The Coverage tab in the Unit Test Sessions window shows the coverage nicely, but when I open any file, the code highlight says “Statement uncovered by tests in session All tests in Solution. Also, right clicking on a class with coverage on the Coverage Tree and clicking on Show covering tests says “Code is not covered by tests in session All tests from Solution”.
I tried the same thing with Continuous testing with the same results.
Then I switched Continuous testing off and the Coverage tab in the Unit Test Sessions window no longer shows percentages, everything’s 0%.
Restarting Visual Studio fixed that.
I tried clearing Resharper’s caches and restarting without success.
Am I doing something wrong?
Hi Joan,
Seems that dotCover misses per-test data. Which unit testing framework do you use?
Hi Alexey,
I use MSTest.
Also I exported the coverage data in HTML and surprisingly the html webpage was showing the code highlighted properly
Here you can find the project and the HTML export:
https://drive.google.com/open?id=0B7D9cq1rj5asbUFLOVQxNDNubWs
Hi Joan,
tried running coverage for your project – everything works fine.
Could you please contact dotCover support https://dotnettools-support.jetbrains.com/hc/en-us ?
It would be awesome if you could make a screencast of the issue beforehand. You can use https://www.techsmith.com/jing.html for this purpose. Thanks!
Hi Alexey,
I just created a new post: https://dotnettools-support.jetbrains.com/hc/en-us/community/posts/115000084810-DotCover-covers-tests-but-code-highlighting-says-statement-uncovered-and-can-t-find-covering-tests.
Thanks a lot
I am getting poor editor performance with this enabled, with scrolling feeling very clunky.
Otherwise, this is brilliant!