

.NET Tools
Essential productivity kit for .NET and game developers
Subsystems in dotTrace Timeline Viewer

If you use dotTrace, you probably know it consists of two independent applications for performance analysis: Performance Viewer and Timeline Viewer. One of the greatest features that made Performance Viewer so helpful for quick performance evaluation was Subsystems. In dotTrace 2016.3, Subsystems have finally made it into dotTrace Timeline Viewer.
What are subsystems?
The mechanics of Subsystems are quite simple. In most cases, each subsystem just groups calls made within a certain namespace or assembly: WPF, LINQ, collections, strings, and so on. There are also certain special subsystems which are calculated based on other data (like ETW). These are garbage collection, file I/O, lock contention, and some others.
Why would you care about subsystems when you profile?
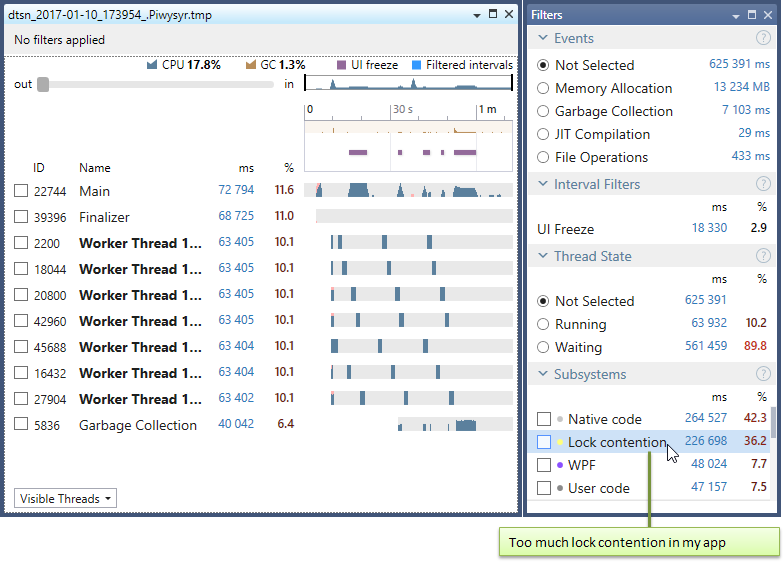
The purpose of Subsystems is to quickly answer the main question “What the heck is going on in my app?”, along with more specific questions like “What causes the performance drop?” or “What allocates so much memory?” In dotTrace 2016.2 and earlier, you had to check different filters scattered around the UI to answer these questions. Now, the Subsystems filter is the single place* that shows you how time on the selected time interval is distributed among various activities.
*A group of filters previously known as Interval Filters is now also partly incorporated into Subsystems.
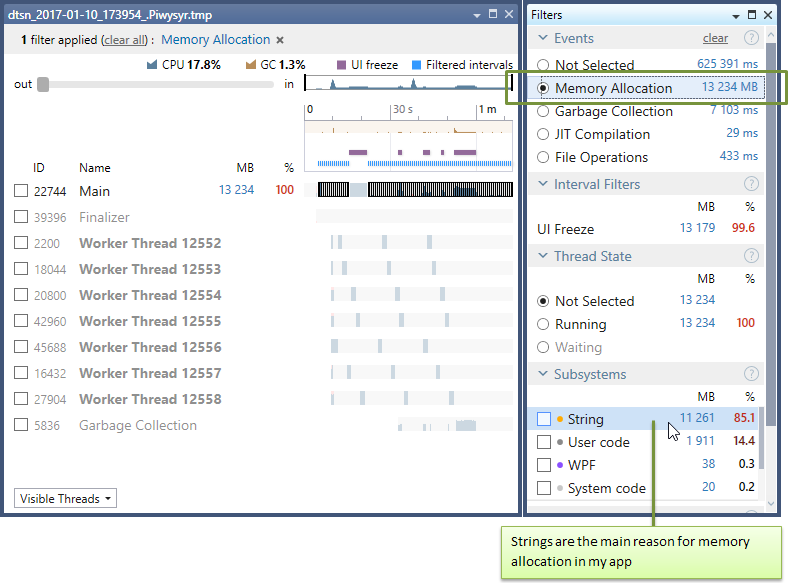
If you switch the Events filter to Memory Allocation, Subsystems will show you how much memory a particular subsystem allocates:
Subsystems are available not only as a filter but also as a bar in Call Stack | Methods and Subsystems. The bar shows exactly the same data as the Subsystems filter does. The reason for having it here is to visually evaluate the contribution of certain subsystems in a call subtree. If you enable Follow selection in call tree, the bar will show subsystems for the node currently selected in Call Tree.
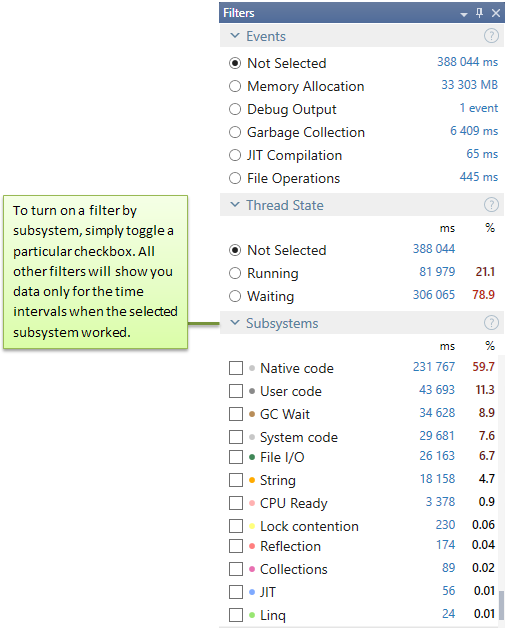
Don’t forget that as everything in Timeline Viewer, Subsystems are able to work as a filter.
To turn on a filter by a certain subsystem, simply check the subsytem in Filters | Subsystems or click on it on the bar in Methods and Subsystems.
Create your own subsystems
By default, all your code is calculated within the User Code subsystem. Of course this can be too vague in solutions containing multiple projects and/or using third-party frameworks. No worries! Subsystems are very flexible – you can create a new subsystem for any assembly, class or method you want to be shown separately in Subsystems.
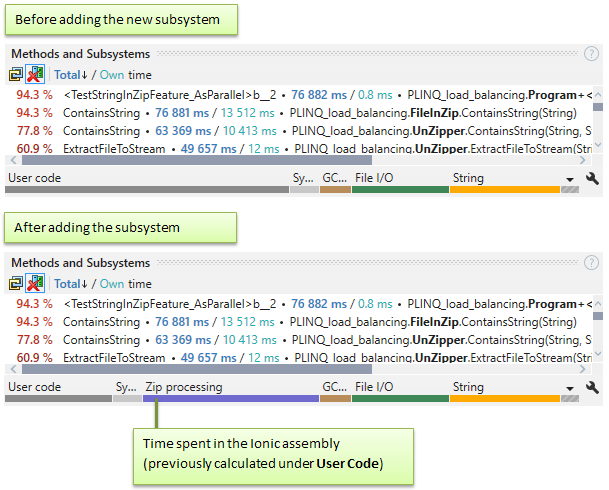
For example, our app uses the Ionic zip library to handle zip files. We want to be able to quickly see how much time our application spends on zip processing. All we need to do is create a new subsystem that aggregates time spent in the Ionic assembly.
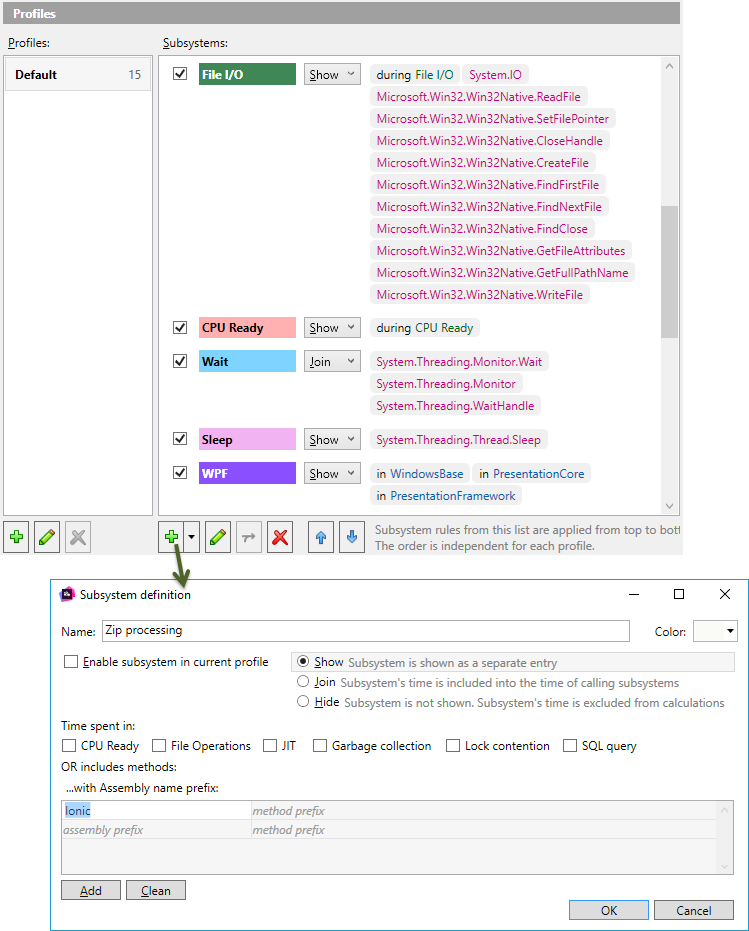
After you add the new subsystem, Subsystems will be instantly recalculated:
As always, we suggest that you download ReSharper Ultimate and try subsystems in Timeline Viewer on your own!


