.NET Tools
Essential productivity kit for .NET and game developers
ReSharper Ultimate 2017.1 EAP 6: dotMemory console profiler and more
Today we welcome you to download our last pre-release build of ReSharper Ultimate 2017.1 and check out all new features and improvements that we’ve been working on since the beginning of this year. In the previous builds we fixed important bugs and added new features that mostly relate to perfecting support for Visual Studio 2017 RTM and C# 7. Today’s EAP build includes noticeable updates to dotMemory, dotPeek and a few other improvements that we are going to cover in this post.
dotMemory command line profiler
dotMemory 2017.1 introduces a console profiler. The dotMemory.exe tool allows configuring and running profiling sessions right from the command line. The tool is a perfect fit when you need to automate the process of gathering memory snapshots in the following cases:
- You want to make profiling a part of your continuous integration builds, e.g. this can be a build step that performs profiling of your integration tests.
- You want to speed up profiling routines, e.g. when you regularly profile the same application and do not want to start the dotMemory user interface each time.
See how easy it is to take a memory snapshot of a running application (with 6844 PID):
dotMemory.exe get-snapshot 6844 --save-to-dir=C:\Snapshots
or to run an application and take a snapshot only when memory consumption increases by 50%:
dotMemory.exe start --trigger-mem-inc=50% C:\MyApp\MyApp.exe
The dotMemory.exe tool also allows taking snapshots by a command sent to stdin or by using the profiling API. The most basic tool usage scenarios are described in our Help.
Navigation and search
Finding usages of a specific interface or type becomes even more convenient with a new option in Find Results window to group by kind of usage. There are certain usages like Type conversions which you may want to pay special attention to during the development process. And grouping helps here a lot. The filter was also updated so that you can select specific usage occurrences.

We’ve also added a small improvement that makes it possible to search for exact matches using quotes.
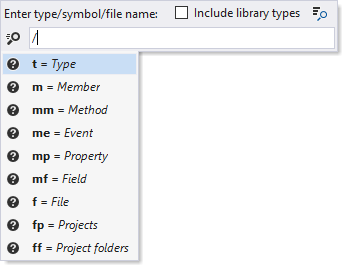
Go to Everything receives an option to filter the results using a special syntax. Just type ‘/’ to see all available filter options:

dotPeek portable PDB support
dotPeek can now generate not only traditional PDB files which are Windows-only, but also Portable PDB files. The type of the generated PDB is determined automatically and depends on the selected assembly. dotPeek Symbol Server supports generation of the Portable PDB files as well.
It is possible to explore the contents of the Portable PDB associated with the assembly (standalone or embedded) which is presented in the same way as the assembly metadata. For the associated Portable PDB you’ll see a corresponding subtree in the Metadata tree.
And finally, you can use sources embedded in the Portable PDB for navigation purpose.
Code formatting
All in all, ReSharper 2017.1 brings lots of enhancements to code formatting. EAP 6 adds two more options:
- In C# you can force line breaks in a ‘switch’ statement after the ‘case’ label statement or put each section on a single line.
- In HTML, CSS and XML you can add line feed at the end of the file.
Other updates
We’ve added support for the routing attributes in Razor Tag Helpers. Code completion, navigation and find usages commands, Rename refactoring are applicable to such attributes.
dotTrace timeline profiling of ASP.NET Core Web Application started to work with the new version of CoreCLR. If you were affected by this issue you need to upgrade your project to use .NET core 1.1.1.
We fixed issue with profiling Silverlight applications (PROF-634) by redesigning Core API so that now it supports all targets: Desktop (both Core API and Self API), Silverlight and CoreCLR. WCF profiling in Visual Studio 2017 RTM is now also supported (PROF-636).
That’s it. Please download ReSharper Ultimate 2017.1 EAP 6 and report any critical issues you encounter.


