.NET Tools
Essential productivity kit for .NET and game developers
Importing raw memory dumps in dotMemory 2017.2
Support for raw memory dumps was probably the most voted and long-awaited dotMemory feature. Finally, it’s available in dotMemory 2017.2!
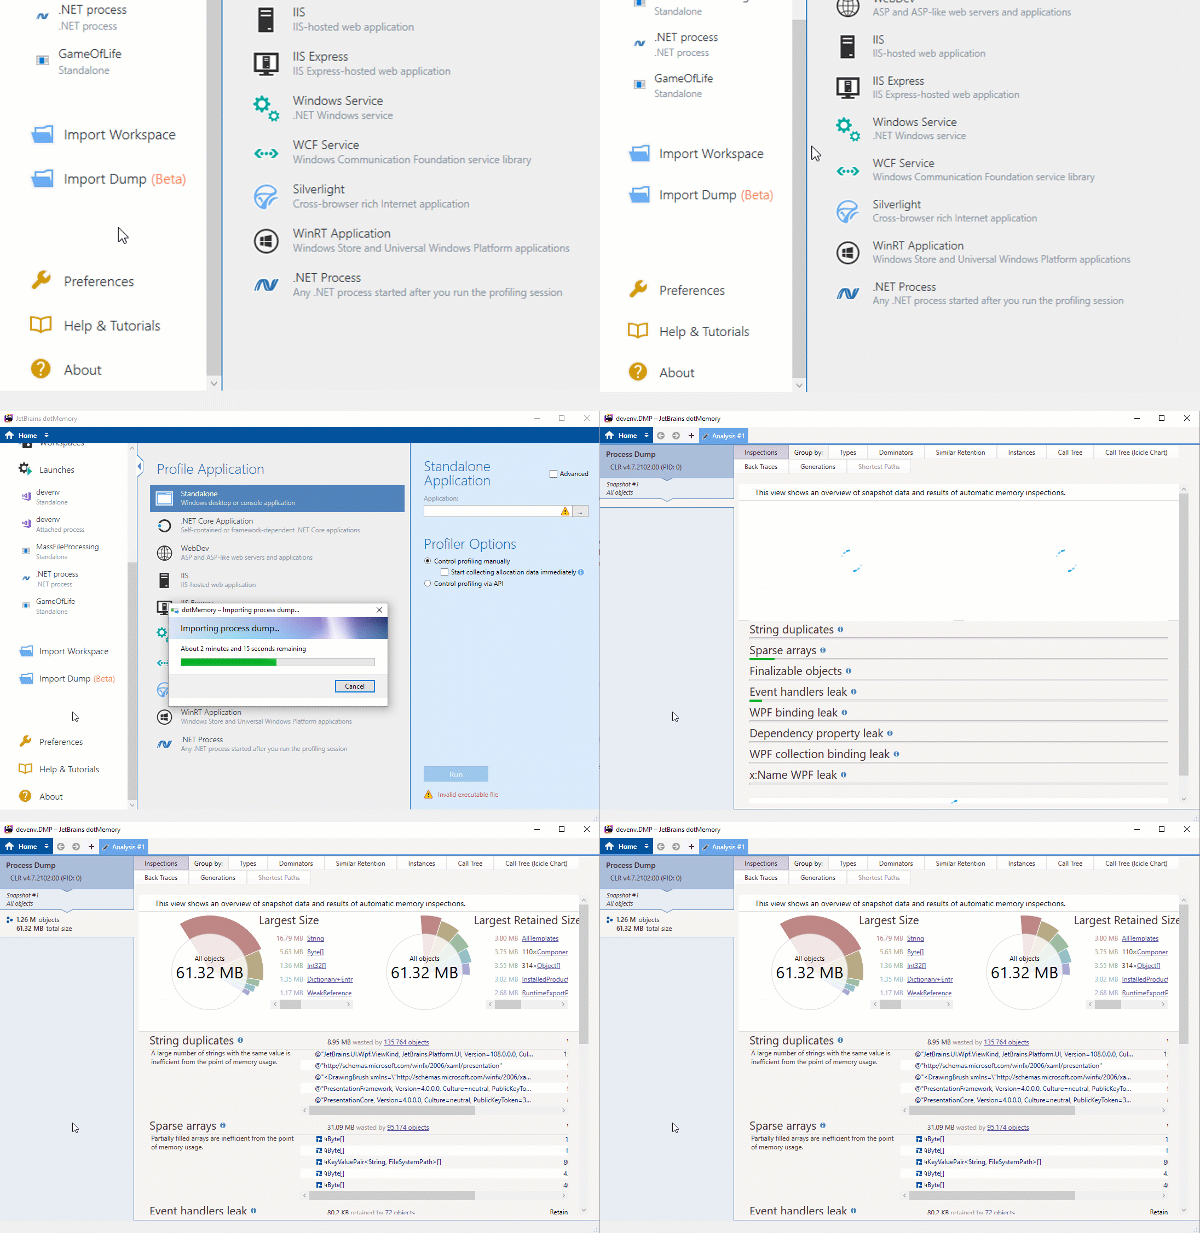
Indeed, there are cases when it’s impossible to profile a problematic application locally or remotely and take a regular dotMemory snapshot for analysis (e.g., because of security policies). Your last resort in such a case is typically a raw Windows memory dump. It can be taken with a number of tools, with the two most popular being Task Manager (comes with the operating system) and Process Explorer. Now, all you have to do is simply copy the dump to your computer and open it in dotMemory using the Import Dump command.

That’s it! The dump is converted to an ordinary dotMemory snapshot, so you can analyze it using all of the sophisticated dotMemory features like automatic inspections, retention path diagrams, etc.
Important notes
- The feature is currently in Beta status. While it’s 100% functional, the number of possible combinations of Windows and .NET Framework versions is really huge! This means it’s possible that for some combinations, dotMemory won’t show you all of the expected data in the resulting snapshot. Please send us your process dumps should you face this issue!
- When creating a dump of a 32-bit application with Task Manager, make sure you use a 32-bit version of the tool. You can find it in C:\Windows\SysWOW64\taskmgr.exe.
- We have tons of ideas on how to improve the feature (dumps contain much more data that we’re currently able to analyze), so this is still work in progress.
If you feel like trying importing dumps right now, download and install ReSharper Ultimate. Please ask your questions by posting comments to this post.


