

.NET Tools
Essential productivity kit for .NET and game developers
Analyzing performance of asynchronous .NET code with dotTrace

C# provides language-level support for asynchronous programming, allowing developers to create applications with a responsive UI with minimum effort. The introduction of the async/await syntactic sugar in .NET Framework 4.5 has also significantly eased writing asynchronous code.
One of the downsides of asynchronous code is it’s extremely difficult to profile it and analyze its performance. This is because, when an asynchronous method is executed, control is switched from the method to its caller and back, tangling the resulting call tree.
The good thing is that dotTrace 2017.3 dramatically simplifies the analysis of asynchronous code. It marks all async call nodes in the Call Tree and groups the corresponding await time and continuation code under that node. This means that you can quickly find all “parts” of an asynchronous call in one place instead of searching in different call stacks. Note that currently, this functionality is available only for the Timeline profiling mode.
To better understand how dotTrace 2017.3 treats asynchronous code, consider the following example (the code is shown on the left, the corresponding Call Tree on the right):

Note that the call tree contains two call stacks. This is what really happens on the CLR:
- The
Mainmethod (line 1) runs theasyncmethodRunAsyncOperation(line 3), which asynchronously reads some file (line 13). - All calls preceding line 13 (including
Initon line 9) are executed on the Main thread. ReadAsync(line 13) runs a task that is performed on a Thread Pool.- While
ReadAsync(line 13) is run, the Main thread continues execution withDoAlongAsyncProcessing(line 4). - The
MoveNextcall is a callback function which returns control back to theasyncmethod (to line 14), after the asynchronous code underawait(line 13) finishes executing. MoveNextis run on a Thread Pool.
As you can see, there is no obvious link between the async call and its callback. (In a real application, things would get even worse because of a more complicated call stack.) So, how does dotTrace help with asynchronous calls analysis?
If we expand the async RunAsyncOperation call node in the Call Tree, we will see the following:
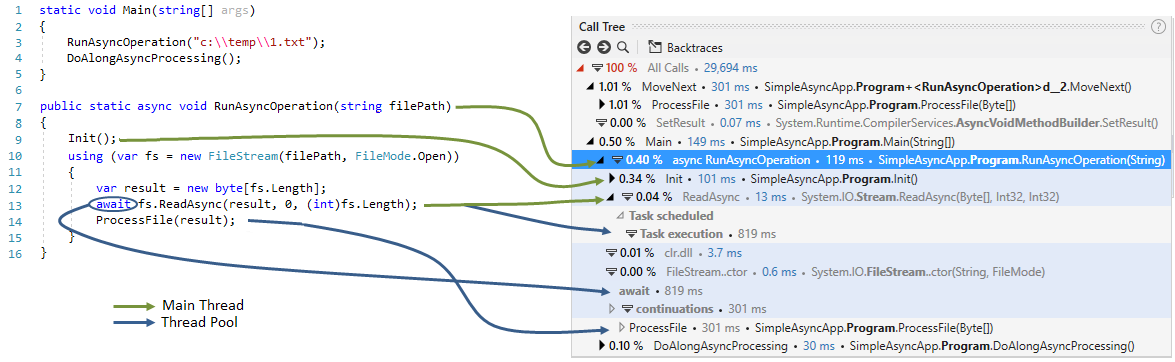
All “parts” of the asynchronous call are shown inside the async RunAsyncOperation node:
- The total time of
RunAsyncOperationis calculated as
119 ms =Init()101 ms +ReadAsync()13 ms +clr.dll3.7 ms +FileStream.ctor()0.6 ms - The
Initmethod (101 ms) is executed on the Main thread; therefore, its time is added to the total time ofRunAsyncOperation. - The
ReadAsyncis started on the Main thread (13 ms), but the subsequent task is run on a thread pool. Thus, the time of the Task execution node (819 ms) is shown in grey and is not added to the total time ofRunAsyncOperation.

- The await time in our case is equal to the Task execution time (819 ms), but in real life it can be higher as it also includes the time the task waits in the queue.
- The continuations node is the continuation code, which in our case consists of a single
ProcessFilemethod (301 ms). As this call is executed on the thread pool, its time is also shown in grey and is not added to the total time ofRunAsyncOperation.
Identifying the slowest async calls in Methods and Subsystems
As you can see, the total async call time does not include the time of all its parts in the Call Tree. But what if you want to quickly identify the ‘hot spots’ – the slowest methods in your app? For this kind of task, it would be better if the async method’s total time contained the continuation code. This is actually true for the Methods and Subsystems list.

Backtraces of continuation code
Of course, Backtraces of the continuation code will lead you back not just to the callback function, but to the original async method. This could be very helpful, for example when the continuation code throws an exception and you need to identify its origin.

Applying filter by async call total time
After you apply a filter by the call time of the async method, dotTrace will leave only the time intervals where the method was executed excluding the continuation code intervals. You can add these intervals (as well as the await time node) to the filter by clicking the corresponding check-boxes that appear in the Call Tree.

Note that if you apply filters so that the continuation code is out of scope (e.g., a filter by Main thread), the Continuations check-box will not be shown.
Tasks in Call Tree
The functionality described above works not only with async/await, but with all tasks based on the Task class. The Run node contains the Task execution node with the task delegate:

Asynchronous calls and events
Last but not least, the Call Tree works with call times as well as with all other types of events supported in the Timeline profiling mode, such as memory allocation or exceptions. For example, you can view how much memory a particular async method allocates:

To see for yourself that profiling asynchronous code is now easier than ever, download and install ReSharper Ultimate 2017.3 EAP. Let us know how it works for you – your feedback is greatly appreciated!


